Product in Product Type Estimator with Exponential and Log Function to Estimate Population Mean Using DSS
(This article belongs to the Section Mathematics (MAT))
Export Citations
Cite
Malik, S. , Sharma, R. and Gupta, R. (2025). Product in Product Type Estimator with Exponential and Log Function to Estimate Population Mean Using DSS. Journal of Engineering Research and Sciences, 4(2), 11–17. https://doi.org/10.55708/js0402002
Sangeeta Malik, Rubal Sharma and Ruchi Gupta. "Product in Product Type Estimator with Exponential and Log Function to Estimate Population Mean Using DSS." Journal of Engineering Research and Sciences 4, no. 2 (February 2025): 11–17. https://doi.org/10.55708/js0402002
S. Malik, R. Sharma and R. Gupta, "Product in Product Type Estimator with Exponential and Log Function to Estimate Population Mean Using DSS," Journal of Engineering Research and Sciences, vol. 4, no. 2, pp. 11–17, Feb. 2025, doi: 10.55708/js0402002.
To estimate the population, mean in two-phase stratified sampling, this paper aims to construct a new product in the product type estimator using exponential and log functions. When using two samples for stratification, this study attempts to solve the equation for bias and mean squared error (MSE) up to the first degree of approximation (fda). The modified estimator is more effective than \(\bar{y}_{ds}\) (the usual unbiased estimator, \(\hat{Y}^{ds}_{PP}\) (Ige & Tripathi ratio estimator) and \(\hat{Y}_{PPe}\) (ratio type exponential estimator) given by Tailor et al. theoretically and numerically. Finding out how the proposed estimators stack up against the state-of-the-art is the main motivation for this research. Extensive evaluation of the estimator's performance in a simulated environment. The suggested estimators perform better than other estimators, according to both theoretical and practical studies.
1. Introduction
Survey research and statistical inference have both seen a rise in the use of double sampling due to its efficiency and adaptability. Double sampling provides a potent method for enhancing the precision and dependability of population estimates within the framework of stratified sampling. Researchers may take advantage of stratification while addressing any constraints and uncertainties via twofold sampling, which involves two consecutive samples.
Stratified sampling is a popular technique that divides a population into several subgroups, or strata, that have common traits. Although stratification may improve the accuracy of estimates, it often necessitates knowing the strata’s sizes, means, and variances in advance. However, such data may be scarce, inaccurate, or unavailable in many real-world contexts.
One practical way to address these issues is through double sampling. Sizes, means, and variances of the strata may be gleaned from an initial sample, sometimes called a preliminary or first-phase sample. Next, the second-phase or primary sample is designed and selected using this information. It is usually optimized for efficiency and accuracy.
Multiple benefits accrue from combining stratification with double sampling, such as:
- Enhanced precision and consistency in population estimations
- Improvements in the accuracy of stratum variance and mean estimations
- Greater adaptability when faced with unknown or sparse background data
- An improvement in the treatment of missing and non-response data
Researchers may create more solid statistical conclusions by combining the benefits of stratification and double sampling to create more effective sample designs.
Steps for Double Sampling in Stratification
- Get the ball rolling by surveying a small starting sample with a preliminary survey. Sizes, means, and variances of the strata are elicited from this sample.
- Sort people into different groups or strata according to important factors like age, gender, wealth, or where they live; this process is called stratification.
- Parameter Estimation for the Stratum: Utilise the sample’s initial data to calculate the stratum’s sizes, variances, and means.
- Optimizing the Allocation of the Second-Phase Sample: Use the estimated stratum characteristics to achieve this goal. To reduce the estimator’s total variance, finding the ideal sample size for each stratum is necessary.
- Phase Two Sampling: Gather the phase two sample using the optimized sample allocation. This sample is usually more significant than the preliminary one to get more accurate estimations.
- Analyse and estimate population metrics like totals, proportions, and averages using the pooled data from both stages. Draw conclusions and judgments about the population from the data by analyzing it.
Advantages of Double Sampling in Stratification
- One advantage is that it improves accuracy. Since sample mistakes are reduced with double sampling, estimates of population parameters are more accurately reflected.
- Second, it’s more efficient to use a smaller sample size to get the same level of accuracy when using double sampling since it optimizes sample allocation.
- Improving Uncertainty Handling: Double sampling offers a solution for dealing with population-level Uncertainty and limited historical data.
- Versatility: Double sampling may be used for various populations and sample strategies.
- Cost-Effectiveness: Compared to conventional sampling techniques, double sampling may save money by lowering the needed sample size
1.1. Real-Life Applications of Double Sampling in Stratification
Estimating market size, consumer preferences, and purchasing behavior may be achieved via double sampling. Using a double-sample design, it is possible to estimate demographic variables, including income, education level, and health outcomes; estimates of agricultural revenue, animal numbers, and crop yields may all be made using double sampling. Environmental characteristics, including water and air quality, may be estimated via double sampling. The incidence, prevalence, and risk factors of diseases may be estimated via double-sampling.
Sometimes, the means of auxiliary variate is not known. Under this situation, a DS technique is used. According to this technique, a significant sample is considered to estimate population mean. A subsample of assumed size is regarded from the population. In [1], the authors developed estimators for memory type ratios and products using ranked-based sampling methods. In [2], the authors created exponential estimators for ratios and products. In [3], the researchers worked on the method for estimating the yield of cereal experiments is to sample for the grain-to-total-product ratio. In [4], the authors defined an updated stratified random sample estimator that incorporates two more variables. In [5], the researchers defined a unique Exponential Strategy for the Ratio in Ratio Type Used to Estimate the Mean of a Population. In [6], the authors worked on using supplementary data and doubling for stratification. In [7], the authors devloped a estimation of ratios using stratified random sampling models. Similarly [8] gives their work on estimators of the regression type that use the model of double sampling and two auxiliary variables. In [9], the authors defined using stratified random sampling to estimate a ratio product. In [10], the researchers defined a Using the parameters of the auxiliary variables in double sampling, chain ratio type estimators. In [11,12], the authors defined a generic class of stratified weighted population variance estimators that are robust against non-sampling errors. In [13], the authors worked on assessment of the distribution function using calibration techniques. Similarly [14] allows for more accurate ratio estimates when using stratified sampling. In [15], the authors developed a new exponential estimator of finite population mean in stratigraphy using ratio-ratio-type data collected from two samples. In [16], the researchers defined Estimator of limited population mean in stratigraphy using product-product-type exponential sampling with two samples. In [17], a work on assessment of the distribution functions of a population when non-response is present. In [18], authors defined an mean estimators in stratified two-phase sample using exponential ratio and product type.
1.2. Notations
Let the population T of M size such that T=[T1, T2, T3,…,TM]. From this population T
- A 1st phase n′ sized sample S is drawn using SRSWOR and only auxiliary variate x is observed.
- The S ′ sample that is stratified into N strata. Let \(n’_k\) be the no. of units in kth stratum such that \(\mathbf{n}’ = \sum_{k=1}^{N} \mathbf{n}’_{k}\)
- From each \(n’_k\) units, nk = uk\(n’_k\) sized sample is drawn, where (0<uk<1) is defined as probability of selecting a nk sized sample which is predetermined from \(n’_k\) sized strata and it considered as a S sample of size \(\mathbf{n} = \sum_{k=1}^{N} \mathbf{n}_{k}\). In S both y & x are observed. Let y & x be defined as study vairate and auxiliary vairate respectively.
Where k = 1, 2, …, N
1.3. Reviewing some previously exist Estimators
By considering study variable as and auxiliary variables as and
$$ \bar{X} = \frac{1}{N} \sum_{k=1}^{N} \sum_{h=1}^{M_k} x_{kh}, \quad \bar{Y} = \frac{1}{M} \sum_{k=1}^{N} \sum_{h=1}^{M_k} y_{kh}, \quad \bar{Z} = \frac{1}{M} \sum_{k=1}^{N} \sum_{h=1}^{M_k} z_{kh}$$
\(\bar{X}\), \(\bar{Y}\) and \(\bar{Z}\) are defined as population mean of and respectively.
In scheme, the usual unbiased estimator that is defined by
$$\bar{y}_{ds} = \sum_{k=1}^{N} w_k \bar{y}_k \tag{1}$$
Given by Cochran, classical ratio type estimator that was studied with technique by Ige and Tripathi as
$$\hat{Y}_{pp}^{ds} = \bar{Y}_{ds} \frac{\bar{X}’}{\bar{X}_{ds}} \tag{2}$$
where \(\bar{X}_{ds} = \sum_{k=1}^{N} w_k \bar{X}_k \quad \text{and} \quad \bar{y}_{ue} = \sum_{k=1}^{N} w_k \bar{y}_k\) based on 2nd phase sample are unbiased estimators of \(\bar{X}\) and \(\bar{Y}\) respectively.
By Bahl and Tuteja Ratio-type-exponential estimator of \(\bar{Y}\), were given in SRS as
$$\hat{Y}_{ppe} = \bar{y} \exp\left( \frac{\bar{X} – \bar{x}}{\bar{X} + \bar{x}} \right) \tag{3}$$
This estimator was studied in 2014 by Tailor and others in DSS technique as
$$\hat{Y}_{ppe}^{ds} = \bar{y}_{ue} \exp\left( \frac{\bar{x}’ – \bar{x}_{ds}}{\bar{x}’ + \bar{x}_{ds}} \right) \tag{4}$$
where \(\bar{X}’ = \sum_{k=1}^{n_k} w_k \bar{X}_k’
\) is an unbiased estimator for \(\bar{X}\) based on the 1st phase sample.
2. Suggested Novel Estimator
Inspired by Kiregyera a novel product in product-typed estimator with exponential and log function for finite population means is created with the use of DSS approach using known population means of the auxiliary variable , as
$$\hat{Y}_{pps}^{ds} = \bar{y}_{ds} \left[ \exp\left( \frac{\bar{x}_{ds} \left( \frac{\bar{Z}}{\bar{z}} \right) – \bar{x}’}{\bar{x}’ \left( \frac{\bar{Z}}{\bar{z}} \right) + \bar{x}_{ds}} \right) + \log\left( \frac{\bar{x}’ \left( \frac{\bar{Z}}{\bar{z}} \right)^{\alpha_1}}{\bar{x}_{ds} \left( \frac{\bar{Z}}{\bar{z}} \right)^{\alpha_2}} \right) \right] \tag{5}$$
α1,α2 are positive reals.
where \(\bar{Z}’ = \sum_{k=1}^{n_k} w_k \bar{Z}_k’\) is defined as an unbiased estimator of \(\bar{Z}\) on the bases of 1st sample phase.
The bias & MSE of the suggested novel estimator that can be obtained by considering \(\bar{y}_{ue} = \bar{Y}(1 + e_0),\ \bar{x}_{ds} = \bar{X}(1 + e_1),\ \bar{x}’ = \bar{X}(1 + e_1′),\ \text{and}\ \bar{z}’ = \\bar{Z}(1 + e_2′)\ \text{such that}\ \mathrm{E}(e_0) = \mathrm{E}(e_1) = \mathrm{E}(e_1′) = \mathrm{E}(e_2′) = 0\) and
$$\mathrm{E}(e_0^2) = \frac{1}{\bar{Y}^2} \left[ S_y^2 \left( \frac{1 – f}{n’} \right) + \frac{1}{n’} \sum_{k=1}^{N} w_k S_{yk}^2 \left( \frac{1}{u_k} – 1 \right) \right]$$
$$\mathrm{E}(e_1’^2) = \frac{1}{\bar{X}^2} S_x^2 \left( \frac{1 – f}{n’} \right)$$
$$\mathrm{E}(e_1^2) = \frac{1}{\bar{X}^2} \left[ S_x^2 \left( \frac{1 – f}{n’} \right) + \frac{1}{n’} \sum_{k=1}^{N} w_k S_{xk}^2 \left( \frac{1}{u_k} – 1 \right) \right]$$
$$\mathrm{E}(e_2’^2) = \frac{1}{\bar{Z}^2} S_z^2 \left( \frac{1 – f}{n’} \right)$$
$$\mathrm{E}(e_0 e_1) = \frac{1}{\bar{Y} \bar{X}} \left[ \frac{1 – f}{n’} S_{yx} + \frac{1}{n’} \sum_{k=1}^{N} w_k S_{yxk} \left( \frac{1}{u_k} – 1 \right) \right]$$
$$\mathrm{E}(e_1 e_1′) = \frac{1}{\bar{X}^2} S_x^2 \left( \frac{1 – f}{n’} \right)$$
$$\mathrm{E}(e_0 e_1′) = \frac{1}{\bar{Y} \bar{X}} \frac{(1 – f)}{n’} S_{yx}, \quad \mathrm{E}(e_0 e_2′) = \frac{1}{\bar{Y} \bar{Z}} \frac{(1 – f)}{n’} S_{yz}$$
$$\mathrm{E}(e_1 e_2′) = \frac{1}{\bar{X} \bar{Z}} \left( \frac{1 – f}{n’} \right) S_{xz}, \quad \mathrm{E}(e_1′ e_2′) = \frac{1}{\bar{X} \bar{Z}} \left( \frac{1 – f}{n’} \right) S_{xz}$$
where,
$$f = \frac{n’}{M}, \quad S_x^2 = \frac{1}{M – 1} \sum_{k=1}^{N} \sum_{h=1}^{M_k} (x_{kh} – \bar{X}_k)^2$$
$$S_y^2 = \frac{1}{M – 1} \sum_{k=1}^{N} \sum_{h=1}^{M_k} (y_{kh} – \bar{Y}_k)^2$$
$$S_z^2 = \frac{1}{M – 1} \sum_{k=1}^{N} \sum_{h=1}^{M_k} (z_{kh} – \bar{Z}_k)^2$$
$$S_{xk}^2 = \frac{1}{M_k – 1} \sum_{h=1}^{M_k} (x_{kh} – \bar{X}_k)^2$$
$$S_{yk}^2 = \frac{1}{M_k – 1} \sum_{h=1}^{M_k} (y_{kh} – \bar{Y}_k)^2$$
$$S_{zk}^2 = \frac{1}{M_k – 1} \sum_{h=1}^{M_k} (z_{kh} – \bar{Z}_k)^2$$
$$S_{yx} = \frac{1}{M – 1} \sum_{k=1}^{N} \sum_{h=1}^{M_k} (y_{kh} – \bar{Y}_k)(x_{kh} – \bar{X}_k)$$
$$S_{yz} = \frac{1}{M – 1} \sum_{k=1}^{N} \sum_{h=1}^{M_k} (y_{kh} – \bar{Y}_k)(z_{kh} – \bar{Z}_k)$$
$$S_{xz} = \frac{1}{M – 1} \sum_{k=1}^{N} \sum_{h=1}^{M_k} (x_{kh} – \bar{X}_k)(z_{kh} – \bar{Z}_k)$$
By putting the above values in (5), \(\hat{\bar{Y}}_{\mathrm{PPS}}^{\mathrm{ds}}
\) have expressed as
$$\begin{align}
\hat{Y}_{\mathrm{PPS}}^{\mathrm{ds}} – \bar{Y} &= \bar{Y} \bigg[
\frac{1}{2}(2e_0 – e_1′ – e_2′ + e_1)
+ (\alpha_2 – \alpha_1)e_2′ – e_1 + e_1′ \notag \\
&\quad + \frac{1}{8}\big(3e_2’^2 – e_1^2 – e_1’^2 + 4e_0 e_1 – 4e_0 e_1′ – 4e_0 e_2′
– 2e_1 e_1′ – 2e_1 e_2′ + 2e_1′ e_2’\big) \notag \\
&\quad + \bigg( \frac{1}{2} \big((\alpha_2 – \alpha_1 – 1) + (\alpha_2 – \alpha_1)^2\big) e_2’^2
– (\alpha_2 – \alpha_1) e_1 e_2′
– \frac{1}{2} e_1^2 \notag \\
&\quad\quad – (\alpha_2 – \alpha_1) e_1 e_1′
+ (\alpha_2 – \alpha_1) e_0 e_2′
– e_0 e_1 + e_0 e_1′ + e_1^2
\bigg) \bigg] \tag{6}
\end{align}$$
Finally, upto fda \(\mathrm{B}\left( \hat{\bar{Y}}_{\mathrm{RRS}}^{\mathrm{ds}} \right)
\) is obtained as
$$\mathrm{B}\left( \hat{\bar{Y}}_{\mathrm{PPS}}^{\mathrm{ds}} \right) =
\left[
\frac{1}{n’} \sum_{k=1}^{N} w_k \left( 1 – \frac{1}{u_k} \right) \frac{1}{\bar{X}}
\left( \frac{1}{2} S_{yxk} + \frac{5}{8} R_1 S_{xk}^2 \right)
\right.$$
$$\quad + \left( \frac{1 – f}{n’} \right)
\left\{
\left( \frac{\alpha_2 – \alpha_1}{\bar{Z}} \right)
\left( S_{yz} – \frac{1}{2} R_2 S_z^2 \right)
\right.$$
$$\quad\quad\quad\quad + \left. \left. \left( \frac{5}{8} R_2 S_z^2 – \frac{1}{2} S_{yz} \right)
\right\}
\right] \tag{7}$$
Square and expectation of (6) provides MSE \(\hat{Y}_{\mathrm{PPS}}^{\mathrm{ds}}\) as
$$\mathrm{E}\left[ \left( \hat{Y}_{\mathrm{PPS}}^{\mathrm{ds}} – \bar{Y} \right)^2 \right] = \hat{Y}^2 \, \mathrm{E} \left[ \left( \frac{2e_0 – e_1′ – e_2′ + e_1}{2} + (\alpha_2 – \alpha_1)e_2′ – e_1 + e_1′ \right)^2 \right]$$
$$\begin{align}
\mathrm{MSE}(\hat{Y}_{\mathrm{PPS}}^{\mathrm{ds}}) &= \frac{1}{4} \bar{Y}^2 \, \mathrm{E} \bigg[
4e_0^2 + e_1’^2 \notag \\
&\quad + \left((\alpha_2 – \alpha_1)(4\alpha_2 – 4\alpha_1 – 1) + 1\right) e_2’^2 + e_1^2 \notag \\
&\quad + 4e_0 e_1′ + \left(4(2\alpha_2 – 2\alpha_1 – 1)\right) e_0 e_2′ \notag \\
&\quad – 4e_0 e_1 – \left(2(2\alpha_2 – 2\alpha_1 – 1)\right) e_1′ e_2′ \notag \\
&\quad – 6e_1 e_1′ – \left(2(2\alpha_2 – 2\alpha_1 – 1)\right) e_0 e_2′
\bigg]
\end{align}$$
$$\begin{align}
\mathrm{MSE}(\hat{Y}_{\mathrm{PPS}}^{\mathrm{ds}}) &= \frac{\bar{Y}^2}{4} \bigg[
\left( \frac{1 – f}{n’} \right) S_y^2
+ \frac{4}{\bar{Y}^2} \cdot \frac{1}{n’} \sum_{k=1}^{N} w_k \left( \frac{1}{u_k} – 1 \right) S_{yk}^2 \notag \\
&\quad + \left( (\alpha_2 – \alpha_1)(4\alpha_2 – 4\alpha_1 – 1) + 1 \right)
\cdot \frac{1}{\bar{Z}^2} S_z^2 \left( \frac{1 – f}{n’} \right) \notag \\
&\quad + \frac{8}{\bar{X}^2} S_x^2 \left( \frac{1 – f}{n’} \right)
+ \frac{(4(2\alpha_2 – 2\alpha_1 – 1))}{\bar{Y} \bar{Z}} \left( \frac{1 – f}{n’} \right) S_{yz} \notag \\
&\quad – \frac{8(\alpha_2 – \alpha_1)}{\bar{X} \bar{Z}} \left( \frac{1 – f}{n’} \right) S_{xz}
– \frac{4}{\bar{Y} \bar{X}} \left( \frac{1 – f}{n’} \right) S_{yx} \notag \\
&\quad + \frac{4}{\bar{Y} \bar{X}} \cdot \frac{1}{n’} \sum_{k=1}^{N} w_k \left( \frac{1}{u_k} – 1 \right) S_{yxk}
+ \frac{4}{\bar{X} \bar{Y}} \left( \frac{1 – f}{n’} \right) S_{xy}
\bigg]
\end{align}$$
finally, fda, MSE of \(\hat{Y}_{\mathrm{PPS}}^{\mathrm{ds}}\) is obtained as
$$\begin{align}
\mathrm{MSE}(\hat{Y}_{\mathrm{PPS}}^{\mathrm{ds}}) &=
\left( \frac{1 – f}{n’} \right)
\bigg\{
\frac{1}{4} \left( (\alpha_2 – \alpha_1)(4\alpha_2 – 4\alpha_1 – 1) + 1 \right) R_2^2 S_z^2 \notag \\
&\quad + 2R_1^2 S_x^2
+ 4(2\alpha_2 – 2\alpha_1 – 1) R_2 S_{yz}
+ S_y^2
+ 8(\alpha_2 – \alpha_1) R_1 R_2 S_{xz}
\bigg\} \notag \\
&\quad + \frac{1}{n’} \sum_{k=1}^{N} w_k \left( \frac{1}{u_k} – 1 \right) \left( S_{yk}^2 – R_1 S_{yxk} \right) \tag{8}
\end{align}$$
3. Comparisons of Estimators
Here, the suggested novel estimator is being compared with previously exist estimators w.r.t their efficiencies.
In , the \(\mathrm{var}(\bar{y}_{\mathrm{ds}})
\) MSE of author and Ige & Tripathi estimator are respectively given by
$$\mathrm{V}(\bar{y}_{\mathrm{ds}}) = S_y^2 \left( \frac{1 – f}{n’} \right) + \frac{1}{n’} \sum_{k=1}^{N} w_k S_{yk}^2 \left( \frac{1}{u_k} – 1 \right) \tag{9}$$
$$\mathrm{MSE}(\hat{Y}_{\mathrm{PP}}^{\mathrm{ds}}) = S_y^2 \left( \frac{1 – f}{n’} \right) + \frac{1}{n’} \sum_{k=1}^{N} w_k \left( \frac{1}{u_k} – 1 \right) \left( S_{yk}^2 + R_1^2 S_{xk}^2 – 2R_1 S_{yxk} \right) \tag{10}$$
$$\mathrm{MSE}(\hat{Y}_{\mathrm{PPe}}^{\mathrm{ds}}) = S_y^2 \left( \frac{1 – f}{n’} \right) + \frac{1}{n’} \sum_{k=1}^{N} w_k \left( \frac{1}{u_k} – 1 \right) \left[ S_{yk}^2 + \frac{R_1^2}{4} \left( S_{xk}^2 – \frac{S_{yxk}}{R_1} \right) \right] \tag{11}$$
By comparing (8), (9), (10) and (11) one can easily found that the suggested novel estimator named as \(\hat{Y}_{\mathrm{PPS}}^{\mathrm{ds}}\) is better w.r.t. efficiency comparison then (i) \(\bar{y}_{\mathrm{ds}}\) if
$$\begin{align}
\left( \frac{1 – f}{n’} \right)
&\left(
\frac{1}{4} \left( (\alpha_2 – \alpha_1)(4\alpha_2 – 4\alpha_1 – 1) + 1 \right) R_2^2 S_z^2
+ 2R_1^2 S_x^2 \right. \notag \\
&\quad \left. + 4(2\alpha_2 – 2\alpha_1 – 1) R_2 S_{yz}
+ 8(\alpha_2 – \alpha_1) R_1 R_2 S_{xz}
\right) \notag \\
&\quad < \sum_{k=1}^{N} w_k \left( \frac{1}{u_k} – 1 \right) \left( R_1 S_{yxk} \right) \tag{12}
\end{align}$$
(ii) Ige-Tripathi estimator \(\hat{\bar{Y}}_{\mathrm{PP}}^{\mathrm{ds}}\) if
$$\begin{align}
\left( \frac{1 – f}{n’} \right)
&\left(
\frac{1}{4} \left( (\alpha_2 – \alpha_1)(4\alpha_2 – 4\alpha_1 – 1) + 1 \right) R_2^2 S_z^2
+ 2 R_1^2 S_x^2 \right. \notag \\
&\quad \left. + 4(2\alpha_2 – 2\alpha_1 – 1) R_2 S_{yz}
+ 8(\alpha_2 – \alpha_1) R_1 R_2 S_{xz}
\right) \notag \\
&\quad < \sum_{k=1}^{N} w_k \left( \frac{1}{u_k} – 1 \right) \left( R_1 S_{yxk} – R_1^2 S_{xk}^2 \right) \tag{13}
\end{align}$$
(iii) Estimator \(\hat{\bar{Y}}_{\mathrm{PPe}}^{\mathrm{ds}}
\) if
$$\begin{align}
\left( \frac{1 – f}{n’} \right)
&\left(
\frac{1}{4} \left( (\alpha_2 – \alpha_1)(4\alpha_2 – 4\alpha_1 – 1) + 1 \right) R_2^2 S_z^2
+ 2 R_1^2 S_x^2 \right. \notag \\
&\quad \left. + 4(2\alpha_2 – 2\alpha_1 – 1) R_2 S_{yz}
+ 8(\alpha_2 – \alpha_1) R_1 R_2 S_{xz}
\right) \notag \\
&\quad < \sum_{k=1}^{N} w_k \left( 1 – \frac{1}{u_k} \right) \left( \frac{1}{4} R_1^2 S_{xk}^2 + \frac{5}{4} R_1 S_{yxk} \right) \tag{14}
\end{align}$$
4. Empirical Study
Here, one natural data of population is considered for the purpose to check performance of the suggested estimator by comparing it with considered estimators with the help of case study with different value of and .
4.1. Population I [Source: Murthy (1967),p.228]
Y : As Outcome,
X : As Fixed capital and
Z: As No.of workers,
Table 1: Parameters for Stratified Sampling Analysis
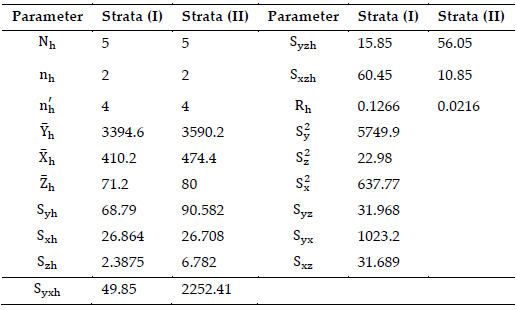
Table 2: PREs of \(\bar{y}_{\mathrm{ds}},\ \hat{Y}_{\mathrm{PP}}^{\mathrm{ds}},\ \hat{Y}_{\mathrm{PPe}}^{\mathrm{ds}} \ \text{and} \ \hat{Y}_{\mathrm{PPS}}^{\mathrm{ds}} \ \text{with respect to} \ \bar{y}_{\mathrm{ds}}\)
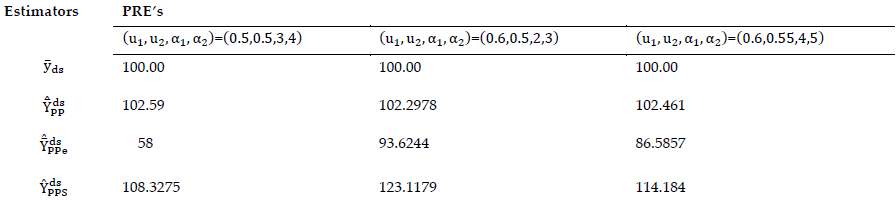
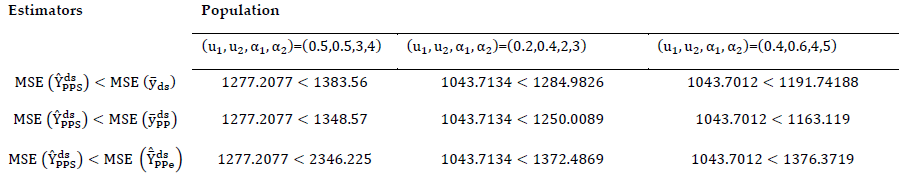
Table 3: Numerical values of MSE given in (12), (13) and (14)
5. Conclusions
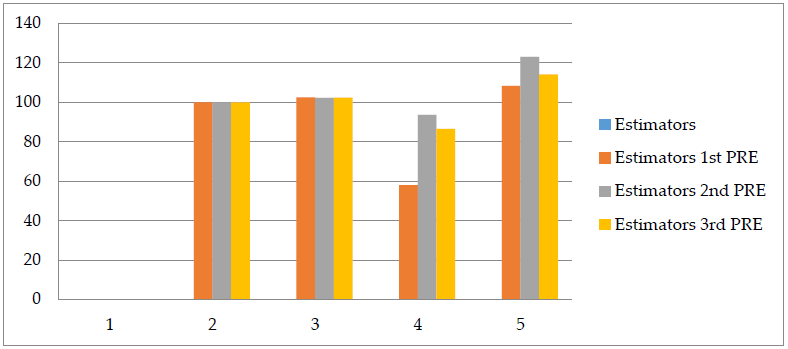
In this article, the product in product typed estimator with exponential and log function for the population-mean is developed. Since ratio typed estimator outperforms the simple mean estimator, we have substituted the sample mean derived from 1st phase sample with a ratio estimator that makes the use of the known \(\bar{Z}\). Section (4) presents empirical examples that support the previously stated notion that was used to build \(\hat{Y}_{\mathrm{PPS}}^{\mathrm{ds}}\). Table (2) shows that out of all the estimators that were investigated, estimator \(\hat{Y}_{\mathrm{PPS}}^{\mathrm{ds}}\) had the highest percent relative efficiency. The conditions under which \(\hat{Y}_{\mathrm{PPS}}^{\mathrm{ds}}\) have a lower MSE are shown in Table (3). The best per cent relative efficiency of \(\hat{Y}_{\mathrm{PPS}}^{\mathrm{ds}}\) is shown in Table (2) and figure 1 represents the graphical explanations for each estimator and shows the results are best for suggested estimators. All the requirements acquired in Section (3) are met, as shown in Table (3). Thus, if the conditions which are given in Section (3) are satisfied, \(\hat{Y}_{\mathrm{PPS}}^{\mathrm{ds}}\) is recommended for practical use because of its higher precent relative efficiency comparatively in the field as an alternative to the \(\bar{y}_{ds}\) (the usual unbiased estimator), \(\hat{Y}_{\mathrm{PP}}^{\mathrm{ds}}\) (Ige & Tripathi ratio estimator) and \(\hat{Y}_{\mathrm{PPe}}\) (ratio type exponential estimator) given by Tailor in the case of the DSS technique.
- I. Aslam, M. Noor-Ul Amin, M. Hanif, and P. Sharma, “Memory type ratio and product estimators under ranked-based sampling schemes,” Communications in Statistics – Theory and Methods, vol. 52, 1155–1177, 2023, doi: 10.1080/03610926.2021.1924784.
- S. Bahl and R. K. Tuteja, “Ratio and product type exponential estimators,” Journal of Information and Optimization Sciences, vol. 12, no. 1, 159–164, 1991, doi: 10.1080/02522667.1991.10699058.
- W. G. Cochran, “The estimation of the yield in cereal experiments by sampling for the ratio of grain to total produce,” The Journal of Agricultural Science, vol. 30, 262–275, 1940, doi: 10.1017/S0021859600048012.
- M. Dalabehara and L. N. Sahoo, “A new estimator with two auxiliary variables for stratified random sampling,” Statistica, vol. 59, no. 1, 101–107, 1999, doi: 10.6092/issn.1973-2201/1106.
- A. Gupta and R. Tailor, “Ratio in ratio type exponential strategy for the estimation of population mean,” Journal of Reliability and Statistical Studies, vol. 14, no. 2, 551–564, 2021, doi: 10.13052/jrss0974-8024.1429.
- A. F. Ige and T. P. Tripathi, “On double sampling for stratification and use of auxiliary information,” Journal of the Indian Society of Agricultural Statistics, vol. 39, no. 2, 191–201, 1987.
- C. Kadilar and H. Cingi, “Ratio estimators in stratified random sampling,” Biometrical Journal, vol. 45, no. 2, 218–225, 2003.
- B. Kiregyera, “Regression type estimators using two auxiliary variables and the model of double sampling,” Metrika, vol. 31, 215–226, 1984, doi: 10.1007/BF01915203.
- N. Koyuncu and C. Kadilar, “Ratio and product estimators in stratified random sampling,” Journal of Statistical Planning and Inference, vol. 139, no. 9, 2552–2558, 2009, doi: 10.1016/j.jspi.2009.02.005.
- P. Mehta and R. Tailor, “Chain ratio type estimators using known parameters of auxiliary variates in double sampling,” Journal of Reliability and Statistical Studies, vol. 13, no. 2–4, 243–252, 2020, doi: 10.13052/jrss0974-8024.13242.
- M. N. Murthy, Sampling Theory and Methods, Calcutta, India: Statistical Publishing Society, 1967, vol. xxiv, 684. [Online]. Available:
https://www.cabidigitallibrary.org/doi/full/10.5555/19702700466 - M. K. Pandey, G. N. Singh, T. Zaman, A. Mutairi, and M. Mustafa, “A general class of improved population variance estimators under non-sampling errors using calibrated weights in stratified sampling,” Scientific Reports, vol. 14, 2948, 2024, doi: 10.1038/s41598-023-47234-1.
- M. Rueda, S. Martínez, H. Martínez, and A. Arcos, “Estimation of the distribution function with calibration methods,” Journal of Statistical Planning and Inference, vol. 137, no. 2, 435–448, 2007, doi: 10.1016/j.jspi.2006.02.002.
- J. Shabbir and S. Gupta, “Improved ratio estimators in stratified sampling,” American Journal of Mathematical and Management Sciences, vol. 25, no. 1–2, 293–311, 2005, doi: 10.1080/01966324.2005.10737666.
- H. P. Singh and P. Nigam, “Ratio-Ratio-Type exponential estimator of finite population mean in double sampling for stratification,” International Journal of Agricultural and Statistical Science, vol. 16, no. 1, 251–257, 2020a. [Online]. Available: https://www.researchgate.net/profile/Pragati-Nigam/publication/345161967_RATIO-RATIO-TYPE_EXPONENTIAL_ESTIMATOR_OF_FINITE_POPULATION_MEAN_IN_DOUBLE_SAMPLING_FOR_STRATIFICATION/links/5faad4cfa6fdcc331b930530/RATIO-RATIO-TYPE-EXPONENTIAL_ESTIMATOR_OF_FINITE_POPULATION_MEAN_IN_DOUBLE_SAMPLING_FOR_STRATIFICATION.pdf
- H. P. Singh and P. Nigam, “Product-Product-Type exponential estimator of finite population mean in double sampling for stratification,” International Journal of Mathematics and Statistics, vol. 20, no. 1, 165–179, 2022. [Online]. Available: https://www.researchgate.net/profile/Pragati-Nigam/publication/360699467_A_General_Class_of_Product-cum-Ratio-Type_Exponential_Estimators_in_Double_Sampling_for_Stratification_of_Finite_Population_Mean/links/6285e53e247e622c2efb57d7/A-General-Class-of-Product-cum-Ratio-Type-Exponential-Estimators-in-Double-Sampling-for-Stratification-of-Finite-Population-Mean.pdf
- M. Yaqub and J. Shabbir, “Estimation of population distribution function in the presence of non-response,” Hacettepe Journal of Mathematics and Statistics, vol. 47, no. 2, 471–511, 2018. [Online]. Available: https://dergipark.org.tr/en/pub/hujms/issue/38251/442321
- T. Zaman and C. Kadilar, “Exponential ratio and product type estimators of the mean in stratified two-phase sampling,” AIMS Mathematics, vol. 6, no. 5, pp. 4265–4279, 2021. [Online]. Available: https://pdfs.semanticscholar.org/a208/bfac5a1185c7e0a368f1e004e12f5d24d714.pdf