An Overview on Various Techniques used for Correct Interpretation of Roadway Symbols

(This article belongs to the Special Issue on Special Issue on Multidisciplinary Sciences and Advanced Technology 2022 and the Section Information Systems – Computer Science (ISC))
Export Citations
Cite
Deshpande, A. V. (2022). An Overview on Various Techniques used for Correct Interpretation of Roadway Symbols. Journal of Engineering Research and Sciences, 1(3), 28–38. https://doi.org/10.55708/js0103004
Abhinav Vinod Deshpande. "An Overview on Various Techniques used for Correct Interpretation of Roadway Symbols." Journal of Engineering Research and Sciences 1, no. 3 (March 2022): 28–38. https://doi.org/10.55708/js0103004
A.V. Deshpande, "An Overview on Various Techniques used for Correct Interpretation of Roadway Symbols," Journal of Engineering Research and Sciences, vol. 1, no. 3, pp. 28–38, Mar. 2022, doi: 10.55708/js0103004.
In this study paper, a comparative analysis of various image enhancements in local domain techniques was made based on three-dimensional image quality statistics namely Mean Squared Error (MSE), Peak Signal to Noise Ratio (PSNR) and Image Quality Model (SSIM) to determine image quality. especially among them so that the process of image enhancement in the local domain is carried out. The conditions for choosing the best method are to have a small number of Mean Squared Error (MSE) and a high number of Peak Signal to Noise Ratio (PSNR) and Structural Properties to measure Image Quality (SSIM).
1. Introduction
Car companies are booming due to the increase in private car production and growth in their consumption. Adding to the increase in competitors also encourages the increase in the number of companies. It will simplify the process of thinking of other novel methods using road identification. It helps to provide a safe driving environment [1-5]. The speed of a moving vehicle can be determined by using road signs that set the speed limit. Its speed can be controlled by using them. They find use that includes places that use good travel. Many road signs cover these areas [6 – 10]. When driving, the driver usually ignores the speed limit. This conveys the message of the speed of the car. The chances of an accident can be reduced and thus ensure the safety of the driver. Now, the time has come to design an architecture that automatically identifies Speed Limit symbols. It also warns him to stop the car [11]-[15]. The Speed Limit signal was performed following the test. Candidates entitled Maternal Districts are found in the list. The marker is categorized by identifying the regions of interest [16]-[20]. Colorful and common symptoms can be seen in order to fulfill a motive [21]-[25].
1.1. Sign’s interpretation methods
The original problem was divided into a problem category corresponding to what were two coded sections in the ECOC matrix. Class dividers are assigned to all real classes using these methods. Considering the research work found in [26 – 30], the color version under discretization of the visible spectrum was compared with other markers. Discriminatory regional groups were considered under different categories. Using standard street map templates, they were taught in offline mode thus using a one-size-fits-all principal to maximize diversity [1-5]. Color range adjustment was used to compare the actual color of the road sign that was differentiated and thus became more robust thus laying the basis for defining the level of variation [6 – 10]. Assessing the actual performance is very difficult in this case [11 – 15]. Performance testing of multiple machine learning methods is not possible due to the lack of a suitable website or strategy [16 – 20]. Several attempts have been made to identify road signs despite the inclusion of manuscripts [21 – 25]. Rapid growth is reflected in field-based research work using road signs [26 – 30]. Research conducted in this field in the light of the past few decades clearly shows the concepts. Different types of ideas and new strategies are used [1-5]. The road signal circuits that are most commonly used are the acquisition module [6 – 10]. The viewing module offers different classes and shows a given road sign category [11 – 15].
2. Literature Survey
It is a difficult task when it comes to comparing actual performance as there is no such type of validated data or system to test the performance of a few machine learning methods that try to find a solution to the problem of road signs, although there is literature [16 – 20]. locating and monitoring road signs for the last few decades. Numerous novel ideas and practical methods have been suggested [21 – 25]. Typically, the acquisition component seeks out potential traffic signal circuits while the phase in which the traffic signal is a part is determined by the awareness component. The traditional methods used for the purpose of obtaining sign boards can be divided into three main classes, namely, color-based methods, shape-based methods and smooth window-based methods. One might consider the process of recognizing the image of a particular sign among all the other members, the function of Herculean when it comes to seeing the image of a sign board in a group of other sign boards. It has been found that a variety of techniques are available in the field of image classification of well-known symbols from common methods such as template matching in complex machine learning techniques. One of the most important and critical algorithms used to perform the task of separating multiple image board images can be attributed to the well-known Vector Support Machine (SVM) algorithm. When authorized transcripts [26 – 30] are considered, one can obtain a value attached to the automatic acquisition and display of the signature board that supports Support Vector Machines (SVMs) in combination with Gaussian kernels. However, the system was required to separate candidate blogs in the status category before recognition. As a sequence, only the pixels that were part of the symbol were used to form the element vector. In [1-5], alternatives to those currently available in the context of automatically detecting and seeing signal boards have been made public. It can be misunderstood that in this study the emphasis was on improving the accuracy of the most common methods of automatically detecting and identifying signals and thus leading to a reduction in the number of vectored entries that appear to be most useful. and the duration of testing the latest templates [6-10]. The SVM method of distinguishing traffic signal recognition was provided [11] -15] while in [16 – 20] an effective strategy that facilitates the process of detecting sloping speed signals by removing rotating elements with the help of the Fourier adjective. -based wave launch. The different categories of sign board images were divided with the help of Support Vector Machines (SVMs) which combines the formation of binary trees. In [21 – 25], structural-based classification was constructed using SVM. Representing the features, the two types of features include an unlimited framework and a temporary production proposed by some scientists. One can conclude that conducting a comprehensive assessment process satisfies our main goal which involves specific processes that include the identification of road signs that fall into different categories including multi-layer geometric patterns and controls of road signs that reflect control. speed of moving vehicles in a safe and healthy environment. One might consider the process of recognizing the image of a particular sign among all the other members, the function of Herculean when it comes to seeing the image of a sign board in a group of other sign boards. It has been found that a variety of techniques are available in the field of image classification of well-known symbols from common methods such as template matching in complex machine learning techniques. One of the most important and critical algorithms used to perform the task of separating multiple image board images can be attributed to the well-known Vector Support Machine (SVM) algorithm.
3. Driver Fatigue and Driver Mental Workload
Driver fatigue is a major cause of road accidents. Fatigue is also a structure that includes factors such as day time, waking time, activity duration and monotony, and safety-related outcomes [26 – 30]. Fatigue can be caused by drowsiness (drowsiness), boredom, and mental or physical fatigue. From these exciting features, drowsiness is considered the most important factor in fatigue when used in driving situations. Drowsiness of drivers has contributed to road accidents between professionals [1-5] and the average number of driving [6 – 10]. Accidents caused by the driver’s drowsiness can have the same death rate as alcohol-related accidents [11 – 15]. Many factors contribute to sleep, such as long working hours [16 – 20], lack of sleep [21 – 25] and medical conditions [26 – 30]. Insomnia is very common in some communities, including junior doctors [1-5], underwater sailors [6 – 10] and ‘miners’ flight [11-15]. Chronic sleep deprivation is a known risk factor in driving [16 – 20]. It was also confirmed that the 24 h circadian rhythm was marked with peaks and holes in the levels of awareness as evidence of studies that included both independent sleep measures and objectives [21 – 25]. Work-related factors also contribute to driver drowsiness [26 – 30]. These factors may include driving duration [1-5] and monotony [6 – 10] as experience in highway driving [11 – 15]. The effects of drowsiness are reflected in the reduced number of nutritional warnings [16 – 20]. In driving conditions this leads to significant changes in driver performance such as reduced speed, distance between vehicles and road maintenance [21 – 25] all increasing the risk of road accidents [26 – 30]. With growing evidence linking driver drowsiness to road accident accidents, the industry has responded by investing in driver monitoring tools aimed at reducing this risk [1-5].
4. Tools and Techniques to Monitor Driver Fatigue
These tools use a variety of methods including those based on (a) continuous driving time, (b) direct driver performance (e.g., steering) or (c) physical response (e.g., eye metrics). Among the latter, features of the eyes and eyelids have been used to reduce drowsiness [6 – 10]. One of these tools, the Optalert Alertness Monitoring System (OAMS) [11 – 15] uses infra-red (IR) reflectance oculography to monitor the movement of the eyelid.
The system uses an IR emitter and a spectrum embedded in the spectrum to continuously measure the blink of an eye, from where sleep levels are detected. OAMS has been used to diagnose and monitor driver drowsiness in mines [16 – 20] and in the road transport industry [21 – 25] and in driver drowsiness [26 -33]. OAMS has been used in commercial settings primarily to provide sleep data in a central monitoring area. If the driver’s drowsiness reaches a certain level of risk, intervention (e.g., compulsory leave) may be made. Such applications come with high cost of monitoring and use. Moreover, such interventions are more dependent on the detection of fatigue than on prevention. The current study examines the benefits of responding to real-time drowsiness in drivers to avoid fatigue [1-5] reports observational data showing a decrease in moderate sleep apnea related to driver response during scheduled discharge. of OAMS in many mining areas [6 – 10].
These data suggest that, at the level of group variability, a real-time driver response may reduce their drowsiness, compared to OAMS monitoring activity alone. They do not; however, provide insight into how each driver might respond to such a response. Our research focuses on this individual response and improved understanding of the use of real-time feedback for individual drivers that could lead to a cheaper strategy to improve the driving results of at-risk individuals. It also aims to evaluate the effectiveness of OAMS in improving driver performance. Focused on Australian Army Reserve staff. For many of the participants, the Army training weekend is usually preceded by a full week of operation and usually a long journey to the Army Reserve work area. In addition, members often report to work during the day, which includes commuting to and from work.
4.1. Definitions of various Image Quality Metrics
4.1.1. Mean Squared Error (MSE)
Mean Squared Error (MSE) or Mean Squared Deviation (MSD) measurement or non-observable value measurement method is defined as the square measure of error square the difference between the estimated values and the estimated value.
4.1.2. Peak Signal to Noise Ratio (PSNR)
The Peak Signal to Noise Ratio (PSNR) is defined as the ratio between the maximum potential for a given signal and the potential for destructive noise affecting the reliability of its representation.
4.1.3. Structural Similarity for measuring the Image Quality (SSIM)
Image Quality Assignment (SSIM) is defined as the method used to measure the similarity between two images and is also used to predict the assumed quality of digital television and cinema images and other digital forms. photos and videos.
5. New Technique suggested by researchers
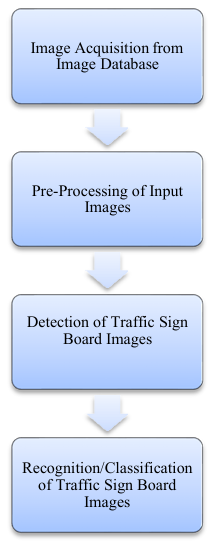
A block diagram of our proposed research methodology is shown in Figure (Figure 1) below:
In our test, a traffic signal image site is developed that includes different types of traffic signals of different colors, shapes, sizes and light variations depending on the surrounding weather conditions such as sun, cloud, rain, fog, snow, smoke. and dark weather etc.
After traffic signal images are captured on a mobile sign traffic website with the help of an external mobile camera installed in the car or in some cases it may be mounted on the body itself and in some cases, the driver may wear dual camera mounted on both sides of the camera. pre-embedded images, detection of road signs followed by a process of identifying a sign board followed by a road sign. process. recognition and appropriate classification. The embedded image is found on the image website and is subject to some previous processing functions such as extracting audio and enhancing the image on a local background. Images are obtained using the help of other methods used to separate the image. Featured images are then subjected to a process where the whole image is divided into multiple images or a set of identical images using the appropriate classification process. After the sorting process, the images are subjected to a feature removal process in which a set of relevant features was removed from the image using specific feature removal techniques. Images are then categorized with the help of a suitable classification algorithm commonly used in the field of work-related applications where an accurate and accurate description of the sign boards is required to ensure the safety of the vehicle driver. for the purpose of separating images.
6. Results obtained practically as well as Discussion
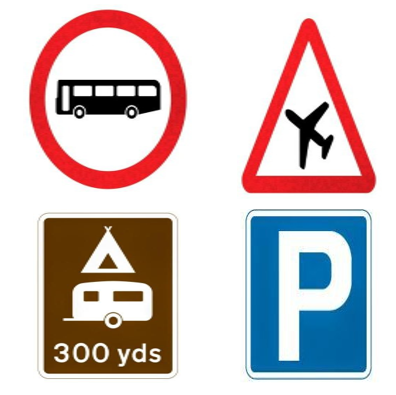
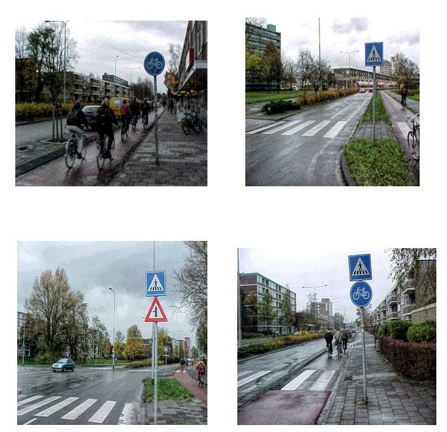
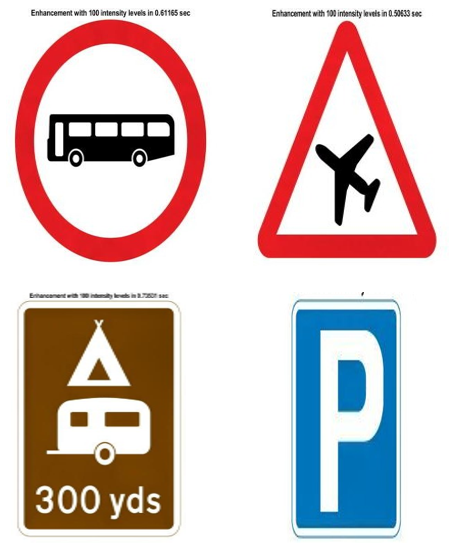
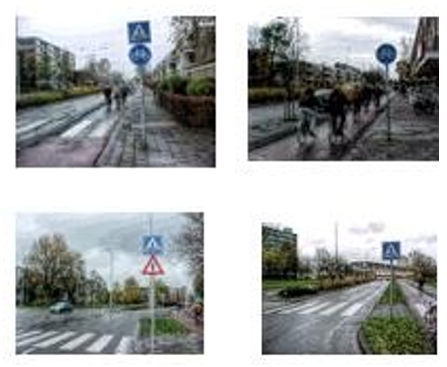
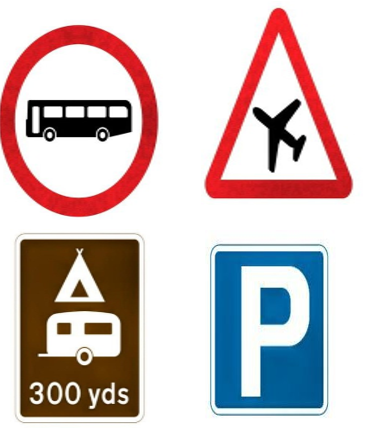
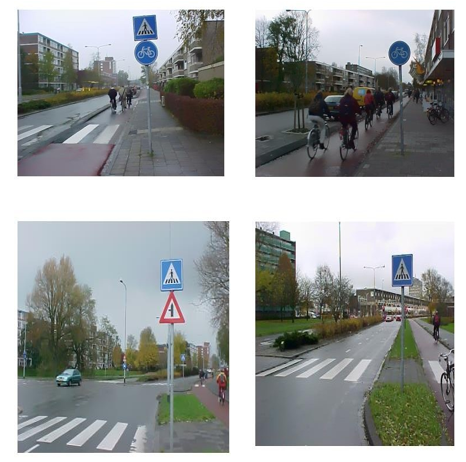
In this experiment, a traffic signal image was prepared that included images of different road signs of different categories of different colors, shapes, sizes and light variations depending on the surrounding weather conditions such as sun, cloud, rain, fog, snow, density. and dusty weather etc. There are a total of 679 road markings on the 18-dimensional training image website and a total of 48 road markings available at the test site. The training image website is divided into two main categories, namely, non- textual image symbols containing only the color, composition and available text details as well as graphic imagery images containing the color, shape and text information contained in it. Examples of different traffic signals available on our Test and Training photography site are included (Figures 2 and 3) on this page.
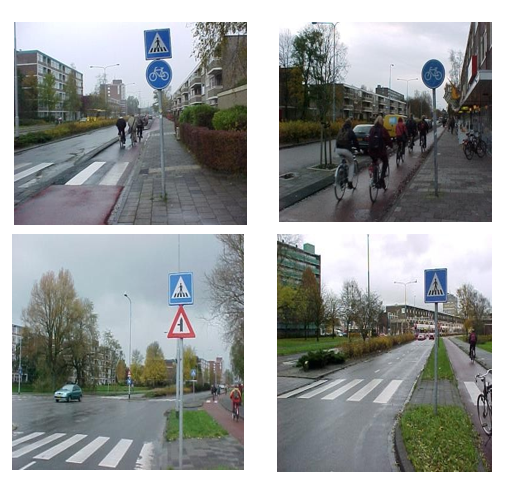
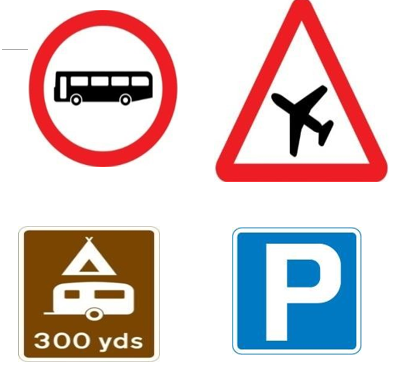
Image filtering techniques with the help of Arithmetic Mean Filter, Circular Averaging Filter (Pillbox), Harmonic Mean Filter, Box Filter, Gaussian Filter were used and various parameters provide a clear idea of the image quality considered. they are numbered. There are a number of parameters that determine the quality of the included image provided when Medium Error (MSE), Peak Signal to Noise Ratio (PSNR) and Image Quality Correction (SSIM) are the same. A table format with numerical values of the above parameters (Table 1) will be very useful in determining which best algorithm to use, for example, PSNR and SSIM values should be higher while MSE values should be lower than a given algorithm. The algorithm that eliminates the above criteria will be used in the research project for this project. The main goal of this project is to focus on comparative work that combines various techniques for removing noise from digital images using standard performance indicators that allow the researcher to select and apply the best algorithm for future work. Processes that include digital image enhancement, image classification using appropriate techniques, removal of useful features in images followed by image classification using a separator algorithm that should be set for future work. The strategies integrated into performing these specific tasks will also address the comparative process outlined in the above section of this paper. The strategies selected for the proposed activity will be taken from these comparative activities using the best and most accurate method of almost 100% and the main goal will be to achieve the best results compared to other strategies found in the literature section. to ensure high fidelity, efficiency and durability in sound present in two-dimensional images. The different types of algorithms used in the above test are discussed in this paper.
7. Various Image Enhancement in the spatial domain techniques
7.1. Fast Local Laplacian Filtering (FLLF) Type 1
Fast Laplacian Local Filter Method (FLLF) Type 1 is used for the purpose of enhancing the input color provided by enhancing the color contrast of the color image. In this process, the provided input image is first inserted into the workspace by setting the filter parameters to increase the data to less than 0.4. Then, the Fast Local Laplacian (FLLF) filter method is applied to the resulting image to extract the output image. The results obtained after performing the Phase 1 Fast Local Laplacian (FLLF) process are shown as shown in Figure 4 (Figures 4 and 5) below:
7.2. Fast Local Laplacian Filtering (FLLF) Type 2
The calculation value required for digital image processing is very high in the case of Fast Local Laplacian (FLLF) Type 2 filtering compared to the various algorithms used to enhance the input color rendering provided. The algorithm measurement process is performed with the help of the Num Intensity Levels parameter that separates the pixel width from the color input of the image in the number of samples. Performance speed and image quality of the input color provided is measured using this parameter. In this process, the inserted image of the actual color is first introduced into the workspace and displayed. The information contained within a given image is processed using a sigma value parameter and the brightness increases using an alpha value parameter which also effectively enhances the input of the input color image. Killing speed can be increased by using a small number of samples but also usually produces art objects that are clearly visible to the naked eye especially in areas with flat contrast. Work can be timed using only 20 power levels.
The resulting image is subject to processing and is displayed as a final output. Results obtained after performing the Laplacian Rapid Screening (FLF) procedure Type 2 is shown as shown in Figure (Figures 6 and 7) below:
7.3. Fast Local Laplacian Filtering (FLLF) Type 3
In this process, the color input provided is subjected to processing with the help of the Fast Local Laplacian Filtering (FLLF) Type 3 strategy and is timed using 100 degrees of firmness as the results obtained after performing the whole process are much better compared to the results. obtained during the sample image provided thus a large number of samples are used although the time required to process the image is very high. The resulting image is subject to processing at 100 power levels and is displayed. The results obtained after performing the Laplacian Rapid Scheme (FLF) Type 3 are shown as shown in Figure 8 (Figures 8 and 9) below:
7.4. Fast Local Laplacian Filtering (FLLF) Type 4
In the Fast Local Laplacian (FLLF) type 4 filtering method, the color variation of the included color image is enhanced using the color mode parameter. First, the inserted image is imported into the workspace and the actual image size is reduced and displayed. Filter parameters are adjusted in such a way that details smaller than 0.3 in normal range 0 to 1 can be amplified dramatically. In this process, the embedded color image is enhanced by enhancing the local light intensity. The results obtained after performing the Laplacian Rapid Transmission Process (FLLF) Type 4 are shown as shown in Figure 10 (Figures 10 and 11) below:

7.5. Fast Local Laplacian Filtering (FLLF) Type 5
In this Fast Local Laplacian (FLLF) type 5 filtering process, the given color image is enhanced by enhancing the local color brightness. Colors are most saturated when Color Mode is set to split instead of light despite the fact that an equal amount of light is applied to each image while testing processes are applied to the input images. The results obtained after performing the Laplacian Rapid Screening (FLF) procedure Type 5 are shown as shown in Figure (Figures 12 and 13) below:
7.6. Fast Local Laplacian Filtering (FLLF) Type 6
In the Fast Local Laplacian (FLLF) Type 6 filter process, the input color is first applied to the workspace and then displayed. It is converted into a floating-point image format for the purpose of adding external sound in an easy way. Gaussian sound with zero meaning and variation as 0.001 is added to the external input image. The data size is fine-tuned following the set value of the slip for the purpose of the application. Then, the Edge-sensitive filter is applied to a specific color source. There is an amazing improvement in the provided image of Peak Signal to Noise Ratio (PSNR). It is also noted that the details are smooth and there is no change in the sharp contrast at the edges of the input color image. Results obtained after performing the Laplacian Rapid Sorting Process (FLLF) Type 6 are shown as shown in Figure (Figures 14 and 15) below:

7.7. Fast Local Laplacian Filtering (FLLF) Type 7
In this Laplacian Quick Area (FLLF) Filtering Process 7, the information that is naturally present within a given image is corrected without interfering with sharpening the edges present in the image. First, a color-coded image is inserted into the workspace and displayed. The amplitude of the data is set to be smooth and the slide value is also set to the maximum value of the application. It is generally recognized that the filter produces excellent quality results with a small number of hardness levels when the alpha number is greater than 1. The degree of stiffness is set to a minimum value to ensure that the input image is processed at a fast speed. . Then, a filter is applied. The output image is displayed after the complete image filtering process has been performed at the end of the test process. The results obtained after performing the Rapid Laplacian Local Filtering Process (FLLF) Type 7 are shown as shown in Figure 16 (Figures 16 and 17) below:
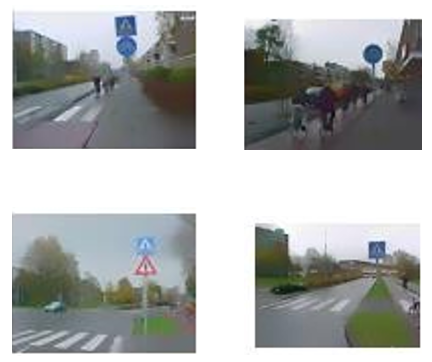
Table 1: Comparison of various image enhancement in the spatial domain techniques in our Test data based upon Mean Squared Error, PSNR and SSIM numerical values
1 | 2016 | Fast Local Laplacian Filtering (FLLF) Type 1 | 298.540 | 23.409 | 0.811 |
2 | 2016 | Fast Local Laplacian Filtering (FLLF) Type 2 | 133.472 | 26.911 | 0.878 |
3 | 2016 | Fast Local Laplacian Filtering (FLLF) Type 3 | 156.974 | 26.212 | 0.868 |
4 | 2016 | Fast Local Laplacian Filtering (FLLF) Type 4 | 841.632 | 18.920 | 0.644 |
5 | 2016 | Fast Local Laplacian Filtering (FLLF) Type 5 | 809.782 | 19.089 | 0.649 |
6 | 2016 | Fast Local Laplacian Filtering (FLLF) Type 6 | 141.266 | 26.654 | 0.887 |
7 | 2016 | Fast Local Laplacian Filtering (FLLF) Type 7 | 0.0002 | 35.445 | 0.972 |
8 | 2006 | Entropy Filtering | 18.16306875 | -12.562758333333 | -0.00484375 |
9 | 2006 | Standard Deviation Filtering | 335.46449375 | -24.801495833333 | -0.00370625 |
10 | – | Pretrained Neural Network based Image Denoising | 1.25E-5 | 47.180 | 0.998 |
Table 3: Comparison of various image enhancement in the spatial domain techniques in our Test data against our proposed technique depending on various image quality metrics like MSE, PSNR and SSIM numerical values
1 | 2006 | Pretrained Neural Network based Image Denoising | 1.25E-5 | 47.180 | 0.998 |
2 | 2006 | Fast Local Laplacian Filtering (FLLF) Type 7 | 0.0002 | 35.445 | 0.972 |
3 | Our Proposed Technique | Pretrained Neural Network based Image Denoising + Fast Local Laplacian Filtering (FLLF) Type 7 | 0.0000 | Infinity | 1.0000 |
8. Uniqueness of Propounded Strategy
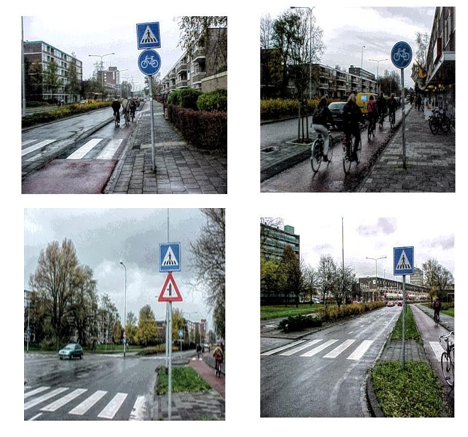
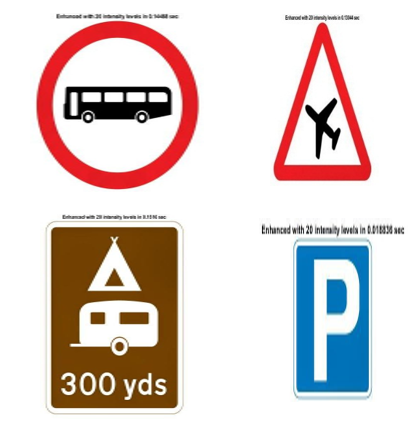
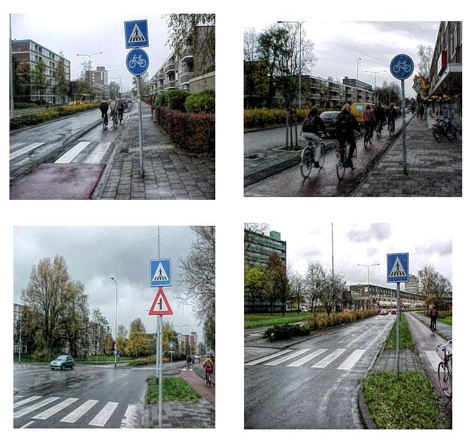
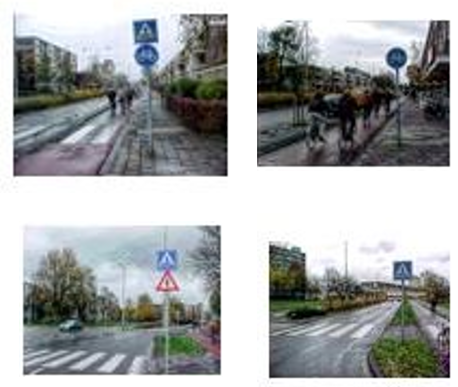
The main objective of our proposed research project is to identify the best way to remove natural noise from an image among various image removal techniques based on different image quality metrics such as Mean Squared Error (MSE), Peak Signal to Noise Rate (PSNR) and Image Quality. SSIM). The best strategy is identified by partners by considering that it has the smallest number of Mean Squared Error (MSE) numbers and has the largest value. Higher Signal Number to Noise Ratio (PSNR) and Parallel Image Quality (SSIM). After the Mean Squared Error (MSE) number, Peak Signal to Noise Ratio (PSNR) and Measurement Properties to measure Image Quality (SSIM) were completed, it was noted that the value of the Mean Squared Error (MSE) was obtained by 0.0000 and Peak. Signal to Noise Ratio (PSNR) and SSIM value will be Infinity and 1.0000. Pretrained Neural Network based Image Denoising and Laplacian Rapid Screen Filter (FLLF) Type 7 were used in road sign board images. The results obtained after combining the techniques of Pretrained Neural Network based Image Denoising and Laplacian Rapid Filtering (FLLF) Type 7 of the traffic sign board images available on our test image site are shown below:

9. Concluding Remarks
In this research paper, comparisons of various image enhancements to local domain techniques were made to select the best method between different strategies based on calculating different parameters that determine the quality of road input features such as Mean Squared Error (MSE), Peak Signal to Noise. Rate (PSNR) and Image Quality (SSIM) and after a thorough comparison, concluded that if the techniques of Pretrained Neural Network based Image Denoising and Laplacian Faster Filter (FLLF) Type 7 exist. well integrated, with Peak Signal to Noise Ratio (PSNR) and similar Image Quality Assurance Form (SSIM) obtained as Infinity and 1.0000 respectively with a relatively small error rate. (MSE) value 0.0000 compared to other site image testing strategies. The combination of these two methods mentioned in the above section of our research paper will be used for the Enlargement of Input Photographs available for the Examination and Training of Photographic Boards for future research work.
Conflict of Interest
The author declares no conflict of interest.
- Huaping Liu, Yulong Liu, Fuchun Sun, “Traffic sign recognition using group sparse coding”, Elsevier- Information Sciences, Volume 266, January 2021, pp. 75-89.
- Zhan-Li Sun, Han Wang, Wai-Shing Lau, Gerald Seet, Danwei Wang, “Application of BW-ELM model on traffic signrecognition”, Elsevier- Neurocomputing, Volume 128, October 2021, pp. 153-159.
- Fatin Zaklouta, Bogdan Stanciulescu, “Real-time traffic sign recognition in three stages”, Elsevier- Robotics and Autonomous Systems, Volume 62, August 2021, pp. 16-24.
- Shuihua Wang, Hangrong Pan, Chenyang Zhang, Yingli Tian, “RGB-D image-based detection of stairs, pedestrian crosswalks and traffic Signs”, Elsevier- Journal of Visual Communication and Image Retrieval, Volume 25, November 2020, pp. 263-272.
- Jonathan J. Kay, Peter T. Savolainen, Timothy J. Gates, Tapan K. Datta, “Driver behaviour during bicycle passing manoeuvres in response to aShare the Road sign treatment”, Elsevier-Accident Analysis and Prevention, Volume 70, April 2021, pp. 92-99.
- Jesmin Khan, Sharif Bhuiyan, Reza Adhami, “Hierarchical clustering of EMD based interest points for road sign detection”, Elsevier- Optics & Laser Technology, Volume 57, October 2021, pp. 271-283.
- Zong-Yao Chen, Wei-Chao Lin, Shih-Wen Ke, Chih-Fong Tsai, “Evolutionary feature and instance selection for traffic sign recognition”, Elsevier- Computers in Industry, Volume 74, September 2020, pp. 201-211.
- Samuele Salti, Alioscia Petrelli, Federico Tombari, Nicola Fioraio, Luigi Di Stefano, “Traffic sign detection via interest region extraction”, Elsevier- Pattern Recognition, Volume 48, June 2020, pp. 1039-1049.
- M. Lillo-Castellano, I. Mora-Jiménez, C. Figuera-Pozuelo, J.L. Rojo-Álvarez, “Traffic sign segmentation and classification using statistical learning methods”, Elsevier- Neurocomputing, Volume 153, November 2021, pp. 286-299.
- Haojie Li, Fuming Sun, Lijuan Liu, Ling Wang, “A novel traffic sign detection method via colour segmentation and robust shape matching”, Elsevier- Neurocomputing, Volume 169, May 2021, pp. 77-88.
- Zhenyu An, Zhenwei Shi, Ying Wu, Changshui Zhang, “A novel unsupervised approach to discovering regions of interest in traffic images”, Elsevier- Pattern Recognition, Volume 48, February 2020, pp. 2581-2591.
- Yingying Zhu, Chengquan Zhang, Duoyou Zhou, Xinggang Wang, Xiang Bai, Wenyu Liu, “Traffic sign detection and recognition using fully convolutional Network guided proposals”, Elsevier- Neurocomputing, Volume 214, July 2021, pp. 758- 766.
- Ayoub Ellahyani, Mohamed El Ansari, Ilyas El Jaafari, “Traffic sign detection and recognition based on random forests”, Elsevier- Applied Soft Computing, Volume 46, February 2020, pp. 805-815.
- Selcan Kaplan Berkaya, Huseyin Gunduz, Ozgur Ozsen, Cuneyt Akinlar, Serkan Gunal, “On circular traffic sign detection and recognition”, Elsevier- Expert Systems with Applications, Volume 48, 2020, pp. 67-75.
- Yongtao Yu, Jonathan Li, Chenglu Wen, Haiyan Guan, HuanLuo, Cheng Wang, “Bag-of-visual-phrases and hierarchical deep models for traffic sign detection and recognition in mobile laser scanning data”, Elsevier- ISPRS Journal of Photogrammetry and Remote Sensing, Volume 113, January 2021, pp. 106-123.
- Hamed Habibi Aghdam, Elnaz Jahani Heravi, Domenec Puig, “A practical approach for detection and classification of traffic signs using Convolutional Neural Networks”, Elsevier- Robotics and Autonomous Systems, Volume 84, July 2020, pp. 97-112.
- Mario Soilán, Belen Riveiro, Joaquin Martinez-Sanchez, Pedro Arias, “Traffic sign detection in MLS acquired point clouds for geometric and image-based semantic inventory”, Elsevier- ISPRS Journal of Photogrammetry and Remote Sensing, Volume 114, February 2020, pp. 92-101.
- Ouerhani, A. Alfalou, M. Desthieux, C. Brosseau, “Advanced driver assistance system: Road sign identification using VIAPIX system and a correlation technique”, Elsevier- Optics and Lasers in Engineering, Volume 89, May 2021, pp. 184-194.
- Jack Greenhalgh and Majid Mirmehdi, “Recognizing Text-Based Traffic Signs”, IEEE Transactions on Intelligent Transportation Systems, Vol. 16, No. 3, June 2020, pp. 1360-1369.
- Nadra Ben Romdhane, Hazar Mliki, Mohamed Hammami, “An Improved Traffic Signs Recognition and Tracking Method for Driver Assistance System”, in the Proceedings of IEEE International Conference on Information Security (ICIS’2020), June 26- 29, 2020, Okayama, Japan.
- Ruben Laguna, Ruben Barrientos, L. Felipe Blazquez, Luis J. Miguel, “Traffic sign recognition application based on image processing techniques”, in the Proceedings of the Elsevier- Proceedings of the 19th World Congress, The International Federation of Automatic Control, Cape Town, South Africa. August 24-29, 2021, pp. 104-109.
- Baro, S. Escalera, J. Vitria, O. Pujol, P. Radeva, “Traffic sign recognition using evolutionary adaboost detection and forest- ecoc classification”, IEEE Transactions on Intelligent Transport Systems, Volume 10, Issue 1, 2020, pp. 113-126.
- M. Bascon, J.A. Rodriguez, S.L. Arroyo, A.F. Caballero, F. Lopez-Ferreras, “An optimization on pictogram identification for the road-sign recognition task using SVMs”, Computer Vision Image Understanding, Volume 114, Issue 3, 2021, pp. 373-383.
- C. Chang, Y.P. Hsieh, “A fast VQ codebook search with initialization and search order”, Information Sciences, Volume 183, Issue 1, 2021, pp. 132-139.
- Ciresan, U. Meier, J. Mascim, J. Schmidhuber, “A committee of neural networks for traffic signs classification”, in Proceedings of International Joint Conference on Neural Networks (IJCNN), July 2020, pp. 1918-1921.
- Escalera, O. Pujol, P. Radeva, “Traffic sign recognition system with b-correction”, Elsevier- Machine Vision Applications, Volume 21, Issue 2, 2020, pp. 99-111.
- Gomez-Moreno, S. Maldonado-Bascon, P. Gil-Jimenez, S. Lafuente-Arroyo, “Goal evaluation of segmentation algorithms for traffic sign recognition”, IEEE Transactions on Intelligent Transportation Systems, Volume 11, Issue 4, 2021, pp. 917-930.
- Gu, T. Yendo, M.P. Tehrani, T. Fujii, M. Tanimoto, “Traffic sign detection in dual-focal active camera system”, in the Proceedings of IEEE Intelligent Vehicles Symposium (IV), 2020, pp. 1054-1059.
- Gunal, R. Edizkan, “Subspace based feature selection for pattern recognition”, Elsevier-Information Sciences, Volume 178, 2021, pp. 3716-3726.
- Huang, K. Huang, Y. Yu, T. Tan, “Salient coding for image classification”, in the Proceedings of Computer Vision and Pattern Recognition (CVPR), 2021, pp. 1753-1760.
- K. Chung, ”A Phase Tracking System for Three Phase Utility Interface Inverters”, IEEE Trans. On Power Electronics, Vol. 15, pp. 431-438, May 2000.
- Hassanabad, A. H., & Nazeipur, D. Design and Simulation of a Control System for Investors in Wind Turbines. Vol. 6, No. 3, 2021, pp. 31-36.
- Jun-min, L. K. P. Z., & Yang, X. U. A. N. (2003). Harmonics detection for three-phase circuits based on resampling theory and mean filtering. Proceedings of the CSEE.