Text-Based Traffic Panels Detection using the Tiny YOLOv3 Algorithm

(This article belongs to the Special Issue on Special Issue on Multidisciplinary Sciences and Advanced Technology (SI-MSAT 2022) and the Section Interdisciplinary Applications – Computer Science (IAC))
Export Citations
Cite
Kheirinejad, S. , Riahi, N. and Azmi, R. (2022). Text-Based Traffic Panels Detection using the Tiny YOLOv3 Algorithm. Journal of Engineering Research and Sciences, 1(3), 68–80. https://doi.org/10.55708/js0103008
Saba Kheirinejad, Noushin Riahi and Reza Azmi. "Text-Based Traffic Panels Detection using the Tiny YOLOv3 Algorithm." Journal of Engineering Research and Sciences 1, no. 3 (March 2022): 68–80. https://doi.org/10.55708/js0103008
S. Kheirinejad, N. Riahi and R. Azmi, "Text-Based Traffic Panels Detection using the Tiny YOLOv3 Algorithm," Journal of Engineering Research and Sciences, vol. 1, no. 3, pp. 68–80, Mar. 2022, doi: 10.55708/js0103008.
Lately, traffic panel detection has been engrossed by academia and industry. This study proposes a new categorization method for traffic panels. The traffic panels are classified into three classes: symbol-based, text-based, and supplementary/additional traffic panels. Although few types of research have investigated text-based traffic panels, this type is considered in detail in this study. However, there are many challenges in this type of traffic panel, such as having different languages in different countries, their similarity with other text panels, and the lack of suitable quality datasets. The panels need to be detected first to obtain a reasonable accuracy in recognizing the text. Since there are few public text-based traffic panels datasets, this study gathered a novel dataset for the Persian text-based traffic panels all over the streets of Tehran-Iran. This dataset includes two collections of images. The first collection has 9294 images, and the latter has 3305 images. The latter dataset is more monotonous than the first one. Thus, the latter is utilized as the main dataset, and the first is used as an additional dataset. To this end, the algorithm uses the additional dataset for pre-training and the main datasets for training the network. The tiny YOLOv3 algorithm that is fast and has low complexity compared to the YOLOv3 is used for pre-training, training, and testing the data to examine the utility and advantages of the data. The K-fold cross-validation procedure is used to estimate the model's skill on the new data. It achieves 0.973 for Precision, 0.945 for Recall, and 0.955 for Fmeasure.
1. Introduction
Countries define rules to guarantee a secure traffic system. All traffic users such as drivers and pedestrians need to obey these rules. Traffic panels/signs play a crucial role in the system. Drivers observe the panels and act based on the information that the panels provide. The drivers intentionally or unintentionally ignore the traffic panels in different circumstances (once a vehicle has high speed or the driver is distracted by something), which can cause horrible accidents and misfortune. The definite dependence on the mentally and physically vulnerable human is hazardous. To this end, vehicles armed with progressive technologies play a significant role in the security of the traffic system and protecting many human lives. Detection of the traffic panels is considered a formidable technology in the intelligent transportation system. It has various uses including driver assistant systems, unmanned autonomous vehicles, and road panel keeping [1]. The traffic panels have been divided into two categories in the previous works: I) symbol-based and II) text-based traffic panel. This study classified the traffic panels into three classes: I) symbol-based, II) supplementary/additional, and III) text-based traffic panels.
1.1. Symbol-Based Traffic Panels
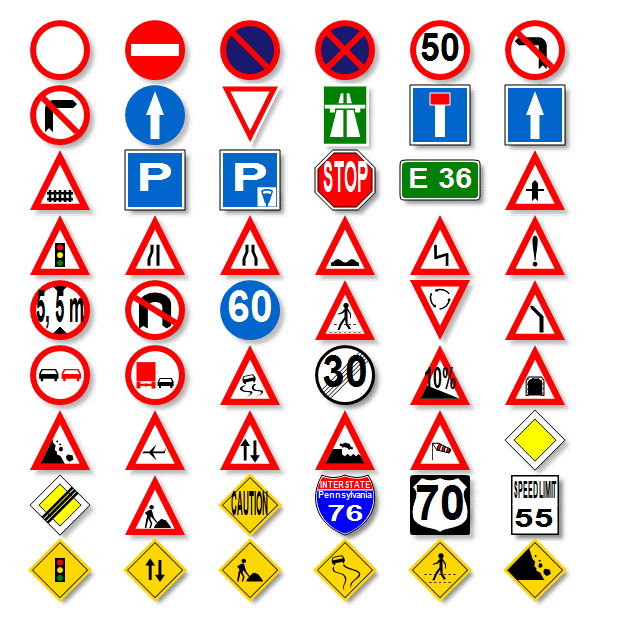
The first group utilizes specific and straightforward symbols to represent the concept of the panels. Symbol-based traffic panels are divided into several categories based on their form including rectangular, triangular, square, circular, pentagonal, and octagonal shapes, and their colors such as white, red, yellow, blue, and green. The shapes and colors with low variety determine the specific purpose of the panels, such as stop, pedestrian crossing, bicycle crossing, railway crossing, watching for children, speed limit, etc. The typical concepts of this type of traffic panel are danger, prohibition, commitment, warning, priority, end of prohibition, etc. Prohibition panels are in a circle form with a red margin, warning panels are triangular, and information panels are blue [1] . The symbol-based traffic panels have been standardized in most countries, they have the same shapes and meanings, and there are several suitable and standard datasets for them. Many studies have mainly considered this type of panel [2]-[23]. Instances of symbol-based traffic panels can be seen in Figure 1.
1.2. Supplementary/Additional Traffic Panels
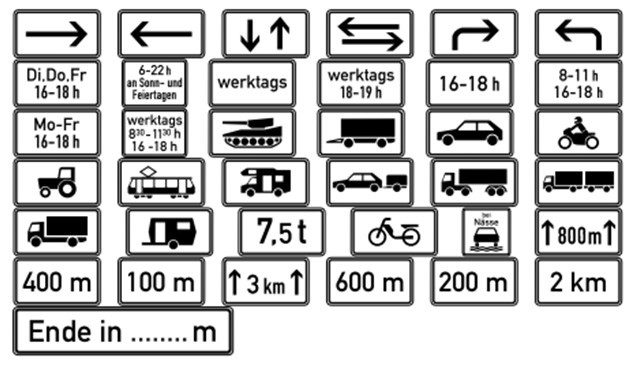
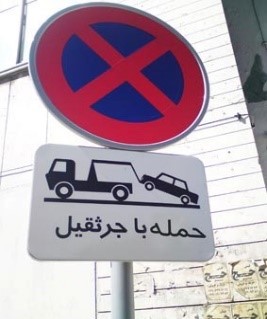
The traffic panels in this group complete the concept of symbol-based traffic panels. They contain ‘text,’ ‘arrow,’ ‘pictograph,’ and ‘a combination of the text and pictograph’ [24]-[30]. The shape of these panels is generally rectangular, their color is white, and they are found under the symbol-based traffic panels. There is a considerable variation of this type in Germany. However, there are a few numbers of this type in Iran. Since the number of traffic panels in this group is less than the number of traffic panels in two other groups, this group has attracted less attention. Instances of supplementary/additional traffic panels in Germany can be observed in Figure 2 and one instance in Iran can be observed respectively in Figure 3.
1.3. Text-Based Traffic Panels
Text-based traffic panels include text and arrows. The texts deliver rich and valuable semantic information about the traffic system and have a fundamental function in the traffic system and intelligent transportation system. They illustrate the correct routes, warnings about possible dangers, and permission or prohibition of access to the road, etc. The automatic detection of these panels can alert the driver about the traffic and environment. Some systems can read the text using a synthesized voice or combine it with navigation systems like GPS. They play the assistant role and aim to increase the drivers’ attention to have a safe traffic environment. Fewer studies have been done in this category than symbol-based category [31]-[44]. The reason is a multitude of challenges which are presented in the following [1].
- There are not enough and suitable public datasets.
- The texts are written in different languages in different countries.
- Sometimes, the panels are not evident in various weather situations such as snowy, rainy, sunny, foggy, cloudy, etc.
- There are different text-based boards in the street that look like the text-based traffic panels such as billboards, store name boards, and advertisements on the vehicles.
- The color of the panels and texts fade due to the sunshine for a long time and reaction between the air and color.
- Some panels have been physically damaged.
- Some panels have been obstructed by the trees, vehicles, and other objects.
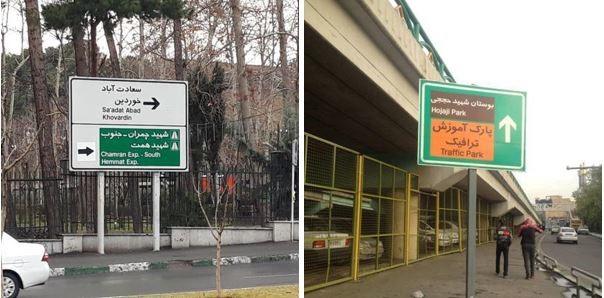
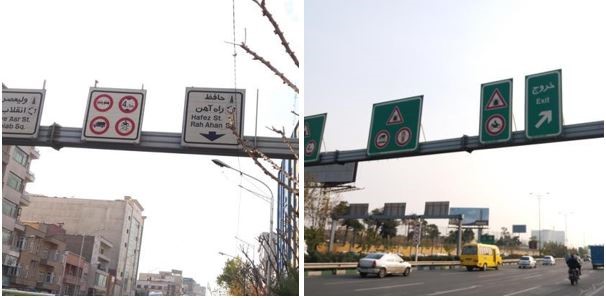
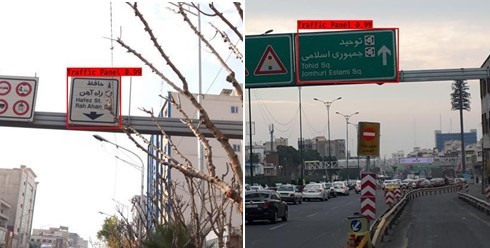
As far as we know, few benchmark datasets for text-based traffic panel detection are publicly available [45, 40]. Hence, this study gathered a novel public dataset all over the city of Tehran-Iran and called it ‘Persian Text-Based Traffic Panel Dataset’ [46]. As well as the general challenges mentioned above, there are other exclusive challenges for the Persian dataset: I) As shown in Figure 4, some traffic panels are not uniform from the perspective of color. In other words, they are a combination of multiple colors. II) There are a few greens and white rectangular panels that only includes the symbols, and there is no text inside them, as shown in Figure 5. Since these panels look like text-based traffic panels, the network might make a mistake in detecting them. III) Persian text-based traffic panels include two languages, Persian and English. Therefore, the size of the texts is small, and the characters are unreadable from a relatively long distance.
1.4. Contribution
The contributions of this study are outlined as follows. This paper provides short and valuable literature on different types of traffic panels. Different traffic panels are categorized into a novel and comprehensive manner. The newest related works for detecting traffic panels in traditional and non-traditional methods are presented for each category. This study introduces a new dataset and elaborates on data collection and traffic panel detection techniques and challenges in detail. This work explains the way of evaluation using a state-of-the-art algorithm, the Tiny YOLOv3, to analyze the efficiency and benefits of the data. In the evaluation and results section, the algorithm’s performance for the dataset has been extensively discussed. The results show that the algorithm provides 0.973 for Precision, 0.945 for Recall, and 0.955 for Fmeasure.
1.5. Organization
The study is structured as follows. Recent works in different types of traffic panels are reviewed in section 2. The used algorithm is explained in section 3. The steps of the data collection and labeling are described in section 4. The evaluation and results are discussed in section 5. The discussion is presented in section 6. Ultimately, the conclusion and perspectives about the future studies are proposed in section 7.
2. Related Work
This section discusses related works in different categories of traffic panels.
2.1. Symbol-Based Traffic Panel Detection
Detection methods for symbol-based traffic panels are generally divided into three sorts: I) colour-based methods, II) shape-based methods, and II) deep learning methods.
2.1.1. Color-Based Methods
The color-based methods usually use normalized color space such as RGB (Red, Green, Blue), YUV, and HSI (hue, saturation, and intensity), with specific thresholding. Segmentation means separating the traffic panels from the road background. Due to the damage to the color and shape of the traffic panels, it is not easy to distinguish its position from other outdoor images. Most segmentation techniques use color. Since the traffic panels are divided based on the color information from the background, it depends on the threshold of the input image in various color spaces. First, the segmentation is done using a different color range. Shape detection is done in the next step. Many researchers in this field face issues for white color and uneven lighting level [1]. In [47] red and green components’ average is calculated for each pixel, and the G-R histogram is developed by displaying G-R’s value. Many researchers use HSI color space because it understands the human understanding of RGB space well. While some researchers have found better results in the color space of YCbCr and YUV [48].
2.1.2. Shape-Based Methods
The particular shapes of traffic panels such as circles, triangles, and squares make them significant for distinguishing from other panels. For the shape-based methods, Hough transformation and different types of Hough transformation are used. Like detection of the general objects, a sliding window using categorization of the region is used to investigate the presence of traffic panels in the current window. Shape detection is an essential component of information in the recognition process of the traffic panels. Techniques such as connected components, dividing and merging edge detection, and clustering are utilized to compound pixels using color information-based similarity measurements to model the features at the detection stage. Attributes like aspect ratio, width, height, perimeter, and area of border-box, are extracted experimentally to obtain candidate bubbles. The resulting bubble is confirmed at this stage. There are several features that are extractable from the bubble that can be used in the classification of the shapes better [49]. Therefore, for each segmented bubble, right, left, bottom, and top DtB vectors are produced. In [50], utilized only right and left DtB vectors to detect the shape. The task in [51] is given by the union of distance vectors from the bubble’s center to the bubble’s outer edge, i.e., distance vector from the center of union. These feature vectors are utilized in the categorization of the shapes using a linear support vector machine. In [52] an alternative method uses the signature form of the connected components, which is computed directly through the bubble. Referring to the angle, the signature is defined the distance from the center to the object border. The absolute value of the fast Fourier transform is used for each shape signature to counteract the direction of the panel. The absolute value of discrete Fourier transform can be a good choice as well, but is not preferred due to computational complexity [53] .In [54], the Histogram of oriented gradients algorithm is developed using integrating the color information into the feature vector to improve performance. Since the road panels have high color contrast, some studies consider the pixels as features for shape definition [3].
2.1.3. Deep Learning Methods
Late advancements in deep learning techniques have inspired researchers to exploit neural networks to detect and recognize traffic panels. Contrary to the comparative achievement of detectors with hand-crafted features, most non-deep learning-based systems are not suitable to correctly detect a vast number of traffic panels [15]. Others converted the basic image into the grayscale image using support vector machines (SVM). They exploited convolutional neural networks (CNN) with fixed and learnable layers to detect the traffic panels [55]. In utilized CNN and twin SVM hybrid model in a new study [18]. In [56], a traffic panel detection and recognition algorithm were presented using CNN. Target of the system included traffic panels, Chinese characters, English letters, and digits. The system uses a multi-task CNN as its base trained to obtain valuable features for classifying and localization of different traffic panels and texts. Authors in a newer study proposed a CNN consists of a CNN-based challenge classifier [20]. In [57] for extracting the Region of Interest (RoI), the AdaBoost classifier and local binary pattern feature detector are combined. Cascaded CNNs are used to decrease negative samples of RoI for traffic panel recognition. It is also used cascade saccade machine learning network with hierarchical classes for traffic panel detection [22]. In [58] it is presented a novel real-time method based on cascade deep learning and AR for a fast and precise framework for traffic panel recognition. It superimposes augmented virtual objects onto a real scene under all kinds of driving conditions, such as adverse weather circumstances. They merged the segmentation architectures Seg-Net and U-Net for detecting the traffic panels from video sequences [11]. Different Studies used CNN and mask R-CNN to detect the symbol-based traffic panel [12, 14]. Various studies used different versions of You Only Look Once (YOLO) algorithm, YOLOv3, YOLOv4, and YOLOv5 to recognize the traffic panels [16, 17, 23]. They presented a new traffic panel recognition method via incorporating a lightweight superclass detector with a refinement classifier [59]. It is presented a new dataset in Pakistan and used transfer learning to recognize the traffic panels [21].
2.2. Additional/Supplementary Traffic Panel Detection
Since the supplementary or additional panels often appear below the symbol-based traffic panels, in most detection methods, first symbol-based panels are identified, then the interested region located below the symbol-based panels are specified, at last, the additional traffic panels in the RoI are searched. To this end, it is presented an algorithm to detect additional panels besides the other panels. This method exploits Hough transform for lines and geometric constraints to find additional panels. Then uses SVM classification to verify the candidate shape [24]. They used MLP neural network to detect the rectangular shape in a region below speed-limit panels [30]. Th authors presented a method to determine the shapes with ‘arrow,’ ‘pictogram,’ ‘text or mixed.’ Afterward, they classified the shapes with pyramid-HOG features [25]. The author utilized a Maximally Stable Extremal Regions (MSER) based approach to detect the additional panels [26]. In their next study, they found corner areas via aggregated channel features. Then, quadrangle generation and filtering technique were used to filter the variation of large aspect ratio for supplementary panels [28]. They introduced a complete pipeline to recognize the text by optical character recognition (OCR) in their earlier work. They assumed a specific additional panel, classified its layout, determined the bounding boxes of the content using regression, then used a multi-class classification step or applied a text sequence classifier if necessary [27]. It is proposed CNNs to classify the road condition and recognize additional panels that display the validation of ‘when wet’ additional panels [29].
2.3. Text-Based Traffic Panel Detection
Few studies have been done on text-based traffic panel detection compared to symbol-based traffic panels. This study categorized methods of text-based traffic panel detection into two categories, I) the methods that extract the features in a traditional way, and II) the methods that extract the features using deep learning algorithms.
2.3.1. The Methods That Extract the Features in a Traditional Way
In [35], the author used the traffic panels properties such as geometric constraints and color distribution to distinguish the traffic panels from the other objects. At last, they used the vertical plane criterion for traffic panel detection. In [60] considered the traffic panels in Spain. They exploited the information of HSI color space and computation of the shape classification techniques for thresholding. They detected the blue pixels by applying an appropriate threshold and used achromatic decomposition to detect the white pixels. They labeled the connected components and considered all the blob candidates in a selection process and removed some of them based on their aspect ratio and size. Xavier et al. [32] found edges of the input image using a canny edge detector. They used Hough transform to find the straight lines of the detected edges. Then, they determined the candidate regions (top, right, and left of the road) that contain the traffic panels. They utilized HSV thresholding to detect the text-based traffic panels in the candidate regions. Finally, they vertically aligned the detected panels using the random sample consensus (RANSAC) algorithm and homography techniques. In [36], the images have been taken from Google Street View Service that provides 360° panoramic views with high resolution from different locations on various streets and roads worldwide. The authors used the text localization algorithm and detected the panel characters using MSER. They used MSER to determine traffic panels as rectangles with high text density. As plenty of traffic panels that have been studied in this paper have a blue background, a blue segmentation method was applied to detect the extensive rectangular regions. In [37], specified the RoI of the text-based traffic panels by defining the vanishing point and sides of the road. Text-based traffic panels candidates were detected exploiting thresholding techniques in RoI by MSER and HSV. The number of candidates was decreased via temporal and contextual information at the end. In [38], detected the text-based traffic panels by Bag of Visual Words (BoVW) and color segmentation techniques. They applied the BoVW method on the specific parts of the images identified by the blue and white masking. Khodayari et al. [61] processed the input images in HSV space. Then, they detected the traffic panels using the fuzzy logic method. In the fuzzy images, the properties of each pixel, such as brightness and color are presented using linguistic values. Yellow, green, light green, white, dark red, and dark blue are examples of the linguistic values assigned to each pixel. In [45], presented a dataset including videos of traffic panels recorded by a moving vehicle in municipal regions. They categorized the video sequences based on their features in a way that researchers could select the piece of data that helps their research purpose.
2.3.2. The Methods That Extract the Features Using Deep Learning Algorithms
In [31], the author proposed a new Cascaded Localization Network. They detected the candidate traffic panels in each frame on a set of continuous image frames using a set of features learned by CNN. They also collected a novel dataset for the traffic guide panel to train and appraise the framework. In [62], the author collected a text-based traffic panels dataset containing English and Chinese traffic panels. They exploited a fully convolutional network to segment the candidate traffic panels. In [42], the author proposed a new system for recognizing both symbol-based and text-based traffic panels. They applied MSER on grey and normalized RGB channels to extract the RoIs from each video frame. They trained a multi-task CNN with images labeled from street views and synthetic traffic panels and used it to recognize the panels. In [33], it is used a region proposal network to detect Korean character candidates. Then, they classified Korean characters by a classification network. In [34], the author applied MSER and OCR on given text-based traffic panels to recognize the texts. Peng et al. [43] presented a deep learning-based cascade detection model with two stages to detect the traffic panel text in natural scenes. They found the panels’ RoIs using an improved Single Shot Multi-Box Detector (SSD) network. Zhang et al. [44] solved the false detection and undetected by proposing a cascaded R-CNN to reach the multi-scale features in pyramids. All layers of the cascaded network combine the output bounding box of the previous layer for joint training; other than the first layer, this technique chips for traffic panels detection. They also presented a multi-scale attention technique to get the weighted multi-scale features using softmax and dot-product, highlighting the traffic panel features and improving the detection accuracy by fining the features. In [63], the author proposed a new detection method called MSA_YOLOv3 to detect the small traffic panels precisely. They achieved data augmentation by exploiting image mix-up technology. They introduced a multi-scale spatial pyramid pooling block into the Darknet53 network to help the network learn object features more generally. In [39], it is proposed an algorithm to detect the mixed horizontal-and-vertical-text traffic panel with the Chinese language in the street. To differentiate the traffic panels from other similar things in color in the complicated background like street scenes, the different red, green, and blue features were effectively mixed. Since the Chinese text lines are usually vertical and horizontal on text-based traffic panels, the presented technique created the text lines by the structural information and position of the characters. In [40], the author presented a novel public multi-task dataset for detecting text-based traffic panels. In [41], it is presented an end-to-end trainable deep neural network that can recognize multi-oriented text instances in adverse meteorological conditions.
3. The Tiny YOLOv3 Algorithm
Since the computer’s hardware is continuously growing, CNN-based deep learning methods have advanced fast and acquired remarkable results in computer vision and machine vision scope [64]. Traffic panel detection is considered a subset of the more general scope of object detection. Object detection is a relatively old subject. However, it is still a complex issue and an active scope for many researchers despite the endeavors that have been accomplished. Various object detection algorithms have been suggested so far. Currently, the most famous algorithms are SSD [65], R-CNN [66], and YOLO. YOLO is an algorithm that has become widespread for object detection recently. They have proposed its three versions (1-3) [67, 68, 69]. The fourth and fifth versions have been presented by [70] a [71], respectively. This algorithm solves object detection as a regression problem. It classifies the objects and gives their location as an output using an end-to-end network in one step. The noteworthy thing about this algorithm is its speed. It is one of the fastest algorithms so far. YOLOv3 uses the K-means clustering algorithm to automatically choose the most suitable anchors for the dataset. This algorithm is very complicated and demands complex hardware. It has 256 layers, and 53 layers out of 256 are convolution layers, as it utilizes the Darknet-53 as the backbone network. The tiny YOLOv3 is a smaller and faster version of the YOLOv3 algorithm. It has an architecture with low complexity and a more straightforward implementation for datasets with small sizes. This algorithm is used for pre-training, training, and testing the dataset. The tiny YOLOv3 algorithm used in this study has 46 total layers, including 13 Convolution, 11 Leaky Relu, 11 Batch Normalization, 6 Max Pooling, 3 Input, 1 Concatenate, and 1 Upsampling layer. In Table 1, the features of the tiny YOLOv3 architecture are summarized.
Table 1: Features of the tiny YOLOv3 architecture.
Name of layers | Number of layers |
Convolution | 13 |
Batch Normalization | 11 |
Leaky Relu | 11 |
Max Pooling | 6 |
Input | 3 |
Upsampling | 1 |
Concatenate | 1 |
4. Dataset Collection
Before getting into the details of collecting the dataset, the characteristics of the Persian text-based traffic panels in Iran are explained. These traffic panels express a particular meaning according to their shape and color. The concepts of the colors for this type of traffic panel are as follows:
- Green: Route guide for highways and religious places
- Blue: Route guide for freeways and service guide
- Black and white: Route guide for the other ways
- Yellow: General warnings and warnings for construction or repair operations
- Orange: Guide for administrative, training, and service areas
- Brown: Guide for recreational, cultural, and tourism areas
The concept of the shapes in the text-based traffic panels are as follows:
- Horizontal rectangle: Warning for repairing and maintenance
- Vertical rectangle: Guide for imperative and service panels
- Flag rectangle: Guide for routes
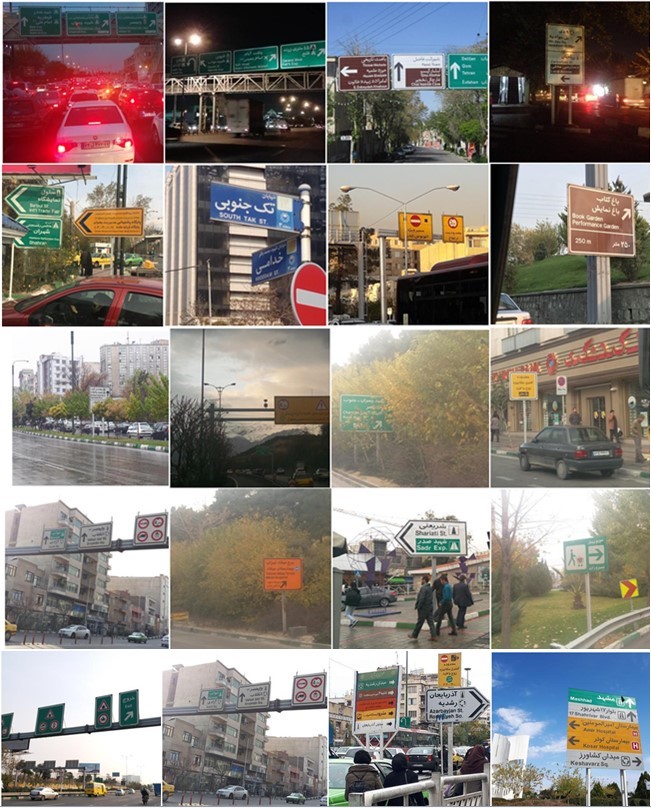
Since few public datasets focus on text-based traffic panels, this study collected a novel challenging dataset containing traffic panels with the Persian and English text called ‘Persian Text-Based Traffic Panels.’ In this dataset, the images have been taken using diverse smartphone cameras with various specifications by crowdsourcing method. Most images have been taken all over the city of Tehran in Iran, more on highways and streets. Two collections of images were collected. First, 4000 images were collected in different situations. Instances of these images can be witnessed in Figure 6. The images were augmented to 9294, followed by labeling. The tiny YOLOv3 algorithm was used for training and testing to examine the utility and advantages of the data. Nevertheless, this dataset did not attain suitable performance despite the positive expectation. The reason might be numerous text-based traffic panels in different situations compared to the total number of images (9294). In other words, there were many challenges in that dataset. It was compared to the dataset (an available part of the dataset) that has been used in [31]. Since most investigated text-based traffic panels are green and somewhat look like each other, this dataset is nearly monotonous and does not have many challenges. Hence, training and testing a model with this dataset is more straightforward than our dataset, gaining more accurate results. Thus, 1500 new images were taken as the main dataset. These images were more uniform than the images in the additional dataset. The images were augmented to 3305 and were labeled. This dataset was called the ‘main dataset’ and was utilized for training the algorithm. It is worth noting that the previous dataset was used to pre-train the algorithm and was called ‘additional dataset.’ Next, the dataset collection steps are explained in the following. Before getting into the details, methods of taking the images are explained. The images were taken in different situations such as:
- Some images have been taken in a static condition.
- Some images have been taken in a moving car, and they might have been zoomed (in case of being far from the traffic panel).
- The images have been taken at various distances.
- The images have been taken in different climates (e.g., sunny, cloudy, and rainy).
- The images have been taken at different times of the day with different light conditions (e.g., morning, noon, evening, and night).
- Some images have been taken from the traffic panels that have been physically damaged.
- Most of the images have been taken in the city with complex background.
- When lights of the cars and lamps in the middle of the highway and street illuminate the traffic panels).
- Some images have been taken from the traffic panels blocked by the trees, billboards, etc.
- Some images have been taken when the camera is behind the glass of the car.
4.1. Additional Dataset Collection
This dataset contains 4000 images with 12 Gigabyte sizes. Since different persons and cameras have taken the images, they are in both vertical and horizontal shapes, and their sizes are different. In other words, the images are not uniform. The images needed to be preprocessed to get uniform for use in the network. The desired size of the input images for the network is 416*416. If the images were directly resized to 416*416, the objects within the image would lose their original form. To this end, the cropping technique was used, and the images were converted to square form with the same length and width. Then, a bicubic interpolation method was applied to make the images monotonous.
The cropping strategy has a pair of advantages: I) data augmentation and II) making the images uniform. To augment the data, the images were cropped three times, from the left side, right side, and both sides. Using this technique, the total number of images increases, and no pixels are discarded from the original images, i.e., all the pixels were optimally used. After cropping each image, three images are produced from one original image. However, in some images, cropping causes the exit of some traffic panels from the cropped images. Thus, the images with no traffic panels need to be removed, which made the number of the final images not precisely three times the number of the original images. Therefore, the total number of augmented images is 9294. Finally, a bicubic interpolation technique was applied to derive a uniform dataset with 416*416 size.
4.2. Main Dataset Collection
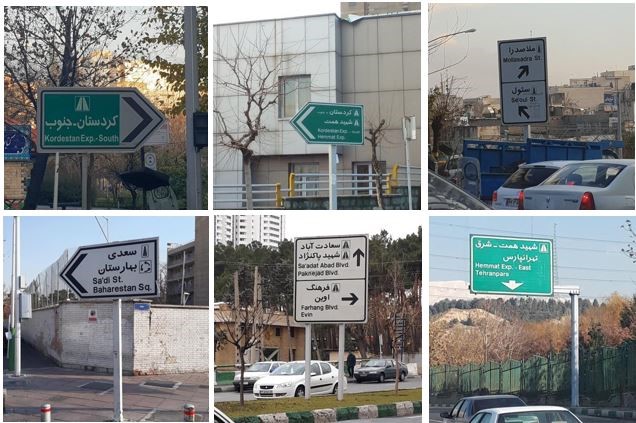
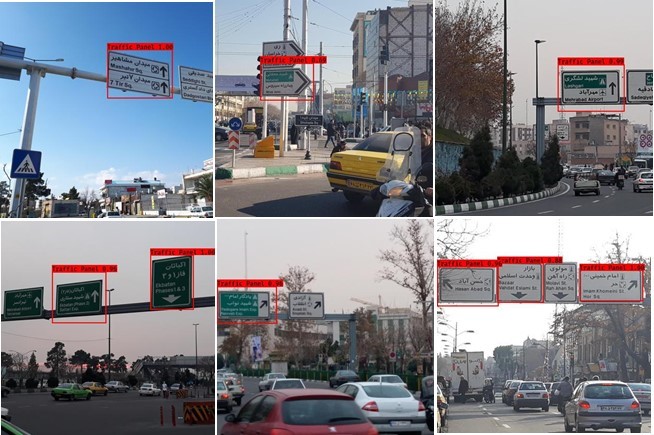
Due to the additional dataset challenges, a new and more uniform dataset was collected. 1500 images were collected and augmented to 3305 using the exact technique utilized for the additional dataset. Instances from the main dataset can be observed in Figure 7. In the new dataset, the panels showing the name of the alleys and streets were ignored. Because they are smaller than the usual traffic panels, and their texts are unclear. The green and white text-based traffic panels were used more. The images that a big part of them have been blocked with the trees, cars, and the other objects were not also used.
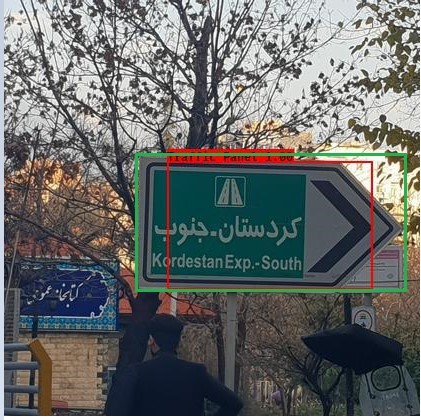
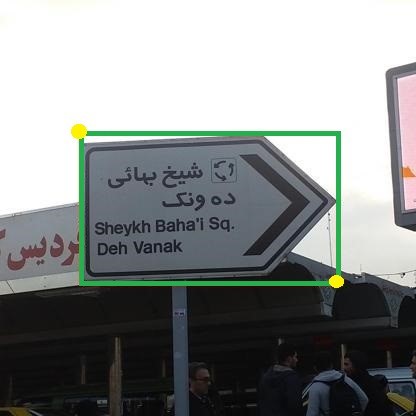
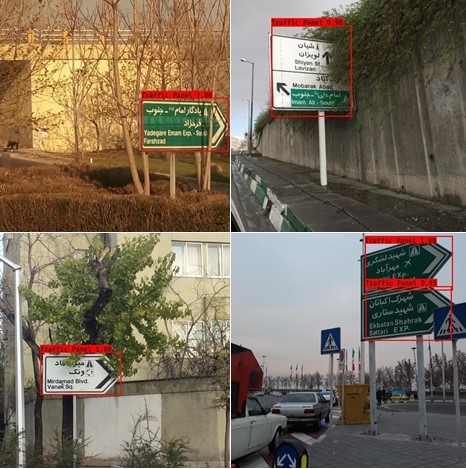
After data collection and applying the preprocessing steps, the images were labeled. Before explaining the labeling process, the predicted bounding box and ground-truth concepts need to be defined. The predicted bounding box is the bounding box predicted by the network. The ground-truth bounding box is the exact location of the defined traffic panel in the images. As shown in Figure 8 the predicted bounding box and ground-truth bounding box have been depicted in red and green. The predicted bounding boxes that overlap more with the ground-truth bounding boxes are more precious. Ground-truth bounding boxes are usually determined in two forms: I) the coordinates of the two corner points connected by diameter, and II) the coordinates of one corner and the length and width of the bounding box. This study uses the first one. The authors developed a code, after running the code, the dataset’s images are displayed one by one. As it can be seen in Figure 9, the user needs to click twice (one clicks for left up corner and another one for right down corner) for each panel, in such a way that the bounding box covers the whole panel.
5. Evaluation and Result
Some important parameters for implementing the algorithm are summarized in Table 2. First, the network uses the additional dataset for training and the COCO dataset’s weights as the pre-train weights. Then, it uses the main dataset for training and the obtained weights from the previews network as the pre-train weights. The number of the training dataset is 80 percent of the whole dataset’s images, the validation set is 10 percent of the images number in the training dataset, and the number of the test set is 20 percent of the whole images. The exact number of the main and additional datasets are explained in Table 3.
To evaluate the algorithm’s accuracy, the first step is to calculate the Intersection over Union (IoU) for all the bounding boxes. The IoU of each box is computed by dividing the area of the intersection between ground-truth and predicted bounding box over the area of the union between ground-truth and predicted bounding box. This study considers the IoU threshold 0.5. The Precision, Recall, and Fmeasure determining the accuracy of the algorithm are described in the following.
True Positive: TP
False Positive: FP
False Negative: FN
$$\text{Precision} = \frac{TP}{TP + FP}
\tag{1}$$
$$\text{Recall} = \frac{TP}{TP + FN}
\tag{2}$$
$$F_{\text{measure}} = 2 \cdot \frac{\text{Precision} \cdot \text{Recall}}{\text{Precision} + \text{Recall}}
\tag{3}$$
This study uses K-Fold cross-validation technique with K=5 to evaluate the algorithm’s performance. The results are illustrated in Table 4. The evaluation outcomes of Fold1 for various thresholds of IoU are depicted in Table 5. As shown, once the IoU threshold boost, Precision, Recall, and Fmeasure drop. The comparison of this method with other methods for text-based traffic panel detection can be observed in Table 6.
Table 2: Parameters’ value of the network.
Input image size | 416 * 416 |
Anchor number | 6 |
Class number | 1, traffic panel class |
Optimized function | Adam |
Learning rate | 0.001 |
Batch size | 8 |
Epoch | 100 |
Patience | 5 |
Graph card | NVIDIA GeForce GTX1070 |
Table 3: Characteristics of the additional and main dataset.
Number of images in | Additional dataset | Main dataset |
Total collection | 4000 | 1500 |
Total collection after data augmentation | 9294 | 3305 |
Train collection | 7435 | 2644 |
Validation collection | 743 | 264 |
Test collection | 1859 | 661 |
Table 4: Precision, Recall, and Fmeasure for each five folds in cross validation.
Test subset | Image number | Traffic panels number | True Positive number | False Positive number | False Negative number | Precision | Recall | Fmeasure |
Fold1 | 661 | 871 | 823 | 24 | 48 | 0.971 | 0.944 | 0.957 |
Fold2 | 661 | 880 | 829 | 27 | 51 | 0.968 | 0.942 | 0.954 |
Fold3 | 661 | 865 | 819 | 19 | 46 | 0.977 | 0.946 | 0.960 |
Fold4 | 661 | 850 | 807 | 17 | 43 | 0.979 | 0.949 | 0.963 |
Fold5 | 661 | 875 | 827 | 25 | 48 | 0.970 | 0.945 | 0.944 |
Average | 0.973 | 0.945 | 0.955 |
Table 5: Precision, Recall, and Fmeasure for various IoU in Fold1.
IoU | Precision | Recall | Fmeasure |
>0.5 | 0.971 | 0.944 | 0.957 |
>0.6 | 0.955 | 0.940 | 0.950 |
>0.7 | 0.818 | 0.935 | 0.873 |
>0.8 | 0.509 | 0.900 | 0.650 |
Table 6: Comparison of different methods for text-based traffic panel detection.
Study | Precision | Recall | Fmeasure |
Rong et al. [31] | 0.73 | 0.64 | 0.68 |
Greenhalgh et al. [37] | 0.96 | 0.90 | 0.93 |
Zhu et al. [62] | 0.93 | 0.94 | 0.93 |
Peng et al. [43] | 0.93 | 0.91 | 0.92 |
This study | 0.97 | 0.94 | 0.95 |
6. Discussion
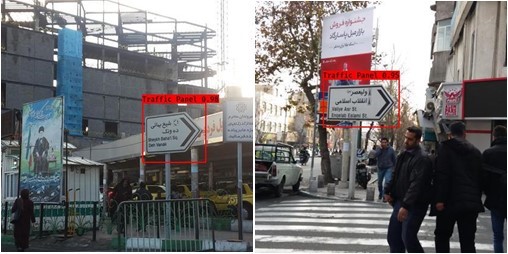
Good accuracy in the high IoU thresholds is crucial as the detected text-based traffic panels may not contain the full text. The used algorithm in this study has some flaws mentioned in the following. As shown in Figure 10, the predicted bounding boxes do not contain the full text though IoU is higher than 0.5. Since the next step after the text-based traffic panel detection is the recognition of the texts, the predicted bounding boxes need to contain the entire text to deliver the concept. As shown in Figure 11.
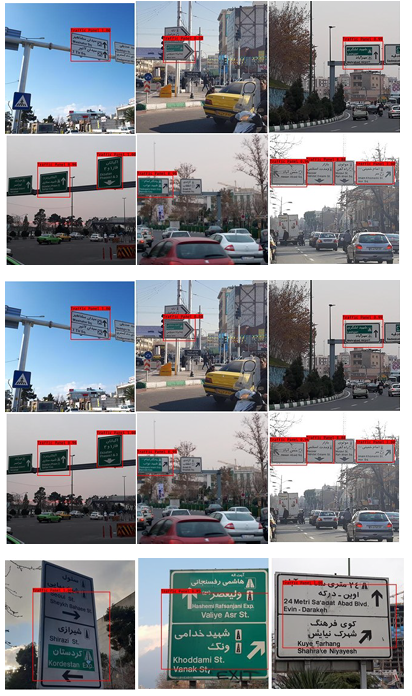
Figure 10: Predicted bounding boxes that do not include the full text.
Despite the clarity of some panels in specific sizes, the network cannot detect them. The reason is anchors’ size chosen by the algorithm at the beginning. As depicted in Figure 12, the panels that were wrongly detected as the traffic panels look like some text-based traffic panels in size and background. Although the Tiny YOLOv3 has a few flaws, it is a robust algorithm and can detect traffic panels in many challenging situations. It does not wrongly detect the panels that contain several symbol-based panels (indeed, they are considered symbol-based traffic panels) and look like the text-based traffic panels, as shown in Figure 13.
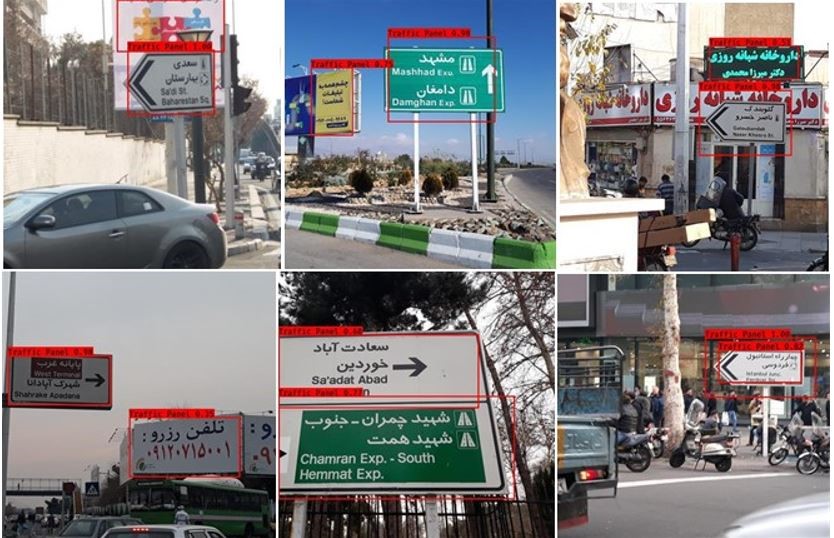
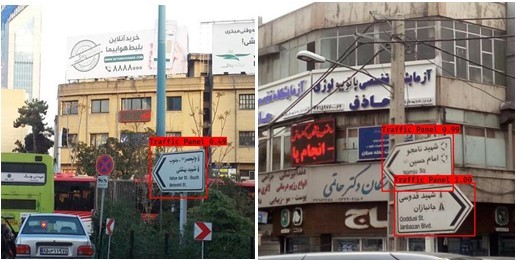
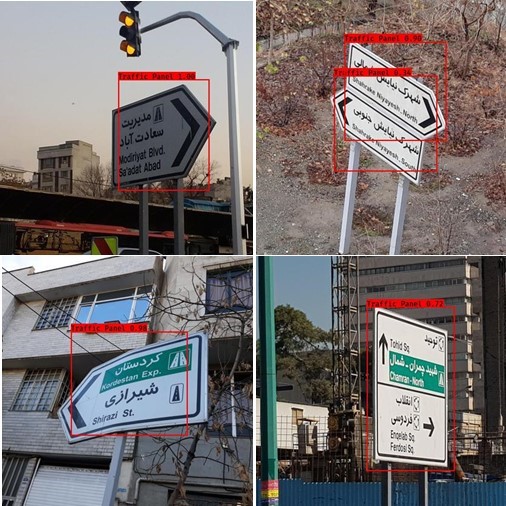
As depicted in Figure 14, other than a few cases mentioned as the algorithm’s flaws, it does not incorrectly detect the other similar objects to the text-based traffic panels such as the advertisements and billboards on the sides of the roads and vehicles, store name board, etc. It can accurately detect the text-based traffic panels in the complicated backgrounds as shown in Figure 15. It can correctly detect the lopsided text-based traffic panels, as shown in Figure 16. As shown in Figure 17, it can detect the text-based traffic panels partially blocked by objects, including vehicles, other panels, trees, etc.
The tiny YOLOv3 algorithm was exploited for pre-training, training, and testing the data to examine the utility and advantages of the data. The K-fold cross-validation procedure was used to estimate the model’s skill on the new data. It achieves 0.973 for Precision, 0.945 for Recall, and 0.955 for Fmeasure. Since the next step of text-based traffic panel detection is recognizing the text on the traffic panel, the authors plan to enhance text-based traffic panel detection accuracy for IoU thresholds greater than 0.5 to focus on recognizing the texts in the dataset as the future study.
- A. Gudigar, S. Chokkadi and U. Raghavendra, “A review on automatic detection and recognition of traffic sign,” Multimedia Tools and Applications, vol. 75, no. 1, pp. 333 -364, 2016.
- J. Stallkamp, M. Schlipsing, J. Salmen and C. Igel, “The German Traffic Sign Recognition Benchmark: A multi-class classification competition,” in International joint conference on neural networks (IJCNN), 2016.
- F. Zaklouta and B. Stanciulescu, “Real-time traffic sign recognition in three stages,” Robotics and autonomous systems, vol. 62, no. 1, pp. 16-24, 2014.
- J. Greenhalgh and M. Mirmehdi, “Real-Time Detection and Recognition of Road Traffic Signs,” IEEE Transactions on Intelligent Transportation Systems, vol. 13, no. 4, pp. 1498 — 1506, 2012.
- S. Houben, J. Stallkamp, J. Salmen, M. Schlipsing and C. Igel, “Detection of traffic signs in real-world images: The German Traffic Sign Detection Benchmark,” The 2013 international joint conference on neural networks (IJCNN), pp. 1-8, 2013.
- R. Timofte, K. Zimmermann and L. Van Gool, “Multi-view traffic sign detection, recognition, and 3D localisation,” Machine vision and applications, vol. 25, no. 3, pp. 633 – 647, 2014.
- Y. Yang, H. Luo, H. Xu and F. Wu, “Towards Real-Time Traffic Sign Detection and Classification,” IEEE Transactions on Intelligent Transportation Systems, vol. 17, no. 7, pp. 2022 – 2031, 2016.
- Z. Zhu, D. Liang, S. Zhang, X. Huang, B. Li and S. Hu, “Traffic-Sign Detection and Classification in the Wild,” in Conference on Computer Vision and Pattern Recognition (CVPR), 2016.
- E. Ayoub, M. El Ansari and I. El Jaafari, “Traffic sign detection and recognition based on random forests,” Applied Soft Computing, vol. 46, pp. 805 — 815, 2016.
- Y. Yuan, Z. Xiong and Q. Wang, “An Incremental Framework for Video-Based Traffic Sign Detection, Tracking, and Recognition,” IEEE Transactions on Intelligent Transportation Systems, vol. 18, no. 7, pp. 1918 – 1929, 2017.
- U. Kamal, T. Islam Tonmoy, S. Das and M. K. Hasan, “Automatic Traffic Sign Detection and Recognition Using SegU-Net and a Modified Tversky Loss Function With L1-Constraint,” IEEE Transactions on Intelligent Transportation Systems, vol. 21, no. 4, pp. 1467 – 1479, 2020.
- C. Gamez Serna and Y. Ruichek, “Traffic Signs Detection and Classification for European Urban Environments,” IEEE Transactions on Intelligent Transportation Systems, vol. 21, no. 10, pp. 4388-4399, 2020.
- L. Wei, C. Xu, S. Li and X. Tu, “Traffic Sign Detection and Recognition Using Novel Center-Point Estimation and Local Features,” IEEE Access, vol. 8, pp. 83611-83621, 2020.
- D. Tabernik and D. Skoˇcaj, “Deep Learning for Large-Scale Traffic-Sign Detection and Recognition,” IEEE Transactions on Intelligent Transportation Systems , vol. 21, no. 4, pp. 1427 – 1440, 2020.
- F. Almutairy, T. Alshaabi, J. Nelson and S. Wshah, “ARTS: Automotive Repository of Traffic Signs for the United States,” IEEE Transactions on Intelligent Transportation Systems, vol. 22, no. 1, pp. 457 – 465, 2021.
- C. Dewi, R.-C. Chen, Y.-T. Liu, X. Jiang and K. D. Hartomo, “Yolo V4 for Advanced Traffic Sign Recognition With Synthetic Training Data Generated by Various GAN,” IEEE Access, vol. 9, pp. 97228-97242, 2021.
- X. Liu, X. Jiang, H. Hu, R. Ding, H. Li and C. Da, “Traffic Sign Recognition Algorithm Based on Improved YOLOv5s,” in 2021 International Conference on Control, Automation and Information Sciences (ICCAIS), 2021.
- Y. Sun and L. Chen, “Traffic Sign Recognition Based on CNN and Twin Support Vector Machine Hybrid Model,” Journal of Applied Mathematics and Physics, vol. 9, no. 12, pp. 3122-3142, 2021.
- Z. Wang, J. Wang, Y. Li and S. Wang, “Traffic Sign Recognition With Lightweight Two-Stage Model in Complex Scenes,” IEEE Transactions on Intelligent Transportation Systems, vol. 23, no. 2, pp. 1121-1131, 2022.
- S. Ahmed, U. Kamal and M. K. Hasan, “DFR-TSD: A Deep Learning Based Framework for Robust Traffic Sign Detection Under Challenging Weather Conditions,” IEEE Transactions on Intelligent Transportation Systems, pp. 1-13, 2021.
- Z. Nadeem, A. Samad, Z. Abbas and J. Massod, “Pakistani traffic-sign recognition using transfer learning,” in 2018 International Conference on Computing, Electronic and Electrical Engineering (ICE Cube), 2022.
- Z. Liu, M. Qi, C. Shen, Y. Fang and X. Zhao, “Cascade saccade machine learning network with hierarchical classes for traffic sign detection,” Sustainable Cities and Society, vol. 67, p. 102700, 2021.
- J. Wan, W. Ding, H. Zhu, M. Xia, Z. Huang, L. Tian, Y. Zhu and H. Wang, “An efficient small traffic sign detection method based on yolov3,” Journal of Signal Processing Systems, vol. 93, no. 8, pp. 899–911, 2021.
- D. Nienhüser, T. Gumpp, J. M. Zöllner and K. Natroshvili, “Fast and reliable recognition of supplementary traffic signs,” in Intelligent Vehicles Symposium, 2010.
- A. S. Puthon, F. Moutarde and F. Nashashibi, “Recognition of supplementary signs for correct interpretation of traffic signs,” in Intelligent Vehicles Symposium (IV), 2013.
- T. Wenzel, S. Brueggert and J. Denzler, “Additional Traffic Sign Detection — A Comparative Study,” in 2015 IEEE 18th International Conference on Intelligent Transportation Systems, 2015.
- T. Wenzel, S. Brueggert and J. Denzler, “Towards unconstrained content recognition of additional traffic signs,” in 2017 IEEE Intelligent Vehicles Symposium (IV), 2017.
- T. Wenzel, S. Brueggert and J. Denzler, “Additional traffic sign detection using learned corner representations,” in Intelligent Vehicles Symposium (IV), 2016.
- T. Weber, E. Ercelik, M. Ebert and A. Knoll, “Recognition amp; Evaluation of Additional Traffic Signs on the example of ’80 km/h when wet’,” in 2019 IEEE Intelligent Transportation Systems Conference (ITSC), 2019.
- O. Hamdoun, A. Bargeton, F. Moutarde, B. Bradai and L. Chanussot, “Recognition of End-of-Speed-Limit and Supplementary Signs for Improved Speed Limit Support,” in 15th World Congress on Intelligent Transport Systems and ITS America’s 2008 Annual Meeting, 2008.
- X. Rong, C. Yi and Y. Tian, “Recognizing text-based traffic guide panels with cascaded localization network,” in European Conference on Computer Vision, 2016.
- O. de , G. Henrique, F. A. da Silva, D. R. Pereira, L. L. de Almeida, A. O. Artero, A. F. Bonora and V. H. C. de Albuquerque, “Automatic Detection and Recognition of Text-Based Traffic Signs from images,” IEEE Latin America Transactions, vol. 16, no. 12, pp. 2947 – 2953, 2018.
- H. Eun, J. Kim, J. Kim and C. Kim, “Fast Korean Text Detection and Recognition in Traffic Guide Signs,” in 2018 IEEE Visual Communications and Image Processing (VCIP), 2018.
- R. Jain and D. Gianchandani, “A Hybrid Approach for Detection and Recognition of Traffic Text Sign using MSER and OCR,” in 2018 2nd International Conference on I-SMAC (IoT in Social, Mobile, Analytics and Cloud) (I-SMAC)I-SMAC (IoT in Social, Mobile, Analytics and Cloud) (I-SMAC), 2018 2nd International Conference on, 2018.
- W. Wu, X. Chen and J. Yang, “Detection of text on road signs from video,” IEEE Transactions on Intelligent Transportation Systems, vol. 6, no. 4, pp. 378 — 390, 2005.
- Á. González, L. M. Bergasa, J. J. Yebes and J. Almazán, “Text recognition on traffic panels from street-level imagery,” in Intelligent Vehicles Symposium, 2012.
- J. Greenhalgh and . M. Mirmehdi, “Recognizing Text-Based Traffic Signs,” IEEE Transactions on Intelligent Transportation Systems, vol. 16, no. 13, pp. 1360 — 1369, 2015.
- A. Gonzalez, L. M. Bergasa and J. J. Yebes, “Text Detection and Recognition on Traffic Panels From Street-Level Imagery Using Visual Appearance,” IEEE Transactions on Intelligent Transportation Systems, vol. 15, no. 1, pp. 228 — 238, 2014.
- J. Guo, R. You and L. Huang, “Mixed Vertical-and-Horizontal-Text Traffic Sign Detection and Recognition for Street-Level Scene,” IEEE Access, vol. 8, pp. 69413-69425, 2020.
- K. S. Boujemaa, M. Akallouch, I. Berrada, K. Fardousse and A. Bouhoute, “ATTICA: A Dataset for Arabic Text-Based Traffic Panels Detection,” IEEE Access, vol. 9, pp. 93937-93947, 2021.
- R. Bagi, T. Dutta, N. Nigam, D. Verma and H. P. Gupta, “Met-MLTS: Leveraging Smartphones for End-to-End Spotting of Multilingual Oriented Scene Texts and Traffic Signs in Adverse Meteorological Conditions,” IEEE Transactions on Intelligent Transportation Systems, pp. 1-10, 2021.
- H. Luo, Y. Yang, B. Tong, F. Wu and B. Fan, “Traffic sign recognition using a multi-task convolutional neural network,” IEEE Transactions on Intelligent Transportation Systems, vol. 19, no. 4, pp. 1100-1111, 2017.
- X. Peng, X. Chen and C. Liu, “Real-time Traffic Sign Text Detection Based on Deep Learning,” in Materials Science and Engineering, 2020.
- J. Zhang, Z. Xie, J. Sun, X. Zou and J. Wang, “A cascaded R-CNN with multiscale attention and imbalanced samples for traffic sign detection,” IEEE Access, vol. 8, pp. 29742-29754, 2020.
- Korghond, N. Khazaee and R. Safabakhsh, “AUT-UTP: Urban traffic panel detection and recognition dataset,” in 24th Iranian Conference on Electrical Engineering (ICEE), 2016.
- S. Kheirinejad, N. Riahi and R. Azmi, “Persian Text Based Traffic sign Detection with Convolutional Neural Network: A New Dataset,” in 10th International Conference on Computer and Knowledge Engineering (ICCKE), 2020.
- A. Soetedjo and K. Yamada, “A new approach on red color thresholding for traffic sign recognition system,” Journal of Japan Society for Fuzzy Theory and Intelligent Informatics, vol. 19, no. 5, pp. 457-465, 2007.
- A. Mogelmose, M. M. Trivedi and T. B. Moeslund, “Vision-based traffic sign detection and analysis for intelligent driver assistance systems: Perspectives and survey,” IEEE Transactions on Intelligent Transportation Systems, vol. 13, no. 4, pp. 1484 – 1497, 2012.
- S. Maldonado-Bascón, S. Lafuente-Arroyo, P. Gil-Jimenez, H. Gómez-Moreno and F. López-Ferreras, “Road-Sign Detection and Recognition Based on Support Vector Machines,” IEEE Transactions on Intelligent Transportation Systems, vol. 8, no. 2, pp. 264 -278, 2007.
- Y. Li, S. Pankanti and W. Guan, “Real-time traffic sign detection: an evaluation study,” in 2010 20th International Conference on Pattern Recognition, 2010.
- C. G. Kiran, L. V. Prabhu and K. Rajeev, “raffic sign detection and pattern recognition using support vector machine,” in 2009 Seventh International Conference on Advances in Pattern Recognition, 2009.
- S. M. Bascón, J. A. Rodríguez, S. L. Arroyo, A. F. Caballero and F. López-Ferreras, “An optimization on pictogram identification for the road-sign recognition task using SVMs,” Computer Vision and Image Understandin, vol. 114, no. 3, pp. 373-383, 2010.
- P. Gil-Jimenez, H. Gomez-Moreno, P. Siegmann, S. Lafuente-Arroyo and S. Maldonado-Bascon, “Traffic sign shape classification based on Support Vector Machines and the FFT of the signature of blobs,” in 2007 IEEE Intelligent Vehicles Symposium, 2007.
- I. M. Creusen, R. G. Wijnhoven, E. Herbschleb and P. H. N.de, “Color exploitation in hog-based traffic sign detection,” in 2010 IEEE International Conference on Image Processing, 2010.
- Y. Wu, Y. Liu, J. Li, H. Liu and X. Hu, “Traffic sign detection based on convolutional neural networks,” in International joint conference on neural networks (IJCNN), 2013.
- R. Qian, B. Zhang, Y. Yue, Z. Wang and F. Coenen, “Robust chinese traffic sign detection and recognition with deep convolutional neural network,” in 11th International Conference on Natural Computation (ICNC), 2015.
- Z. Di, J. Zhang, D. Zhang, M. Bao, J. Cheng and K. Tang, “Traffic sign detection based on cascaded convolutional neural networks,” in 17th IEEE/ACIS International Conference on Software Engineering, Artificial Intelligence, Networking and Parallel/Distributed Computing (SNPD), 2016.
- L. Abdi and A. Meddeb, “Deep learning traffic sign detection, recognition and augmentation,” in Proceedings of the Symposium on Applied Computing, 2017.
- Z. Wang, J. Wang, Y. Li and S. Wang, “Traffic Sign Recognition With Lightweight Two-Stage Model in Complex Scenes,” IEEE Transactions on Intelligent Transportation Systems, vol. 23, no. 2, pp. 1121-1131, 2022.
- A. V. Reina, R. L. Sastre, S. L. Arroyo and P. G. Jiménez, “Adaptive traffic road sign panels text extraction,” in International Conference on Signal Processing, Robotics and Automation, 2006.
- A. Khodayari and M. Yousefi, “Design an Intelligent Driver Assistance System Based On Traffic Sign Detection with Persian Context,” International Journal of Automotive Engineering, vol. 6, no. 2, pp. 2138 -2147, 2016.
- Y. Zhu, M. Liao, M. Yang and W. Liu, “Cascaded Segmentation-Detection Networks for Text-Based Traffic Sign Detection,” IEEE Transaction Intelligent Transportation Systems, vol. 19, no. 1, pp. 209 — 219, 2018.
- H. Zhang, L. Qin, J. Li, Y. Guo, Y. Zhou, J. Zhang and Z. Xu, “Real-Time Detection Method for Small Traffic Signs Based on Yolov3,” IEEE Access, vol. 8, pp. 64145-64156, 2020.
- Z. Yi, S. Yongliang and Z. Jun, “An improved tiny-yolov3 pedestrian detection algorithm,” Optik, vol. 183, pp. 17 -23, 2019.
- W. Liu, D. Anguelov, D. Erhan, C. Szegedy, S. Reed, . C. Y. Fu and A. C. Berg, “Ssd: Single shot multibox detector,” in European conference on computer vision, 2016.
- X. Wang, A. Shrivastava and A. Gupta, “A-fast-rcnn: Hard positive generation via adversary for object detection,” in IEEE Conference on Computer Vision and Pattern Recognition, 2017.
- J. Redmon, S. Divvala, R. Girshick and A. Farhadi, “You only look once: Unified, real-time object detection,” in IEEE conference on computer vision and pattern recognition, 2016.
- J. Redmon and A. Farhadi, “YOLO9000: better, faster, stronger,” in IEEE conference on computer vision and pattern recognition, 2017.
- J. Redmon and A. Farhadi, “Yolov3: An incremental improvement,” in arXiv preprint arXiv, 2018.
- A. Bochkovskiy, C.-Y. Wang and H.-Y. M. Liao, “Yolov4: Optimal speed and accuracy of object detection,” arXiv preprint arXiv:2004.10934, 2020.
- J. Nelson and J. Solawetz, “Responding to the Controversy about YOLOv5,” https://blog.roboflow.com/yolov4-versus-yolov5/, 2020.
- M. Andreas, . M. M. Trivedi and . T. B. Moeslund, “Vision-based traffic sign detection and analysis for intelligent driver assistance systems: Perspectives and survey,” IEEE Transactions on Intelligent Transportation Systems, pp. 1484 — 1497, 2012.
- X. Baró, S. Escalera, J. Vitria, O. Pujol and P. Radeva, “Traffic Sign Recognition Using Evolutionary Adaboost Detection and Forest-ECOC Classification,” IEEE Transactions on Intelligent Transportation Systems, vol. 10, no. 1, pp. 113 – 126, 2009.
- M. Benallal and J. Meunier, “Real-time color segmentation of road signs,” in CCECE 2003-Canadian Conference on Electrical and Computer Engineering. Toward a Caring and Humane Technology, 2003.
- G. H. de Oliveira, F. A. da Silva, D. R. Pereira, L. L. de Almeida, A. O. Artero, A. F. Bonora and V. H. C. de Albuquerque, “Automatic Detection and Recognition of Text-Based Traffic Signs from images,” IEEE Latin America Transactions, vol. 16, no. 12, pp. 2947-2953, 2018.
- A.-S. Puthon, F. Moutarde and F. Nashashibi, “Recognition of supplementary signs for correct interpretation of traffic signs,” in 2013 IEEE Intelligent Vehicles Symposium Workshops (IV Workshops, 2013.
- A. Ruta, F. Porikli, S. Watanabe and Y. Li, “In-vehicle camera traffic sign detection and recognition,” Machine Vision and Applications, vol. 22, no. 2, pp. 359 – 375, 2011.
- T. Wenzel, S. Brueggert and J. Denzler, “Towards unconstrained content recognition of additional traffic signs,” in 2017 IEEE Intelligent Vehicles Symposium (IV), 2017.
- M. Zadeh, M. T. Kasvand and C. Y. Suen, “Localization and recognition of traffic signs for automated vehicle control systems,” Intelligent Transportation Systems, vol. 3207, pp. 272-282, 1998.