Evolutionary Learning of Fuzzy Rules and Application to Forecasting Environmental Impact on Plant Growth
(This article belongs to the Section Artificial Intelligence – Computer Science (AIC))
Export Citations
Cite
Nikolopoulos, C. and Koralik, R. (2022). Evolutionary Learning of Fuzzy Rules and Application to Forecasting Environmental Impact on Plant Growth. Journal of Engineering Research and Sciences, 1(4), 48–53. https://doi.org/10.55708/js0104006
Chris Nikolopoulos and Ryan Koralik. "Evolutionary Learning of Fuzzy Rules and Application to Forecasting Environmental Impact on Plant Growth." Journal of Engineering Research and Sciences 1, no. 4 (April 2022): 48–53. https://doi.org/10.55708/js0104006
C. Nikolopoulos and R. Koralik, "Evolutionary Learning of Fuzzy Rules and Application to Forecasting Environmental Impact on Plant Growth," Journal of Engineering Research and Sciences, vol. 1, no. 4, pp. 48–53, Apr. 2022, doi: 10.55708/js0104006.
Prediction of plant growth and yield is one of the essential tasks that enables growers of food and agricultural products to effectively manage their crops. In this paper, a hybrid evolutionary/fuzzy machine learning approach is introduced where a genetic algorithm is deployed to learn the optimum membership functions of relevant fuzzy sets and a knowledge base of fuzzy rules. This hybrid approach is then used to build a model which determines how ozone and carbon dioxide levels in the atmosphere affect plant growth by predicting the basal width growth of a plant. The hybrid forecasting model was tested on a data set collected from soybean fields and proved to be an extremely accurate and robust fuzzy predictor. It was able to predict the basal width growth of the plant with an average of 0.19% relative absolute value error.
1. Introduction
Prediction of plant growth and yield is one of the essential tasks that enables growers of food and agricultural products to effectively manage their crops to meet demand and minimize cost, by knowing the supply amount that will be needed to meet demand, resources needed to produce that amount, the effect of various environmental factors to their crop, etc. Recent studies have examined the effects of ozone and carbon dioxide in the atmosphere to plant growth and yield [1], [2].
Traditionally, predictive models of plant growth and yield were based on statistical methods like regression analysis, etc. [3] – [5]. More recently, after the advent and increased popularity of Artificial Intelligence (AI) and Machine Learning (ML), more and more forecasting techniques using algorithms from these areas are being applied to the problem of forecasting plant growth and yield. For example, decision trees or deep learning approaches [6]-[9].
In this paper, we introduce a hybrid fuzzy/evolutionary machine learning algorithm for learning a fuzzy knowledge base from a data set of soybean plant instances. The genetic algorithm optimizes the fuzzy sets membership functions which define each fuzzy set so that the resulting forecasting model is the most accurate and robust fuzzy predictor.
This hybrid evolutionary/fuzzy algorithm is then used to learn a knowledge base of fuzzy rules to determine how ozone and carbon dioxide levels in the atmosphere affect soybean plant growth, which of course, in turn affects the yield.
The growth parameter that was targeted for prediction was the plant’s basal width. A comparative study was also contacted, comparing the fuzzy logic approach with a hybrid, fuzzy logic with genetic optimization, approach in order to evaluate the performance achieved by the different methods. It is found that the hybrid machine learning algorithm outperforms the fuzzy logic approach used alone.
2. Fuzzy Logic and Genetic Algorithms
The aim of this research was to build a fuzzy logic forecasting system to determine how ozone and carbon dioxide affects plant growth. The system is a hybrid forecasting system, based on a fuzzy logic inference engine and a genetic algorithm optimization (GA) module. The GA module is used to find the optimum membership functions to be used for defining the fuzzy sets (fuzzy variables) used in the knowledge base. The knowledge base itself is comprised by a set of fuzzy inference rules.
In Boolean and predicate logic, statements can either be true (1) or false (0). Fuzzy Logic generalizes traditional logic by allowing statements to be true, partially true, somewhat true, etc. Fuzzy systems and fuzzy controllers have been extensively applied in industry and business with great success over the past several years. Sample lists of actual applications are in Aerospace, Automotive, Business, Chemical Industry, Defense, Electronics, Financial, Industrial, Manufacturing, Marine, Medical, Mining and Metal Processing, Robotics, and Securities. Other fields that have used Fuzzy Logic Systems have include agriculture, ecology, environmental sciences, geology, fisheries, and oceanography. These Fuzzy Logic Systems help decrease costs in research as well as improving accuracy of the assessments by automating processes not amenable to automation by traditional Boolean or predicate logic based intelligent systems [10] – [12].
Advantages of Fuzzy Logic over the logic programming or other approaches were exhibited in the current project as well. These include,
- Linguistic, not numerical, variables are used, making it similar to the human logic, therefore a fuzzy logic system may have better explanation facilities.
- Simplicity allows the solution of previously unsolved problems because they do away with complex analytical equations used to model traditional control systems
- Rapid prototyping is possible because a system designer doesn’t have to know everything about the system before starting work.
- They’re cheaper to make than conventional systems because they’re easier to design.
- They have increased robustness.
A fuzzy knowledge base is comprised by fuzzy sets (variables/attributes) and fuzzy rules. Fuzzy rules also operate using a series of if-then statements, for example, “If the room gets hotter, then spin the fan blades faster”. A fuzzy set is defined by its membership function. There are many alternate ways, proposed in the literature, for setting up a fuzzy forecasting system [3], [10]. Our system specifications are described in the following paragraphs.
There are many alternate definitions for the set operations of complement, union, intersection, and implication for fuzzy sets [1]. The membership functions, that we used in this project, to define the fuzzy logical operators are:
µA∩B(x) = min (µA(x), µB(x)).
µAUB(x) = max (µA(x), µB(x)).
µA=>B(x) = µ¬AVB(x) = max (1- µA(x), µB(x)).
µnot (A) (x) = 1- µA(x).
Fuzzy control, which uses fuzzy rules, is the most important application in fuzzy theory. Three steps are taken to create a fuzzy controlled machine:
1) Fuzzification (Using membership functions to convert crisp inputs to fuzzy facts)
2) Rule evaluation (Application of fuzzy rules, the fuzzy inference engine)
3) Defuzzification (converting the fuzzy output back into crisp or actual output)
Fuzzification:
- Input values are translated into linguistic concepts, which are represented by fuzzy sets.
- In other words, membership functions are applied to the measurements and the degree of truth in each premise is determined.
Rule Evaluation:
- Define the fuzzy rules.
- The fuzzy rules are merely a series of if-then statements.
- Plot the membership functions.
- A Fuzzy implication is of the form
IF (X1 is A1 and … Xn) is An THEN Y is B,
where Ai’s, and B are fuzzy sets.
Consider this rule and assume that the fact X is A’ holds for some fuzzy set, A’, different than A. There are many alternate ways proposed in the literature to define the firing of a fuzzy rule in the inference engine. In this project, we used the following implication formula. We calculate the membership function of fuzzy inference B’ as:
µB'(Y) = max x1 …xn [min (µA1′(X1) … µAn'(Xn), µiA1…An=>B(X1….Xn, Y))].
Defuzzification:
- Converts the derived fuzzy membership function of B’ to a crisp number (output). We used the weighted averages method for doing so.
- Physical systems need discrete values and hence Defuzzification is important.
The other major component of our system is based on the evolutionary approach of solving optimization problems, using Genetic Algorithms (GA).
GA is an Optimization technique mimicking Darwin’s theory of Evolution [10]. The basic GA process that we followed for solving our problem is as follows:
- Encode candidate solutions as “DNA” strings (sequence of symbols, the “individuals”).
- Pick a population size p, and construct an initial random population of p individuals.
- Define a fitness function: Populationreal numbers R, that assigns a number to an individual measuring its “goodness” as a solution. The bigger the fitness, the better the individual is as a solution.
- Define appropriate implementations of the genetic operators, reproduction (survival of the fittest), crossover and mutation.
- Define the mutation rate m%.
- Repeat the genetic operators, until convergence criterion is met:
- Reproduction (survival of the fittest)
- Crossover
- Mutation
The GA optimization technique has proven itself to be one of the best available such methods and has been applied in almost every area and enterprise from engineering, to medicine, to business and financial applications. One big advantage of GA is that it is a minimum knowledge algorithm, i.e. it does not require extensive and deep knowledge of the problem domain for getting a solution. Many mathematical optimization problems that we do not know how to solve are thus ideally attacked using this approach. The fundamental theorem of Genetic Algorithms proves that convergence to an optimum can be achieved as close as desired as the number of iterations of the GA approaches infinity. In practice of course, given the finite number of iterations that we perform, depending on the problem, we may not always be able to reach within a desired x% of the optimum in real time..
3. Data Set and Research Goal
The goal of this research is to build a fuzzy logic forecasting system to determine how ozone and carbon dioxide affects plant growth. The training/testing data set was provided by the Biology Department at Bradley University and was measured and collected over a period of time at soybean fields around Central Illinois.
The data shows the growth level in basal diameter of soybean plants as a time series and at different carbon dioxide and ozone levels. Four different experimental groups were involved: low carbon dioxide and low ozone levels, high carbon dioxide and low ozone levels, low carbon dioxide and high ozone levels, high carbon dioxide and high ozone levels. The low level of carbon dioxide is 370ppm, which is the current level in the atmosphere and the high level is 550ppm, which is the level expected in the year 2050. The low levels of ozone change daily as they are based on the levels in the atmosphere that day and the high ozone levels are 20% greater than the atmospheric levels of the day. There were four rings per group that each contained 25 plants, so that 100 trials were performed for each of the experimental groups. Each of the plants’ basal width, as a measure of growth, was measured twice a month for twelve months.
The data set was preprocessed by taking the basal widths for each ring and then finding an average for all of the widths. Then each of the four corresponding rings was averaged with each other to find an average for each group for the day. This was done for every seven days, and then the growth was found by taking the later date and subtracting it from the earlier date. The two basal width increases were found and then averaged to come up with the actual basal width increase for each group.
4. Building the Fuzzy Forecasting Model
We created membership functions of the input variables ozone and carbon dioxide levels and the output variables basal diameter from the provided training data set using statistical measures such as the mean and the range of the data. Other statistical measures such as the first and third quartile, based on each of the experimental group’s data, were experimented with but did not result in a significant improvement of the system.
A fuzzy rule base was then created and implemented using the JFS Fuzzy Logic Programming Environment to fuzzify the input and defuzzify the output. Analysis of the system results has been conducted by comparing the outputs of the program to the testing data set given from the experiment. The error between the output from the fuzzy forecasting system and the actual output from the training data set was computed.
The domains used for the input fuzzy variables were as follows. The domain for the experimental set for the O3 level was in the range 0-20, the domain used for the fuzzy set O3 level was 0-30 to allow for graceful degradation of the fuzzy set. The domain for the experimental set for the CO2 level was in the range 370-550, the domain used for the fuzzy set CO2 level was 300-700 to allow for graceful degradation of the fuzzy set.
The membership functions of the fuzzy sets, which will result in the least system error, were derived by experimentation.
The membership functions used were triangles that were centered at 325 and 565 ppm for low CO2 and high CO2 levels respectively, 0% and 21% increase for low and high O3 levels respectively, and 45, 71, and 92 hundredths of a millimeter increase for low, average, and high increase in basal diameter respectively.
A sample of the fuzzy rule knowledge base created is the following:
If CO2 level is low and O3 increase is low then basal width is low.
If CO2 level is low and O3 increase is high then basal width is low.
If CO2 level is high and O3 increase is low then basal width is average.
If CO2 level is high and O3 increase is high then basal width is high..
5. System Optimization Using Genetic Algorithms
We next experimented with using the genetic algorithm optimization approach to find an optimum set of membership functions for defining the fuzzy sets involved. And improve the accuracy of the system by minimizing the average absolute value error on the testing set. A membership function was encoded as an individual in the genetic population as described below. The reproduction, crossover, and mutation operators which were used to evolve the population of the encoded membership functions are defined as below.
Algorithm 1: GA(Fitness, Fitness_threshold, p, r, m) |
//Fitness=the fitness function which measures the “strength” (goodness) of an individual. //Fitness_threshold=termination criterion, max fitness to achieve or max number of iterations //p=population size //r=fraction of population to be replaced by crossover //m=mutation rate (how often to mutate) //k=max number of iterations |
{ create a new generation of individuals, Pi , by:
a. Selection/reproduction:
Probabilistically select p members of P to add to Pi. The probability of selecting individual h is P(h)= Fitness(h)/( Σj Fitness( hj )
b. Crossover:
Probabilistically select r*p/2 pairs of P individuals, according to P(h). For each pair <h1, h2>, produce 2 off-springs using the crossover operator defined below. Add off-springs to Pi.
c. Mutate:
Choose m% of members of Pi, with uniform probability. For each, apply the mutation operator defined below on a randomly selected bit.
d. Update: new population P= Pi, i=i++;
e. For each individual h in P, evaluate its fitness, fitness(h) }
-Return the population individual H with the highest fitness in the final generation (or among all generations).
End of algorithm
After experimentation, the initial population size, p, for the most successful run was selected to be 8 individuals.
Each triangular membership function was encoded as a string of 16 digits as follows.
The first 3 digits were the center for the triangle membership function of the fuzzy set CO2 low. The next 3 digits were the center for the triangle membership function of the fuzzy set CO2 high. The next 2 digits were the center for the triangle membership function of the fuzzy set O3 low. The next 2 digits were the center for the triangle membership function of the fuzzy set O3 high. The next 2 digits were the center for the triangle membership function of the fuzzy set basal diameter increase low. The next 2 digits were the center for the triangle membership function of the fuzzy set basal diameter increase average. The final 2 digits were the center for the triangle membership function of the fuzzy set basal diameter increase high.
The fitness function of an individual was 1/error where error is the average absolute value error calculated by:
∑i=1n |actual i-predicted i|/n.
A 2-point crossover was used, where 2 digits were picked by random and the parents were crisscrossed. Mutation was done at 1 or 2 points of the assigned numbers to the triangular distribution.
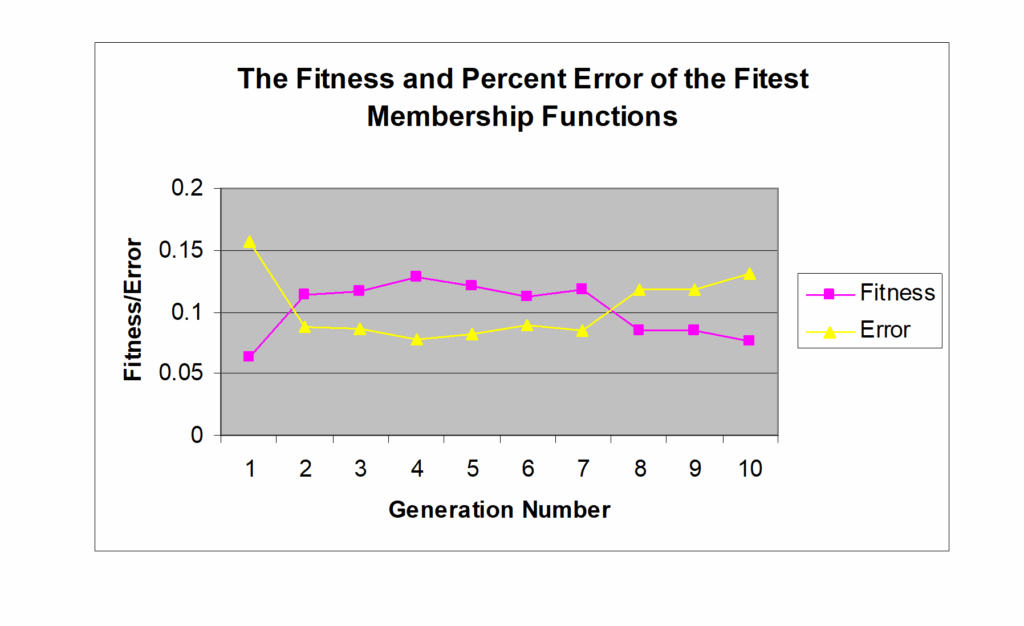
The best individual, the one that resulted in the smallest error, was found early in generation 4 among the max 100 iterations, with fitness of .128341. Using those membership functions result in a system percent error of .077918. For the process of how the generations evolved, see graph in figure 1.
6. Synopsis of Results
Even though the fuzzy predictor model was satisfactory in accuracy by itself, the GA algorithm was able to learn the most appropriate membership functions from the data itself, automating the process and eliminating the need of the human knowledge engineer to figure out such memberships. The GA process was able to calibrate the membership functions to a degree that improved the system performance as shown below.
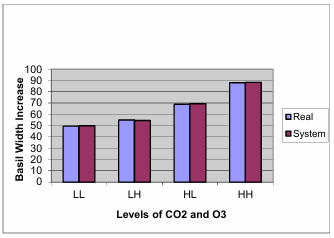
The following, table 1 and figure 2, give the average output from the real training data as compared to the fuzzy model output:
Table 1: Actual vs. Model Predicted value of Basal Width increase at different Levels of CO2 and O3
Actual | FL System | Error% FL | FL+GA Hybrid | Error % FL+GA Hybrid | |
LL | 49.5 | 49.875 | 0.757 | 49.641 | 0.282 |
LH | 55 | 54.594 | 0.738 | 55.124 | 0.218 |
HL | 69 | 69.375 | 0.543 | 68.920 | 0.115 |
HH | 88 | 88.242 | 0.275 | 88.142 | 0.159 |
Average error | 0.578 | 0.193 |
The average error in thousandths of a millimeter is calculated as follows:
Average error= (1/n) ∑i=1n |actuali -predictedi |,
where n=4 in this case, corresponding to {LL, LH, HL, HH}.
The average computed error was about 5.7 thousandths of a millimeter for the Fuzzy logic system and 1.9 thousandths for the FL+GA system, for an overall forecasting improvement of over 33% when the GA was used to learn the membership functions.
Graph 3, given below, shows the basal width increase of the plants at many different levels of CO2 and O3:
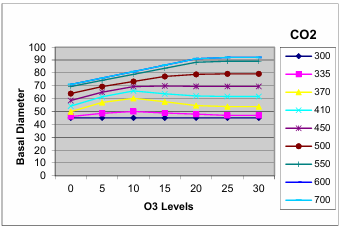
We observe that for low CO2, the amount of O3 has no effect on the diameter since the amount of O3 does not improve the growth of the diameter. For high levels of CO2, increased O3 levels will increase diameter up to a certain level of O3, after which continual increase of O3 might actually hurt the plant. That critical point of O3 level that gives the maximum growth tends to be higher as the level of CO2 is higher.
For any given levels of CO2 and O3, the present system can predict the basal diameter of the plant within the error of 1.9 thousandths of a millimeter.
7. Conclusions
In this paper, a hybrid fuzzy/evolutionary machine learning approach was introduced for learning a fuzzy knowledge base from a data set. This approach was then used to learn a knowledge base of fuzzy rules to determine how ozone and carbon dioxide levels in the atmosphere affect plant growth, specifically basal width, which of course, in turn affects the yield.
The results of a comparative study, comparing the fuzzy logic approach with the hybrid, fuzzy logic plus genetic optimization approach, showed that the performance achieved by the hybrid approach was superior and far more accurate in forecasting the growth parameter, by a factor of more than 30%. Given the levels of CO2 and O3, the hybrid forecasting system can predict the basal diameter of the plant after growth within an error of 1.9 thousandths of a millimeter.
- Khan, S., Nazneen, S., Ali, N., 2021. Effects of ozone phytotoxicity in reducing the yield and nutritional quality of chilli, (Capsicum annuum L.) Environmental Science and Pollution Research, vol. 28, pages8889–8897
- Shao, Z., Zhao, Y., Zhang, Y., Wang, Y., Yang, L., 2021. Effect of ozone stress on yield characteristics of indica-japoic hybrid rice Yongyou 538 in two consecutive growing seasons, Environmental and Experimental Botany, vol. 186, 104447
- Becker-Reshef, I., Vermote, A., Lindeman, M., Justice, C., 2010. A generalized regression-based model for forecasting winter wheat yields in Kansas and Ukraine using MODIS data. Remote Sens. Environ. 114, 1312-1323..
- Drummond, S. T., Sudduth, K. A., Joshi, A., Birrell, S. J., and Kitchen, N. R., 2003. Statistical and neural methods for site specific yield prediction. Trans. ASAE 46, 5.
- D. Obell, M. Burke, M., 2010. On the use of statistical models to predict crop yield responses to climate change. Agric. Forest. Meteor. 150, 1443–1452.
- Archontoulis, S., Licht, M., Dietzel, R., 2015. In-Season Forecasting of Plant Growth, Soil Water-Nitrogen, and Grain Yield. Iowa State University Farm Progress Reports: Volume 2015, Issue 1
- Daniel, J., Andrés, P., Héctor, S., Miguel, B. & Marco, T. 2008, “A survey of artificial neural network-based modeling in agroecology” in Soft Computing applications in industry Springer, , pp. 247-269.
- Kamilaris, A. & Prenafeta-Boldú, F.X. 2018, “Deep learning in agriculture: A survey”, Computers and Electronics in Agriculture, vol. 147, pp. 70-90.
- Liakos, K., Busato, P., Moshou, D., Pearson, S. and Bochtis, D., 2018. Machine learning in agriculture: A review. Sensors, 18(8), p.2674.
- Cornelius T., Leondes, K., 1998. Fuzzy Logic and Expert Systems Applications. Academic Press, (1998).
- Theile, M., 2009. Exact Solutions to the Traveling Salesperson Problem by a Population-Based Evolutionary Algorithm. Evolutionary Computation in Combinatorial Optimization
- Nikolopoulos, C., 1997. Expert Systems. CRC Press/MarcelDekker, New York, USA.