Machine Learning Aided Depression Detection in Community Dwellers
(This article belongs to the Section Artificial Intelligence – Computer Science (AIC))
Export Citations
Cite
Kumar, V. , Khajuria, M. and Singh, A. (2022). Machine Learning Aided Depression Detection in Community Dwellers. Journal of Engineering Research and Sciences, 1(5), 17–24. https://doi.org/10.55708/js0105002
Vijay Kumar, Muskan Khajuria and Anshu Singh. "Machine Learning Aided Depression Detection in Community Dwellers." Journal of Engineering Research and Sciences 1, no. 5 (May 2022): 17–24. https://doi.org/10.55708/js0105002
V. Kumar, M. Khajuria and A. Singh, "Machine Learning Aided Depression Detection in Community Dwellers," Journal of Engineering Research and Sciences, vol. 1, no. 5, pp. 17–24, May. 2022, doi: 10.55708/js0105002.
Depression is a mental condition that can have serious negative effects on an individual’s thoughts and nd health problems that could lead to grave heart diseases. Depression detection has become necessary in community dwellers considering the lifestyle being followed. Here we use NHANES dataset to compare the performance of various machine learning algorithms in depression detection. The 2015 dataset was used to train the models and testing was done on data from 2017 to analyze the robustness of the model. Feature extraction was also performed on the dataset to observe relevant features. It was found that ADABoost used wit ic Minority Oversampling Technique (SMOTE) gave the best test results in terms of F1 score.
1. Introduction
Depression is a psychological disorder that can be characterized by the existence of persistent sadness for at least two weeks. It creates an inability to perform daily activities, the depressed persons lose their interests and pleasures in doing those things that they usually enjoy. Nowadays a large number of youth and adults around the world suffer from depression. Depression can cause severe problems in case of failing to detect it at an early stage or failing to ensure the timely counseling of a depressed person. It is one of the major reasons to raise suicidal cases. During COVID-19 pandemic situation, depression has become a major health concern in the world and 322 million people all over the world are living with depression.
Every year about 0.8 million suicide cases take place worldwide. Among them, half of the cases occur due to depression. Over 700,000 people die due to suicide every year. Suicide is the fourth leading cause of death in 15-29 year age range. Major depressive disorder is a treatable mental disorder that appears when the individual is too stressed out. Globally, it is estimated that 5.0% of adults suffer from depression.
The effort to shun the stigma associated with mental illness like depression calls for greater awareness as these problems tend to be brushed aside. Another solution is mass screening, which requires a great amount of resources and time. However, this screening has the potential to reduce to few people. There may be people in certain demographics that may be more prone to depression because of genetic, health, medicinal, financial and social conditions. If those groups can be identified, special attention can be provided as an aid to prevent depression and also monitor them closely, and look at the contributing and affecting factors regarding depression.
Machine learning has the capability to automatically identify the patterns in the data and make predictions accordingly. This technology is being applied to different disciplines and has proved to emerge as a significant aid in the medical field as well.
Therefore, the aim is to make the use of machine learn- ing models to predict if given community dweller may be depressed or not. The machine learning models are then trained on the relevant features of the data and their accuracy is compared by using different metrics.
Machine learning will help predict disease accurately which would enable medical teams to do the treatment.
This study utilizes datasets available at National Health and Nutrition Examination Survey (NHANES) [1] for building a model to predict depression using data from the year 2015 and 2017. The performance of various classification algorithms with different combinations of SMOTE [2], SMOTE with undersampling and SelectKBest algorithms were compared.
The parameter for evaluation of results are accuracy, F1 score and ROC AUC score. ADABoost paired with SMOTE with undersampling gave the best F1 score. XGBoost paired with SMOTE with undersampling provided the highest ROC AUC score. The highest accuracy [3] was seen in Random Forest. XGBoost with undersampling gave the best F1 [4] and ROC AUC [5] score in the dataset formed using SelectKBest algorithm, and LR gave the best accuracy.
We develop a model to predict depression in a community dweller. It would help predict dwellers at a risk.
The major contributions of this study are:
- Identifying the most important socio-demographic factors responsible for depression.
- Using health conditions and psychosocial information of the persons to predict depression.
- Using machine learning and feature selection algorithms to predict existence of depression efficiently.
- Simple questions make procedure to collect information easier, as suspected depressed person are not required to answer authentic depression screening
- Comparing different algorithms to observe the best performing algorithms.
- Using dataset from different years to make model more robust.
2. Literature Review
There have been studies to apply Machine Learning to predict depression in communities to identify the vulnerable groups.
- A study in China used machine learning to predict depression in the elderly. The data was collected in the form of a questionnaire with information about demographics, health related risk factors and chronic disease K Nearest Neighbour (KNN) was used to fill in the missing data. The machine learning mod- els used were linear regression, linear regression with LASSO regularisation, gradient-boosted decision tree (GBDT), Support Vector Machines (SVM) and Deep Neural Network (DNN). Linear regression (AUC=0.63) and DNN performed comparable to LSTM (reference) using AUC, one of the reasons could be their ability to deal with nonlinear relationships between variables [6].
- This study used Novel Assessment of Nutrition and Ageing(NANA) to predict depression by using LASSO and k-fold cross validation. The model produced an area under the ROC curve of value 0.88 [7].
- It was found that model-based policy can save approximately 50% to 60% of provider resources as compared to mass screening but will not identify 30% of patients with Patient Health Questionnaire (PHQ) was taken as measure and 20 candidate predictors were identified from the combined DCAT-MDDP data. Using 10-fold cross-validation results, LR out- performed the other 3 models in AUROC (LR = 81%, multilayer perceptron = 80%, SVM = 73%, random forest = 0.78). The LR model also had the highest per- centage of correctly classified instances of depression (LR = 74.0%, multilayer perceptron = 73.5%, SVM = 71.6%, random forest = 72.6%) and sensitivity (LR = 0.65, multilayer perceptron = 0.55, SVM = 0.61, ran- dom forest = 0.65), and the second highest specificity (LR = 0.81, multilayer perceptron = 0.88, SVM = 0.80, random forest = 0.79) among the 4 models. [8]
- A study in Kerala was proposed to detect using Various sociodemographic variables like age and gen- der were taken into consideration to develop the model. The ANN Model that was designed with seven inter- connected neurons in one hidden layer had prediction accuracy of 97.2% [9].
- XGBoost model used on a set of 28 biomarkers from the Lifelines Database that related to immune functioning, cell metabolism, etc. Multiple samples were created using under sampling, over sampling and over-under sampling to balance the Overall score of more than 0.90 were obtained [10].
- This study is done on the dataset for the KHANES for the year 2014 and 2016, where 2014 data was taken as training set while 2016 as test set to see the efficiency of the model with future dataset. LASSO technique was used for feature reduction and classifiers in the final For controlling class imbalances between the two groups in the 2014 dataset SMOTE was used [11].
- The classification models were trained on 365 exams using a binary cross-entropy loss function and an in- dependent set of 91 exams were left for a testing A regularization method was used to avoid overfitting the training data. Accuracy of 69.23)% was achieved for the model. This model uses a multimodal deep learning model that used video data, audio data, and word content from participants’ responses, as well as demographics and other metadata [12].
- NHANES data set was used to identify the medical conditions associated with people in depression. They first identified the clusters with high depression rate using Traditional binary LR was also used for their identification. A boosted regression machine learning algorithm was used to provide a relative importance percentage for each medical symptom for each of the five key significant clusters, allowing the easy grouping of symptoms into medical categories. The machine learning boosted regression algorithm was able to untangle the array of medical symptoms. [13] For a brief comparison with other studies, this study predicts if an individual is having depression while other similar studies have focused on predicting de- pression among a certain age group, occupation or health, this study has extracted for professions, health conditions and socioeconomic backgrounds. Different studies achieved accuracy in a range of 60-80%, this study gives accuracy of 0.92 with Random-forest using techniques like ADA Boost, SMOTE, Random Forest classifier with 25 attributes varying in health status, income status, social status, mental condition and behavior of past few days [14], [15]. From the review of literature about machine learning application in mental health, it was found that machine learning algorithms are useful in predicting depression cases. In most of the research papers, the sample size was small hence it creates a doubt that the powerful machine learning algorithms like SVM, random forest, kNN etc. may overfit the data and will give high variance output when model is applied on new data. It should also be taken into consideration that the dataset is taken from clinical studies and trials and real life scenarios do not always support balanced proportions of target variable classes.
3. Materials and Methods
In this section, the dataset and techniques used for depression prediction are briefly described.
3.1. Data Set
The National Health and Nutrition Examination Survey releases data in two-year groupings. This paper used 2015 datasets as training data with 152 variables and 2017 for testing for 152 variables. The data consisted of various segments, out of which the following were selected for this study :
- AccultrationDF: Acculturation section provides personal interview data on language use in the home. Questions asked and response categories used were customized, based on self-identified race and Hispanic
- AlcoholDF: Alcohol Use Questionnaire (variable name prefix ALQ) focuses on lifetime and current use (past 12 months). Questions are not specific to type of alcohol used.
- AudiometryDF: Audiometry questionnaire section (variable name prefix AUQ) provides interview data on self-reported hearing status, tinnitus (ringing in the ears), hearing screening history, the use of hearing aids, the use of assistive devices for hearing, and risk factors for hearing loss.
- BPCholDF: Blood Pressure/Cholesterol section (variable name prefix BPQ) provides personal interview data on awareness, treatment, and control of high blood pressure and high cholesterol.
- CardiocDF: Cardiovascular Disease and Health section (variable name prefix CDQ) provides participant level interview data on evaluating cardiovascular health and includes questions to assess the presence of angina pectoris as defined by the Rose1
- ConsumerDF: Consumer Behavior questionnaire (variable name prefix CBQ) section provides interview data on food expenditures at the family level as part of the Flexible Consumer Behavior Survey (FCBS) module.
- Curr_healthDF: Current Health Status section (variable name prefix HSQ) provides personal interview data on overall health assessment, recent illness (past 30 days), blood donation, and HIV testing.
- Mental_HealthDF: A nine-item depression screening instrument (variable name prefix DPQ), also called the Patient Health Questionnaire was administered to determine the frequency of depression symptoms over the past 2 weeks. A follow-up question assessed the overall impairment of the symptoms. Response categories for the nine-item instrument “not at all,” “several days,” “more than half the days,” and “nearly every day” were given a point ranging from 0 to 3. The in- strument incorporates DSM-IV depression diagnostic criteria.
- DermaDF: Dermatology questionnaire section (variable name prefix DEQ) provides personal interview data on sun exposure and sun protective behavior.
- DiabetesDF: Diabetes section (variable name prefix DIQ) provides personal interview data on diabetes, prediabetes, use of insulin or oral hypoglycemic medications, and diabetic retinopathy. It also provides self-reported information on awareness of risk factors for diabetes, general knowledge of diabetic complications, and medical or personal cares associated with
- DietDF: Diet Behavior and Nutrition questionnaire (variable name prefix DBQ) provides personal inter- view data on various dietary behavior and nutrition related topics. Many of the questions were included in NHANES II (1976-80).
- DisabilityDF: Disability questionnaire (variable name prefix DLQ) provides respondent-level interview data on serious difficulty hearing, seeing, concentrating, walking, dressing, and running errands.
- DrugDF: Drug Use Questionnaire (variable name prefix DUQ) focuses on lifetime and current use of marijuana or hashish, cocaine, heroin, and methamphetamine, as well as intravenous use of these and other drugs.
- EarlyChildDF: Early Childhood questionnaire (variable name prefix ECQ) section of the Sample Person Questionnaire provides personal interview data for children, including the age of the biological mother when the child participant was born, smoking habits of the mother while she was pregnant with the participant, birth weight and the proxy’s assessment of the participant’s current weight.
- FoodSecDF: Food Security section (variable name pre- fix FSQ) provides individual and household-level interview data on the following topics – Household food security, Supplemental Nutrition Assistance Program (SNAP)/Food Stamp program benefits and Women, Infants and Children (WIC) program benefits
- HealthInsDF: Health Insurance questionnaire (variable name prefix HIQ) provides respondent-level interview data on insurance coverage, type of insurance coverage, coverage of prescription drugs, and uninsured status during the past 12 months.
- HospitalDF: Hospital Utilization and Access to Care questionnaire (variable name prefix HUQ) provides respondent-level interview data on self-reported health status and access to health care topics.
- HousingDF: Housing Characteristics section (variable name prefixes HOQ or HOD) provides family-level interview data on the number of rooms in home and whether the home is owned or Note: The variables HOQ.040 (age of home), HOQ.060 (time lived in home), HOQ.070 (source of tap water for home), and HOQ.080 and HOQ.085 (water treatment device use and type, respectively) were dropped from the questionnaire in 2011-12.
- ImmunizationDF: Immunization section (variable name prefix IMQ) provides respondent-level data on immunizations, including the hepatitis A vaccine, the hepatitis B vaccine, and the human papillomavirus (HPV) The number of doses received is also obtained since all vaccines are multi-dose.
- IncomeDF: Income section (variable name prefix INQ) provides family level information on income sources, monthly income, family cash assets, and mode of transportation to grocery store(s). Information on family’s annual income was also collected in this section and was released as part of the Demographics file (DEMO_I).
- MedicalDF: Medical conditions section (variable name prefix MCQ) provides self- and proxy-reported personal interview data on a broad range of health conditions and medical history for both children and adults. The NHANES MCQ questionnaire section is generally modeled on the “Medical Conditions” questionnaire section of the S. National Health Interview Survey.
- OccupationDF: Occupation Questionnaire (variable name prefix OCQ) section (questions OCD150 to OCQ660), which is part of the household interview, contains Survey Participant interview data on employment and variables relating to the work
- PhysicalActDF: Physical Activity questionnaire (variable name prefix PAQ) is based on the Global Physical Activity Questionnaire (GPAQ) and provides respondent-level interview data on physical activities
- PhysicanFuncDF: Physical Functioning questionnaire (variable name prefix PFQ) provides respondent-level interview data on functional limitations caused by long-term physical, mental, and emotional problems or illness.
- ReproductiveDF: Reproductive health section (variable name prefix RHQ) contains questions for females Questions on reproductive health include menstrual history, pregnancy history, hormone replacement therapy use, and other related reproductive conditions.
- SleepDF: Sleep disorders (variable name prefix SLQ) data set provides questions on sleep habits and disorders. The number of questions was expanded to include several questions previously asked in NHANES 2007-2008 (and earlier), and two new questions about usual sleep and wake times.
- SmokingDF: Smoking – cigarette use (variable name prefix SMQ) data set provides a history of cigarette use, age at initiation, past 30 day use, cigarette brand, sub-brand and other related details. Questions on ever use of cigars, smokeless tobacco, and electronic nicotine delivery systems (including e-cigarettes) are new for 2015-16 (18 years and older).
- WeightDF: Weight History section of the Sample Person Questionnaire (variable name prefix WHQ) pro- vides personal interview data on several topics related to body weight, including self-perception of weight, self-reported weight over the participant’s lifetime, attempted weight loss during the past 12 months, and methods used to try to lose weight and to keep from gaining weight.
An inner join of all these separate tables was performed using the sequence number, and the null values were dropped as they constituted only a small part of the dataset. The final training dataset consisted of 3540 rows. The final testing dataset consisted of 3381 rows. Nine-item version of the Patient Health Questionnaire (PHQ-9) was used to measure depression. The features were added and a threshold value (here, 10) was selected. A score of greater than or equal to that of the threshold was marked as depressed. This procedure was followed for both the training and the testing dataset.
3.2. Techniques Used
3.2.1. Machine Learning Models
The performances of the following machine learning algorithms were compared:
- Logistic Regression (LR)
- Decision Tree
- Random Forest
- ADABoost
- XGBoost
3.2.2. Feature Extraction
The SelectKBest algorithm was used to extract the top 25 relevant features and a dataset comprising of only these features was created.
3.2.3. Data Augmentation
SMOTE and SMOTE with undersampling were applied on the two dataset – one with all the features present and one comprising on only the features extracted using SelectKBest algorithm.
3.3. Methodology used for depression detection
The proposed methodology consists of four main modules. These are data preparation, feature extraction, data aug- mentation, and model building. These modules are briefly described in the preceding subsections.
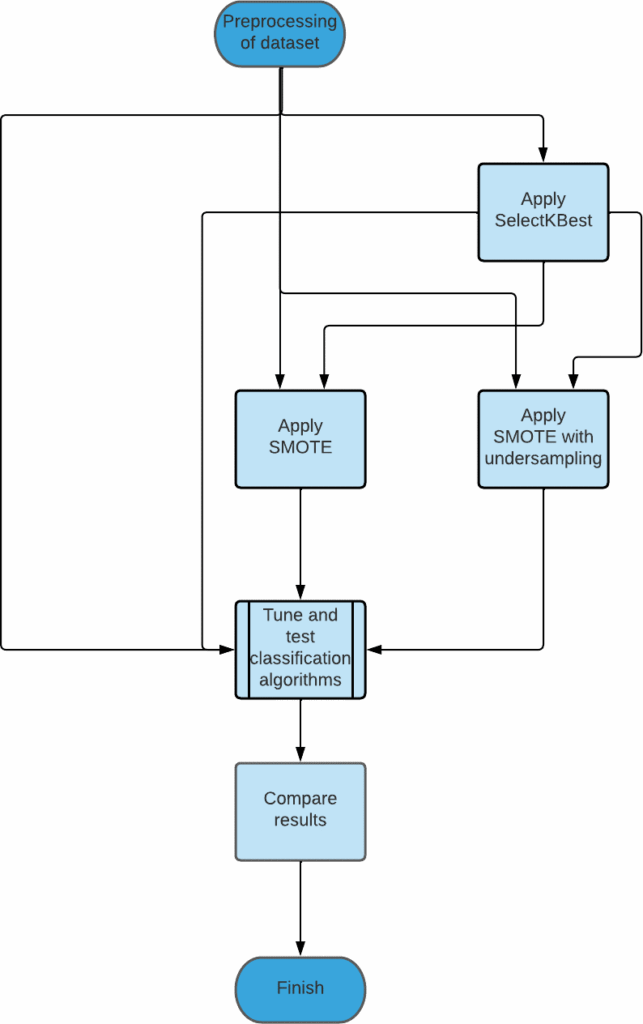
3.3.1. Preparing the data
Data preparation module consists of two main phases namely identification of relavant variables and handling the null values present in the dataset.
- Selecting relevant variables : Since the dataset consisted of a large number of variables, the ones that could prove to be most suited were selected and
- Null value handling : Since the percentage of null values in the dataset was small, they were
3.3.2. Using Feature Extraction
SelectKBest was used to extract the top 25 relevant features from the given features present. There were two datasets now – the one with the original features and the one with the features extracted using SelectKBest.
3.3.3. Using Data Augmentation
Two techniques – SMOTE and SMOTE with undersampling were then applied on both the datasets obtained from the previous step.
3.3.4. Training and Testing the models
The machine learning algorithms were the trained using the datasets obtained from the previous steps. The data from 2015 was used for this purpose. Following the training, the models were then tested using data from 2017. The results were then compiled.
4. Results and Discussion
In this section, the performance evaluation of machine learning models is evaluated.
4.1. Performance measure
Three different metrics are used to perform comparison of the different machine learning models.
- F1 score: F1 score is the harmonic mean of precision and It is considered a good metric to evaluate binary classification systems, particularly when dataset is imbalanced, such as when the number of people not depressed outweighs the number of depressed people.
𝐹1 = 2∗𝑃𝑟𝑒𝑐𝑖𝑠𝑖𝑜𝑛∗𝑅𝑒𝑐𝑎𝑙𝑙/(𝑃𝑟𝑒𝑐𝑖𝑠𝑖𝑜𝑛+𝑅𝑒𝑐𝑎𝑙𝑙) (1.0)
- Accuracy: Accuracy is the measure that is the fraction of the correct classifications to the total number of classifications made. A huge number of studies use this metric to evaluate their models and it makes com- parison to models in different studies easier, though it is more relevant to studies that have a balanced dataset.
𝐴𝑐𝑐𝑢𝑟𝑎𝑐𝑦 = 𝑇𝑃 + 𝑇𝑁/(𝑇𝑃 + 𝑇𝑁 + 𝐹𝑃 + 𝐹𝑁) (2.0)
Where TP stands for true positive, TN stands for true negative, FPstands for false positive and FN stands for false negative.
- AUC-ROC value: AUC stands for area under curve and ROC stands for Receiver Operating Characteristics. Hence this metric is a measure of area under the ROC curve. A higher AUC signifies a better model, as it tells the capability of the model to separate the classes.
4.2. Validation Scores
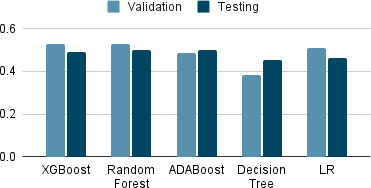
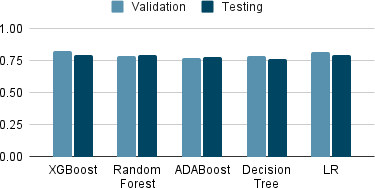
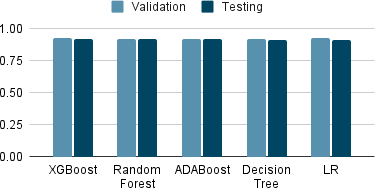
Tables 1-3 show the top 5 performing machine learning algorithms in terms of F1 score, accuracy and AUC-ROC value while performing the validation. They were trained on the 2015 dataset. It can be seen that Random Forest using SMOTE with undersampling has the highest F1 score, XGBoost using SMOTE with undersampling has the highest AUC-ROC value and LR has the highest accuracy.
Table 1: The top 5 algorithm validation F1 scores
Algorithm | F1 Score |
Random Forest SMOTE (undersampling) | 0.5306 |
XGBoost SMOTE (undersampling) | 0.5306 |
LR SMOTE (undersampling KBest) | 0.5110 |
ADABoost SMOTE (KBest) | 0.4867 |
Decision Tree SMOTE | 0.3855 |
Table 2: The top 5 algorithm validation AUC-ROC value
Algorithm | AUC-ROC |
XGBoost SMOTE (undersampling) | 0.8282 |
LR SMOTE KBest | 0.8203 |
Random Forest SMOTE (undersampling) | 0.7879 |
Decision Tree SMOTE (undersampling KBest) | 0.7842 |
ADABoost SMOTE (undersampling KBest) | 0.7743 |
Table 3: The top 5 algorithm validation accuracy
Algorithm | Accuracy |
LR | 0.9300 |
XGBoost | 0.9279 |
ADABoost | 0.9237 |
Random Forest | 0.9237 |
Decision Tree | 0.9201 |
4.3. Testing Scores
Tables 4-6 show the top 5 performing machine learning algorithms in terms of F1 score, accuracy and AUC-ROC value while performing the testing. They were trained on the 2015 dataset and testing was done using 2017 dataset. It can be seen that ADABoost using SMOTE with under- sampling has the highest F1 score, XGBoost using SMOTE with undersampling has the highest AUC-ROC value and Random Forest has the highest accuracy.
Table 4: The top 5 algorithm testing F1 scores
Algorithm | F1 Score |
ADABoost SMOTE (undersampling) | 0.5006 |
Random Forest SMOTE (undersampling) | 0.5000 |
XGBoost SMOTE (undersampling) | 0.4893 |
LR SMOTE (undersampling) | 0.4631 |
Decision Tree SMOTE (undersampling) | 0.4541 |
Table 5: The top 5 algorithm testing AUC-ROC value
Algorithm | AUC-ROC |
XGBoost SMOTE (undersampling) | 0.7996 |
LR SMOTE (KBest) | 0.7938 |
Random Forest SMOTE (undersampling) | 0.7934 |
ADABoost SMOTE (undersampling) | 0.7796 |
Decision Tree SMOTE (undersampling) | 0.7664 |
Table 6: The top 5 algorithm testing accuracy
Algorithm | Accuracy |
Random Forest | 0.9210 |
ADABoost | 0.9201 |
XGBoost | 0.9174 |
LR | 0.9162 |
Decision Tree (KBest) | 0.9136 |
The 25 relevant features as chosen by SelectKBest:
- PFQ090 :Require special healthcare equipment
- INQ060 :Income from other disability pension
- DBQ197 :Past 30 day milk product consumption
- CBD071 :Money spent at supermarket/grocery store
- WHQ225 :Times lost 10 lbs or more to lose weight
- CBQ596 :Heard of My Plate
- MCQ300C :Close relative had diabetes?
- MCQ160F :Ever told you had a stroke
- INQ150 :Income from other sources
- DMDMARTL :Marital status
- SDMVSTRA :Masked variance pseudo-stratum
- AUQ054 :General condition of hearing
- CBD091 :Money spent on nonfood items
- HUQ071 :Overnight hospital patient in last year
- DLQ150 :Take medication for depression?
- HSAQUEX :Source of Health Status Data
- HUQ010 :General health condition
- INQ140 :Income from interest/dividends or rental
- DLQ020 :Have serious difficulty seeing?
- MCQ160L :Informed of liver condition
- FSD032B :HH Food didn’t last
- MIALANG :Language of MEC Interview
- DLQ140 :How often do you feel depressed?
- RIDRETH1 :Race/Hispanic origin
- DBD910 :Previous month number of frozen meals
4.4. Discussion
In the testing and validation score tables, if the algorithm is applied alongside SMOTE, it is mentioned. It is also mentioned separately if it is SMOTE or SMOTE with un- dersampling. If KBest has been mentioned, then it implies that the model was trained and tested using the features that were extracted by applying the SelectKBest feature extraction.
Here different techniques were used on dataset like SMOTE, SMOTE with undersampling and SelectKBest feature ex- traction. The performances of models were then compared with metrics using F1 score, AUC ROC score and accuracy. It was found that the highest testing accuracy comes out to be 92% by random forest and ADABoost, closely followed by XGBoost. XGBoost outperforms all others in terms of AUC-ROC value with a value of 0.79, when it used SMOTE with undersampling along with SelectKBest. When looking at F1 score, the highest F1 score of 50 was achieved by ADABoost and Random Forest, however here too, XGBoost was not far behind.
The SelectKBest selected features like income, marital status and general health condition as contributing factors to depression, which are in tune with general intuition as to which factors might play a contributing role. Not only this, it selected race as a predictor too.
For the possibility of creation of actual predictor to be deployed in use, it would be beneficial to train on a wider range of features and with a bigger dataset, also while considering the data from different time ranges. It would be better to include the community specific features and train them, ass different communities may have different standards of living.
5. Conclusion
The paper compared various machine learning algorithms to predict depression in community dwellers. Different techniques such as SMOTE and SelectKBest were used on dataset. Machine learning models like XGBoost and AD- ABoost were used further. The algorithms were then ranked according to the metrics like F1 score, AUR-ROC value and accuracy.
This study can further be improved by considering a larger dataset and using a wider range of features in order to train and test the models. Further, data from different years can be used, to make the model more robust to time.
- J. A. Fain, “Nhanes: Use of a free public data set”, The Diabetes Educa- tor, vol. 43, no. 2, pp. 151–151, 2017, doi:10.1177/0145721717698651, pMID: 28340543.
- N. Chawla, K. Bowyer, L. Hall, W. Kegelmeyer, “Smote: Synthetic minority over-sampling technique”, J. Artif. Intell. Res. (JAIR), vol. 16, pp. 321–357, 2002, doi:10.1613/jair.953.
- M. Hossin, S. M.N, “A review on evaluation metrics for data classifica- tion evaluations”, International Journal of Data Mining & Knowledge Man- agement Process, vol. 5, pp. 01–11, 2015, doi:10.5121/ijdkp.2015.5201.
- C. Goutte, E. Gaussier, “A probabilistic interpretation of preci- sion, recall and f-score, with implication for evaluation”, Lec- ture Notes in Computer Science, vol. 3408, pp. 345–359, 2005, doi: 10.1007/978-3-540-31865-1_25.
- A. P. Bradley, “The use of the area under the roc curve in the evaluation of machine learning algorithms”, Pattern Recognition, vol. 30, no. 7, pp. 1145–1159, 1997, doi:https://doi.org/10.1016/S0031-3203(96) 00142-2.
- D. Su, X. Zhang, K. He, Y. Chen, “Use of machine learning ap- proach to predict depression in the elderly in china: A longitudinal study”, Journal of Affective Disorders, vol. 282, pp. 289–298, 2021, doi: 10.1016/j.jad.2020.12.160.
- C. W. Choi J, Choi J, “redicting depression among community residing older adults: A use of machine learning approch”, 2018.
- H. Jin, S. Wu, P. Di Capua, “Development of a clinical forecasting model to predict comorbid depression among diabetes patients and an application in depression screening policy making”, Preventing Chronic Disease, vol. 12, p. E142, 2015, doi:10.5888/pcd12.150047.
- A. Sau, I. Bhakta, “Artificial neural network (ann) model to predict depression among geriatric population at a slum in kolkata, india”, Journal of Clinical and Diagnostic Research, vol. 11, pp. VC01–VC04, 2017, doi:10.7860/JCDR/2017/23656.9762.
- A. Sharma, W. Verbeke, “Improving diagnosis of depression with xgboost machine learning model and a large biomarkers dutch dataset (n = 11,081)”, Frontiers in Big Data, vol. 3, 2020, doi: 10.3389/fdata.2020.00015.
- S.-E. Cho, Z. W. Geem, K.-S. Na, “Predicting depression in community dwellers using a machine learning algorithm”, Diagnostics, vol. 11, p. 1429, 2021, doi:10.3390/diagnostics11081429.
- E. Victor, Z. M. Aghajan, A. Sewart, R. Christian, “Detecting depres- sion using a framework combining deep multimodal neural networks t automated evaluation”, Psychological Assessment,
1, 2019, doi:10.1037/pas0000724. - J. Dipnall, J. Pasco, M. Berk, L. Williams, S. Dodd, F. Jacka, “Into the bowels of depression: Unravelling medical symptoms associated with depression by applying machine-learning techniques to a community based population sample”, PLOS ONE, vol. 11, p. e0167055, 2016, doi:10.1371/journal.pone.0167055.
- M. Zulfiker, N. Ety, A. A. Biswas, T. Nazneen, M. Uddin, “An in-depth analysis of machine learning approaches to predict depression”, Current Research in Behavioral Sciences, vol. 2, p. 100044, 2021, doi: 10.1016/j.crbeha.2021.100044.
- K. Vaishnavi, U. N. Kamath, B. A. Rao, N. V. S. Reddy, “Predicting mental health illness using machine learning algorithms”, Journal nce Series, vol. 2161, no. 1, p. 012021, 2022, doi:
88/1742-6596/2161/1/012021.