Impact Analysis of Duck Curve Phenomena with Renewable Energies and Storage Technologies

(This article belongs to the Special Issue on Special Issue on Multidisciplinary Sciences and Advanced Technology 2022 and the Section Electrical Engineering (ELE))
Export Citations
Cite
Pitra, G. M. and Musti, K. S. S. (2022). Impact Analysis of Duck Curve Phenomena with Renewable Energies and Storage Technologies. Journal of Engineering Research and Sciences, 1(5), 52–60. https://doi.org/10.55708/js0105006
Giovani Manuel Pitra and Kameswara Subrahmanya Sastry Musti. "Impact Analysis of Duck Curve Phenomena with Renewable Energies and Storage Technologies." Journal of Engineering Research and Sciences 1, no. 5 (May 2022): 52–60. https://doi.org/10.55708/js0105006
G.M. Pitra and K.S.S. Musti, "Impact Analysis of Duck Curve Phenomena with Renewable Energies and Storage Technologies," Journal of Engineering Research and Sciences, vol. 1, no. 5, pp. 52–60, May. 2022, doi: 10.55708/js0105006.
When higher quantities of solar energy is injected into power grid, then it is likely to result in what is known as “Duck curve phenomena”. The net load under this phenomenon is negative and thus energy generation needs to be curtailed during the peak hours and also a part of the load during off-peak hours cannot be met. Due to several economical and technical challenges, the environmentally friendly solar energy source will be switched-off during the peak hours. Analyzing the impact of duck curve on a system can be challenging. This paper presents a novel methodology to analyze the duck curve phenomena and to mitigate its effects. The proposed methodology requires two popular, open source software tools – IRENA FlexTool and System Advisory Model (SAM). SAM is used to obtain the data for solar energy production and FlexTool is used carryout the optimal energy dispatch. A 4-bus power system is considered with base load plants, renewable energy sources and energy storage facilities. Then the proposed methodology is applied on this system to analyze the impact of duck curve to demonstrate the effectiveness of both the methodology and the open-source tools.
1. Introduction
The phenomenal rise of renewable energy technologies (RETs) has resulted in large volumes of capacity addition in solar and wind segments, specifically due to their environmental friendliness and lower production costs [1, 2]. In addition, there are several other classes of energies such as Pumped Hydro Storage (PHS) systems, Concentrating Solar Power (CSP) plants at the grid level and also other resources such as biomass and roof-top solar systems [3, 4, 5, 6]. Though such RETs reduce stress on generating plants, these energy sources are intermittent in nature and thus create challenges with traditional load dispatch methodologies [2, 5]. Usually, optimal dispatch is done among fossil fuel based energies and hydro power stations [7, 8]. However, this has changed as it is now common to use solar energy to meet the peak demand.
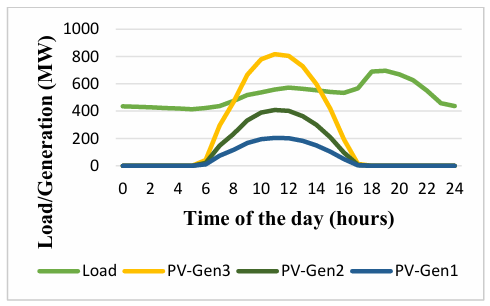
Higher capacities of solar power plants result in excess energy generated and this in turn results in negative load conditions since supply can be far greater than the load. This results in the formation of duck curve pattern or phenomena. This phenomenon is normally illustrated with plots of load, generation and net load over a day and a pattern resembling a duck can be seen. Figures 1 and 2 show how the increasing solar PV generation in the grid results in the formation of the duck curve.
In figure 1, one can clearly see an ideal generation profile of a typical solar power plant and where it fits within a typical load curve [3. 6].
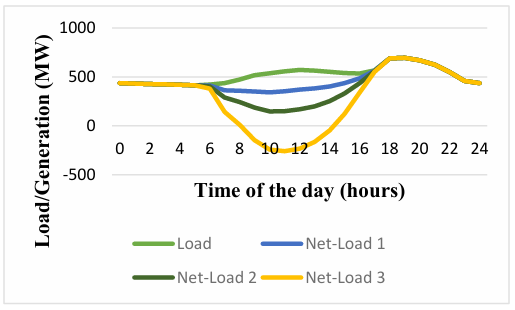
At the same time, it can be observed that the solar PV generation profile is advantageous to the grid as it starts ramping up at a time adjacent to that of the first increase in demand of the day. This is beneficial to the grid as it reduces the ramping requirements and the overall power supplied by the conventional power plants at that time [8]. Figure 2 illustrates this decrease in dependency from conventional power plants to supply power during the first increase in demand of the day, as the solar PV generation increases [1, 8, 9]. Figure 2 also shows the drawbacks that come with increasing solar PV generation in the grid, in that its sun-dependent power starts ramping down at a time when demand is increasing, adding a lot of stress to the conventional power plants in the grid [1, 7]. In other words, as the PV generation increases, the ramping demand on conventional power plants increases, requiring the conventional power plants to supply more power in a shorter period of time [1, 6]. In summary, it is the plot of net load, that is referred to as the duck curve as shown in figure 2. It is clear that the excess energy region of the duck curve needs to be reduced or flattened [3, 6, 8].
As shown in the figures 1 and 2, higher capacities of solar energy decrease the net load during peak hours. This in turn requires reduction (or curtailment) of energy injection into the grid. Since conventional base load plants are designed to operate continuously, it is not possible to shut those generating units [9]. However, this excess energy can be stored for later use in PHP and/or battery storage systems [10].
Energy adequacy is essential in the operation of any power system as almost 15% to 20% energy is lost in terms of transmission and distribution losses put together. And modern smart cities on the load side and RETs on the generation do contribute to power quality issues [2, 4]. Also interconnections between RETs, main grid and consumers also increase the system complexity [4, 11] due to varying network topology and switching. This leads to several challenges with metering [11, 12], power system protection [13, 14] and even power quality [14, 15]. If such challenges are not effectively addressed, then users experience outages and this results in loss of revenue to utility [11, 12].
It is interesting to note that duck curve is the result of excess energy, but it is only temporary during peak hours. This requires a smart and flexible power system so that necessary adjustments can be done dynamically. It can be seen that duck curve phenomenon requires utility engineers to manage the energy resources differently to avoid large curtailments. Capacity planning studies may not be able to accommodate more solar energy addition beyond a point as this will pose financial risks to the IPP as the grid is not in a position to absorb their energy. To determine these aspects, a series of simulations have to be carried out to determine the possible solutions. However, there is no specific approach or methodology suggested by anyone thus far and this paper takes this up as its main objective.
2. Literature Review
Integration of high levels of solar PV power to the electric grid comes with problems other than those related to the duck curve [1, 3, 6]. Power quality for instance, is greatly affected because of the current harmonics caused by the inverters in the system, which convert the DC power from the solar panels to AC power that is supplied to the grid [2, 16]. It is illustrated design requirements of solar systems to mitigate these harmonics, with appropriate filters [16]. However, such infrastructure can incur additional costs and may not entirely address the duck curve problem [17]. Transportation of this excess energy to the region where it is more demanded, is again another challenge due to the losses involved. One of most common misunderstandings is that solar energy is cheaper and large quantities can be added to regular power grids. Duck curve phenomena is reported first time, with a lot of details by a California Independent System operator (CAISO) [2]. Then a good number of authors have presented simulations and mitigating techniques over the years [1, 6, 8, 18]. In reality, high levels of energy penetration into an existing system can lead to excessive system losses and thus thermal limits of the transmission lines can be violated and also leads to complaints from consumers [11, 12].
Due to decreasing trends of over costs, utilities have injected large amounts of solar energy into the grid over the last decade. Naturally duck curve phenomena has been observed in several places though it is first reported by the system operator from California [2]. In the case of California, the operator was forced to curtail large volumes of solar energy as generation exceeded the load. Following this, different mitigation techniques have been reported as well, primarily addressing the issues of ramping and excess generation. These approaches included changing the tilt angles of solar panels [6, 19] and also using different types of energy storage systems [8, 10, 20, 21]; and Demand Side Management (DSM) methods [9, 22]. DSM methods generally include using alternative sources of energies, such as solar water heaters and biomass briquettes [9, 16, 20]. It should be noted that not all such options may be very well accepted by modern environments and communities from the smart cities [12, 21, 22].
Due to the popularity of renewable energies and DSM methods, policies of various states across the globe have openly encouraged consumers to add solar PV on their roof-tops and liberal incentives are given for circular economy practices [9, 18, 21]. However, the conventional energy audits may not very well capture such variations in energy consumption patterns, and this creates a disconnect between capacity addition and load estimation studies [22, 23]. Quantification of demand response needs to be done dynamically and results should be fed to capacity expansion plans [9, 22]. Some energy policy initiatives such as the Single Buyer Model (SBM) can also influence the duck curve. In [18], the authors analyzed the impact of excess energy conditions when power is traded between grid connected IPPs and SBMs. In addition to IPPs, most industrial and commercial establishments (prosumers) produce their own solar energy in smart city and/or circular economy zones during the same peak hours. These factors result in steeper duck curve and naturally, solar farms need to be disconnected, as they do not have ramping up/ down problems [24, 25].
Economic dispatch and unit commitment become challenging under excess energy conditions as fossil fuel-based energy sources cannot be stopped quickly due to ramp-up/down parameters, spinning reserves, crew constraints, fuel cost constraints etc. [1, 2, 6, 24, 25]. Since solar energy is not affected by such parameters, energy curtailment is forced on solar farms. This leads to financial losses to the IPPs that have invested in solar segment. This warrants the use of specialized computational tools for unit commitment and economic dispatch with additional constraints since dispatch is now required to be computed almost hourly basis. To accomplish this, researchers and engineers have used different software solutions such as AMPL and CPLEX [7], SAM, PLEXOS [5, 18], BEopt [15, 17] and MATLAB [3, 5, 22, 24].
Now it is clear that there are different software solutions to deal with energy dispatch with solar energy injections. However, input data requirements of these tools vary widely. The most common data input being the load and generation profiles, local weather conditions with forecasts. However, load data estimation can be challenging. Firstly, load is continuously changing over the day and is so over the months in a year. Load also changes over the years due to natural growth of the dwellings. Though several studies and field projects point to the need for using the information systems [26], typical system simulations need to be carefully adjusted based on assumptions and projections about the load.
Although a good number of works have analyzed the duck curve phenomena, reduction of energy curtailment and cost effectiveness are not very well treated, specifically with CSP and a PHS plant [7, 8, 10, 18, 24, 27]. Though these storage technologies have their own pros and cons, scientific investigations need to be carried out in a systematic manner. Basically, such investigations need to determine how flexible is the overall system, how well the load is met without having to curtail the load or generation [15, 28]. In reality, the generation resources are in different locations geographically, but connected to the grid [29]. Thus far research on the duck curve did not take the distance parameter into consideration. However, such consideration requires GIS based tools [29].
Another challenge is the availability of simple and cost-effective software tools. Analysis of duck curve requires appropriate software tools that can support varying scenarios of energy productions and load profiles. A few works have used commercial software tools to simulate duck curve phenomenon [3, 18]. This paper addresses these gaps by undertaking a series of simulations with CSP and PHS facilities added to the grid under higher levels of solar penetration, with open-source software tools SAM and IRENA FlexTool.
To accomplish this, the reminder of this paper is divided into five sections. Proposed methodology is provided in section 3. Four different case studies and results are provided in sections 4, 5, 6 and 7. Section 8 presents the discussions and finally section 9 provides the conclusion.
3. Proposed Methodology
3.1. Simulation Process
Given that an electric utility intended to integrate high levels of PV power in a grid dominated by conventional power plants, a study would have to be conducted in the following manner:
- Identification of the sites available – exposed to the highest global horizontal irradiance (GHI), and closest to the regions with the greatest demand of electrical power, to minimize transmission losses.
- Design and modelling of the prospective PV plants in the respective sites identified, with the relevant weather data, using a software of choice. This needs to be done to extract the possible electrical power generation data necessary to model the electric grid including the PV plants to be integrated.
- Gathering of information regarding the conventional power plants connected to the grid – their generation capacity, ramping capacity, minimum-up time, and minimum-down time, as well as all associated costs of interest. This information is particularly important during the modelling process as it will show how the grid will react after the integration of PV power plants in the system, that is, how much PV power it would be able to accommodate and how much would have to be curtailed.
- After obtaining the data from steps 2 and 3, one can proceed to the modelling stage, where the data obtained in the stages mentioned above is used to create a model or representation of the electric grid including the PV plants, using a software of choice. With this model, one would be able to predict how the electric grid would react with the addition of PV plants and decide whether duck curve solutions would need to be implemented or not. Given that the integration of the PV plants would result in duck curve problems, another study would have to be conducted to find out the duck curve solutions that would be feasible within that area. As it is known, solutions such as the addition of battery storage technology may be implemented anywhere, but PHS is limited by geographical features [10, 8]. The execution of this process may be possible but not limited to the utilization of tools such as System Advisor Model and IRENA FlexTool. Subsections 3.2 and 3.3 explain how these individual software tools were utilized, the inputs and outputs, and why these tools were needed to meet the objectives of this work. Steps 5 to 8 describe the process of obtaining the most suitable solution to minimize or irradicate all duck problems.
- Development of a list of feasible duck curve solutions based on the geographical characteristics of the power system.
- Modelling of the feasible solutions, whether energy storage technology based, or DSM based, considering all the necessary investment cost, as well as the social and environmental aspects.
- Simulation of the power system including the PV plants and duck curve solution, to observed how the solution considered affects the curtailed energy and unserved load due to ramping requirements.
- Repeat step 7 for all feasible solutions, then choose the one that best suits the utility goals.
3.2. IRENA FlexTool
IRENA FlexTool is a spreadsheet based solution developed by the International Renewable Energy Agency (IRENA) to aid energy planners, utility engineers, and policy makers simulate various scenarios of future power systems, when planning to implement new power plants and/or transmission lines or increase the capacity of the same. Unlike other tools used by the same entities to perform the same simulations, FlexTool is open-source and its results have been benchmarked with highly recognized tools such as PLEXOS [2, 6, 20].
In this work, IRENA FlexTool was used to simulate the unit commitment of all the plants in the system considered, to obtain the resultant operational costs, CO2 emissions, unserved demand due to ramping requirements, and curtailed energy. Data such as minimum load capacity, minimum-up time, minimum-down time, ramp-up and ramp-down capacity per unit per minute, forecasted load and RET generation data, are provided as inputs to the tool.
3.3. System Advisor Model
System Advisor Model (SAM) is software developed by the National Renewable Energy Laboratory (NREL). SAM is used to design or model renewable energy based electric systems such as solar PV, Concentrating Solar Power, Wind, Geothermal, and Biomass plants just to mention a few. The software supports various performance and financial models. It takes as input various design parameters which are system specific as well as the relevant weather data which is typical for RETs. In this work, SAM was used to model the solar PV power plants.
Modelling the solar PV power plants in SAM was necessary to obtain the generation profile data of that plant. This data was purposefully obtained to simulate the effect of integrating high levels of PV power in the system. Similarly, SAM could have also been used to model the concentrating solar power plant so as to obtain the generation profile data of that plant, but that was not necessary a that data was already available.
To demonstrate how the proposed methodology may be applied, this work considers four case scenarios, where the first one involves analyzing the behavior of the power system considered before the integration of RETs, the second one involves studying how the addition of PV power results in duck curve problems, and the third and fourth case studies analyze the effectiveness of using PHS and CSP plants respectively, as a solution to the duck curve problems in case 2.
4. Case Scenario 1
A description of the power system considered for analysis is given in this section. This includes the specifications of each plant in the system, that is, the minimum load capacity, minimum-up time, minimum-down time, ramp-up and ramp-down capacity per unit per minute of each plant, the interconnections of the system on a regional basis, and the capacity of the transmission lines. Simulations were performed to obtain the parameters of interest before implementing RETs.
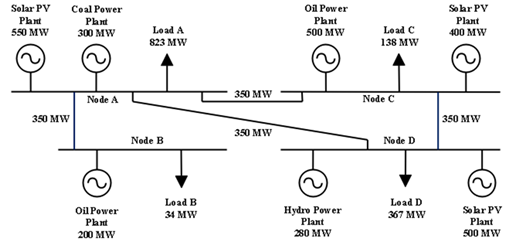
This case was used to evaluate the performance of the power system before the possible integration of RETs. Figure 3 illustrates the power system considered. This figure also shows the nodes that refer to the different regions in any specific country. For clarity, the notation in this paper is same as that is normally used in IRENA FlexTool. Thus it will provide seamless learning for the prospective users of our approach and the IRENA FlexTool [22]. Each transmission line has maximum capacity of 350 MW, which limits the flow of power between the different regions to that value. Although only the maximum load in each node shown in figure 3, the daily load data for each node is available for a period of one year in intervals of one hour and was supplied to IRENA FlexTool for simulation purpose [9, 22]. Figure 3 also shows the capacity of each power plant connected to the power system.
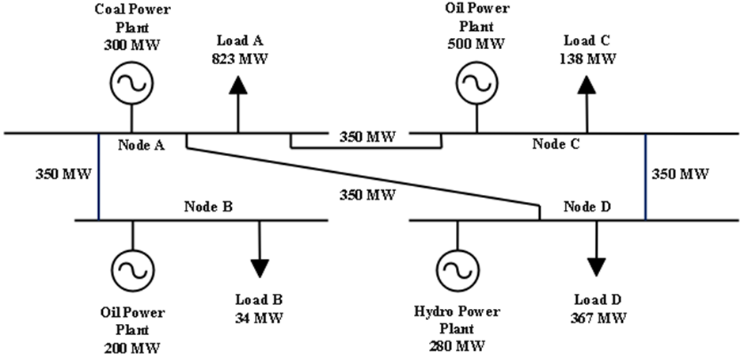
Table 1 contains the specifications of each power plant shown in figure 3. Quantities such as efficiency and minimum load are given in per unit. The ramping demand is given in per unit per minute, the minimum up/down time is given in hours, and the storage capacity in MWh. These parameters are used by FlexTool to compute the optimum commitment of all the units in the system.
Table 1: Power Plant Parameters
Unit | Efficiency | Minimum Load | Ramping | O&M Costs/MWh | Start-up Cost | Minimum Up/Down Time | Storage |
ST-Coal | 0.28 | 0.4 | 0.02 | 4.0 | 2.0 | 12 | 0 |
CC-Oil | 0.40 | 0.5 | 0.05 | 2.5 | 1.0 | 5 | 0 |
Hydro-ROR | 1.0 | 0.0 | 0.20 | 0.0 | 0.0 | 0 | 0 |
Hydro-RES | 1.0 | 0.0 | 0.20 | 0.0 | 0.0 | 0 | 26880 |
PV | 1.0 | 0.0 | 1.00 | 0.0 | 0.0 | 0 | 0 |
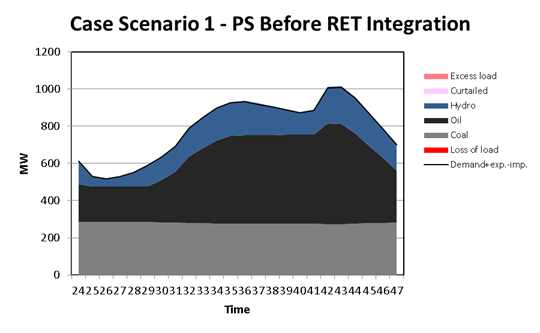
In this system, the coal-fired plant operates as the base load power plant, while the oil-fired and hydro run-of-river (ROR) plants operate as intermediate, and the hydro reservoir (RES) operates as a peaker plant.
Additionally, the fuel costs for the coal and oil are given as 10 USD/MWh and 45 USD/MWh respectively. FlexTool utilizes these costs to calculate the total cost for running these plants, in addition to the maintenance and startup costs. The simulations performed in FlexTool resulted in the following annual per cent utilization: 92.31% ST-Coal, 70.71% CC-Oil, 62.05% Hydro-ROR, and 73.14% Hydro-RES.
This led to a total cost of USD 1996.98 million per year (including operational and penalty costs), and a total carbon dioxide (CO2) emission of 4.632 million tons. The annualized unserved demand was 136.494 GWh where only 52.577 MWh were caused by the upward ramp limitations. The total cost added up to USD 1996.98 million. Figure 4 shows how each plant was committed to supply the demanded power in a day.
5. Case Scenario 2
Figure 5 illustrates how the system changes after the integration of solar PV plants. The figure shows that these PV plants are connected to nodes A, C, and D, and have capacities of 550 MW, 400 MW, and 500 MW respectively. It is assumed that these plants are added to the system to reduce the amount of unserved demand and the CO2 emissions.
Simulations were conducted to find out how the addition of these plants influence the operation of the other plants in the system. The output power of a solar PV plant is location dependent, thus, SAM was used to model this system. In SAM, the performance model Photovoltaic-PVWatts with no financial consideration was chosen, then the following steps were taken to design the system:
- The weather file of a random location in the southern hemisphere was chosen and input in the location and resource page.
- The system nameplate capacity, type of module, dc-to-ac ratio, rated inverter size, and inverter efficiency were input in the system parameter section under the system design page.
- Still in the system design page, an azimuth of zero was chosen so that the panels face true north, and a tilt angle of 35 degrees was selected for maximum energy production. Also, a typical ground coverage value of 0.4 was inserted. Next, the systems losses, which added up to 14%, were allocated.
Lastly, the simulation was run, and the system generated power output was copied to an excel file then input to IRENA FlexTool. The results obtained from FlexTool showed a decrease in CO2 emissions from 4.632 million tons to 3.622 million tons after the integration of solar energy into the system. This is due to the fact that fossil fuel-based power plant usage has reduced significantly in this case. With ST-Coal reducing by 10.47% and CC-Oil reducing by 30.59%. In figures 6, it can be seen how the addition of solar PV plants in the grid changed the system generation profile in a daily basis.
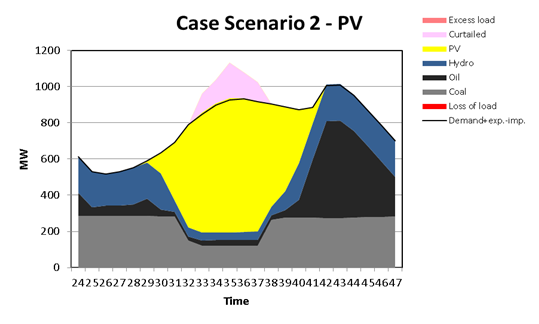
No significant change was observed from the Hydro-ROR and Hydro-RES plants results in terms of percent utilization. The total cost reduced to USD 1005.55 million, that is due to the reduction in penalty and operational costs. as the share of unserved energy decreased from 136.494 GWh to 65.210 GWh and the operation of Solar PV plants is less costly compared to the fossil fuel counterparts.
From the simulation results in FlexTool it was observed that the integration of the solar PV plants led to a annualized energy curtailment of 326.444 GWh, about 12.522 GWh were curtailed to decrease downward ramp so that rest of the system manages to ramp up, and 6.119 GWh were unserved because of the upward ramp limitations. These features show the effects of the duck curve when higher quantities of solar power are added to the grid.
6. Case Scenario 3
The application of PHS technology as a solution to the duck curve is explained in this section. Background is given on the significance of the technology today as compared to when it was first implemented, then the modelling process and simulation results pertaining this work are explained. PHS plants are not a new technology, they have been used since 1907 and their application today is not so different to their application back then. They are now gaining more attention as the world aims to reduce greenhouse gas emissions because they can store large quantities of power which is needed to compensate for the intermittent nature of RETs.
Unlike shifting the load through DSM which requires that the consumer actively participate in the transition from fossil-fuel based to RET, PHS allows this transition to happen without the consumer even noticing. It is well known that before the need for transitioning to RETs, PHS technologies would mostly be charged (or store water at the upper reservoir) using low-cost excess energy available during low demand periods and that this excess energy would be supplied from fossil-fuel-based power plants, but with the addition of solar PV plants in the grid the excess energy come from the PV plant, allowing the charging process of the PHS plant to be environmentally friendly. This paper aims to analyze the performance of the PHS plant as a solution to the duck curve, when compared to the other solutions considered.
Modelling process for the PHS plant was all done on the IRENA FlexTool so that it can be utilized in simulation process of the duck curve. FlexTool caters for all the parameters of interest for this project, thus its sole utilization for the modelling and simulation was enough. Simply to deal with the amount of energy curtailed, it would be necessary that the capacity of the power plant would be as large as the amount of energy curtailed plus the energy losses in the system.
$$E_{\text{capacity}} = 9.81 \cdot \eta \cdot \rho \cdot V \cdot H \tag{1}$$
From equation (1) the basic parameters of interest which are the efficiency of energy conversion (η), density of water (ρ), volume of reservoir (V), and the difference in height between the upper and lower reservoir (H) are used to calculate the capacity of the power plant (ECAPACITY). From this list of parameters FlexTool only takes the efficiency of energy conversion (η). The other parameters are geographically dependent; hence they are not part of the scope of this project.
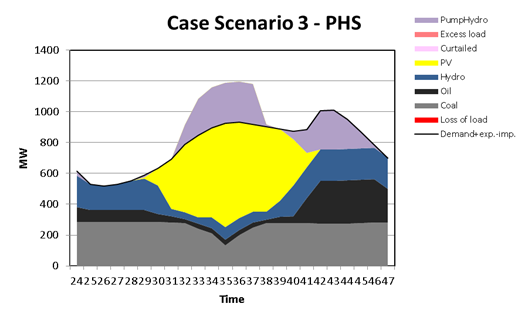
The results obtained from the simulations showed that the CO2 emissions were somewhat higher than those obtained in the second case study (section 5), as it only increased from 3.622 to 3.676 million tones. Similarly, this increase is because of the raise in the utilization of the coal-fired plant from 81.84% to 87.03%. Compared to the previous case studies (sections 5 and 6), a significant reduction in cost is observed when the PHS was implemented as a solution to the duck curve – up to USD 327.049 million. The annualized energy curtailment reduced to 90.078 GWh, and 3.042 GWh were curtailed to decrease downward ramp so that rest of the system manages to ramp up. PHS also resulted in 0 GWh of unserved demand because of the upward ramp limitations. Figure 7 shows generation profile with PHS in order to mitigate the impact of duck curve.
7. Case Scenario 4
In this section the 4th and last case study is discussed. This case study considers the integration of a CSP plant as a solution to the duck curve. Details such as its application, modelling, simulation, and results analysis are provided.
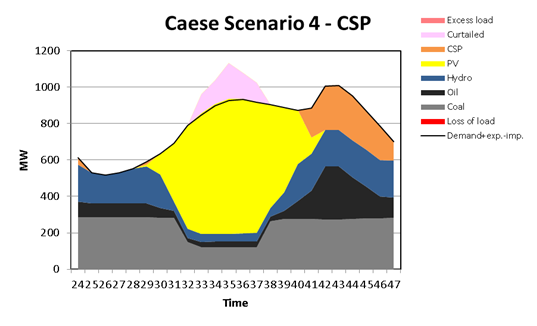
CSP plants are sometimes considered as the more convenient to harness the energy from the sun at large scale because of their ability to generate electricity and store the same in the form of heat. Compared to PHS plants, CSP plants have an advantage as they do not rely on the excess energy from other plants on the grid to store its energy. CSP plants may play different roles on the grid. In Namibia for instance, it has been estimated that CSP plants can mainly work as peakers during the rainy season, and in winter they can also support the base load power plants. Figure 9 shows generation profile with a CPS plant in order to mitigate the impact of duck curve.
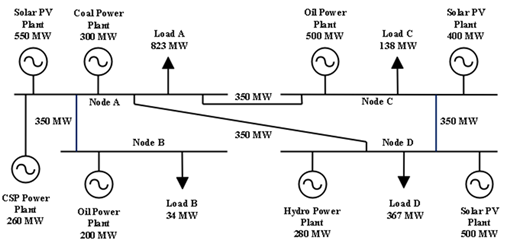
Because its energy storage works independently from the other plants in the grid, when dealing with the duck curve CSP plants do not cater for the curtailed energy caused by the minimum base load plant capacity. However, it still plays an important role because of its rapid ramping capacity, which is needed to meet the high ramping requirements left by the solar PV plant when its supply is decreasing. Thus, this rapid ramping capacity takes care of the unserved load due to ramping requirements. In this case, a 260 MW plant with a storage capacity of 2080 MWh was connected to node A as shown in figure 8. It is assumed that that region at Node A has highest Direct Normal Irradiance (DNI), hence the ideal site of installing the plant.
The simulation results indicate that the integration of the CSP plant resulted in 3.482 million tons of CO2 emissions, thus it is the case scenario with smallest amount of CO2 emissions amongst the other case scenarios. This case scenario also resulted in the lowest total cost, which was equivalent to USD 299.517 million. As expected, the annualized energy curtailed and the amount of energy needed to decrease downward ramp so that rest of the system manages to ramp up, did not change significantly compared to case scenario 2, but just like case scenario 4, this case also resulted in zero GWh of unserved demand because of the upward ramp limitations.
The effect of a typical of a typical CSP plant on the power system is illustrated in figure 9. From the same figure, one can also see that the CSP plant mainly supplies power in the second peak, hence it aids the system ramping up as the solar PV power decreases.
8. Discussion
Previous sections considered four different case studies. These studies have been carried out based on the proposed methodology using the open-source tools SAM and IRENA Flex. Thus, it is possible to use open-source tools effectively to study the duck curve phenomena. Table 2 presents the overall summary of the results obtained from these simulations. On this table only those parameters that are relevant in selecting the most suitable solution to the duck curve were presented. As it can be expected the choice of selection of the most suitable solution may be motivated by different aspects. For instance, if one were to consider the cost and the CO2 emissions as the driving factor behind the choice of selection of the best solution then, case scenario 5, where a CSP plant was implemented as a solution to the duck curve would have been the best option.
For this work, it can be observed that the choice of selecting the most suitable duck curve solution is driven by the reduction in CO2 emissions, annualized unserved energy, and annualized unserved demand due to upward ramp limitation. However, this assumes that there is a feasible site for the implementation of a PHS plant. Thus, case scenario 3 is chosen as the most suitable solution to the duck curve problem of the grid considered. Further, it can be seen that open-source tools SAM and Flex tools can be used to study duck curve phenomenon. Table 2 lists the four different cases.
Table 2: Summary of results
Case | A | B | C | D | E | F |
1 | 4.63 | 1996.9 | 136.5 | 0 | 52.57 | 0 |
2 | 3.62 | 1005.6 | 65.21 | 326.44 | 46.70 | 12.52 |
3 | 3.68 | 327.05 | 0 | 90.078 | 0 | 3.042 |
4 | 3.48 | 299.52 | 0 | 327.19 | 0 | 12.59 |
The 5 variables considered: A is CO2 Emissions (M Tons), B is Total Costs (M USD), C is Annualized Unserved Energy (GWh), D is Annualized Curtailed Energy (GWh), E is Annualized unserved demand due to upward ramp limitation (MWh)and F is Curtailed energy due to downward ramp limitations (GWh).
9. Conclusion
The overall concept of a typical duck curve phenomena and the circumstances surrounding the same have been introduced. Importantly, this paper first proposes a novel methodology using open-source software tools to simulate the duck curve and then to analyze its impact. Typical load curves have been generated with SAM to incorporate location specific load data and also solar energy generation data. This ensures that the suggested approach takes field operating conditions into consideration. Integration of CSP and PHS plants can mitigate the impact of duck curve phenomena and these cases were simulated analyzed separately on a 4-bus system. Results show that it is possible to mitigate and even eliminate solar energy curtailment with careful planning. The proposed methodology can be further used to study the duck curve in-depth with different scenarios.
- G. M. Pitra and K. S. S. Musti, “Duck Curve with Renewable Energies and Storage Technologies,” 13th International Conference on Computational Intelligence and Communication Networks (CICN), pp. 66-71, 2021, doi: 10.1109/CICN51697.2021.9574671.
- California Independent System Operator (2017), “Impacts of renewable energy on grid operations,” Folsom
- Hou, Q., Zhang, N., Du, E., Miao, M., Peng, F., & Kang, C, “Probabilistic duck curve in high PV penetration power system: Concept, modeling, and empirical analysis in China”. Applied Energy, 242(February), 205–215, 2019 doi: 10.1016/j.apenergy.2019.03.067.
- Obi, M., & Bass, R.,”Trends and challenges of grid-connected photovoltaic systems – A review”. Renewable and Sustainable Energy Reviews, 58, 1082–1094, 2016, doi: 10.1016/j.rser.2015.12.289.
- Du, E., Zhang, N., Hodge, B., Kang, C., & Kroposki, B., “Economic justification of concentrating solar power in high renewable energy penetrated power systems”, Applied Energy, pp.649-661, 222(May) 2018, doi: 10.1016/j.apenergy.2018.03.161.
- Doroshenko, M., Keshav, S., & Rosenberg, C., “Flattening the duck curve using grid-friendly solar panel orientation”. Proceedings of the 9th ACM International Conference on Future Energy Systems, 375–377, 2018, doi:10.1145/3208903.3212029.
- Kusakana, K., “Optimal scheduling for distributed hybrid system with pumped hydro storage”. Energy Conversion and Management, 111, 253–260, 2016, doi: 10.1016/j.enconman.2015.12.081.
- H. O. R. Howlader, M. Furukakoi, H. Matayoshi and T. Senjyu, “Duck curve problem solving strategies with thermal unit commitment by introducing pumped storage hydroelectricity & renewable energy,” IEEE 12th Int. Conf. (PEDS), pp. 502-506, 2017, doi: 10.1109/PEDS.2017.8289132.
- K. S. S. Musti, “Quantification of Demand Response in Smart Grids,” IEEE International Conference INDISCON, pp. 278-282, 2020, doi: 10.1109/INDISCON50162.2020.00063.
- Denholm, P., Wan, Y., Hummon, M., & Mehos, M., “The value of CSP with thermal energy storage in the western United”. Energy Procedia, 49, 1622–1631, 2014, doi: 10.1016/j.egypro.2014.03.171.
- M.K.S. Sastry, “Integrated Outage Management System: an effective solution for power utilities to address customer grievances”, Int. Journal of Electronic Customer Relationship Management, Vol. 1 No.1, pp.30 – 40, 2007, doi: 10.1504/IJECRM.2007.014424
- Yan He, Nick Jenkins, Jianzhong Wu, “Smart Metering for Outage Management of Electric Power Distribution Networks”, Energy Procedia, Vol. 103, pp. 159-164, 2016, doi: 10.1016/j.egypro.2016.11.266
- Sastry. MKS, “Simplified algorithm to determine break point relays & relay coordination based on network topology”, IEEE International Symposium on Circuits and Systems (ISCAS), pp. 772-775, 2005, doi: 10.1109/ISCAS.2005.1464702.
- Hermanus L.R. van der Walt, Ramesh C. Bansal, Raj Naidoo, “PV based distributed generation power system protection: A review”, Renewable Energy Focus, Vol. 24, pp. 33-40, 2018, doi: 10.1016/j.ref.2017.12.002.
- E. Taibi et al., “Power system flexibility for the energy transition: Part 2”, IRENA FlexTool methodology, 2018, available online.
- Hayat, M. A., Shahnia, F., & Shafiullah, G. M.,”Improving Duck Curve Profile, Enabling Peak-shaving and Increasing Self-sufficiency by Properly Designing Community Solar Projects”. 9th International Conference on Power and Energy Systems, 2019, doi: 10.1109/ICPES47639.2019.9105403.
- Sheha, M., Mohammadi, K., & Powell, K., “Solving the duck curve in a smart grid environment using a non-cooperative game theory and dynamic pricing profiles”. Energy Conversion and Management, 2020, doi: 10.1016/j.enconman.2020.113102.
- Dall, E., Muller, G. H., Bailey, F., Jagau, R., Pfohl, A. R., Swart, J., Saenz, J. M., & Caballos, S. “CSP in Namibia – Solution to the “Duck Curve”?, AIP Conference Proceedings 2126, 070001, 2019, doi:10.1063/1.5117595.
- Zhipeng Zhang, Ran Li, Chen Zhao, Furong Li, “Cross-characterization of PV and Sunshine Profiles Based on Hierarchical Classification”, Energy Procedia, Vol. 103, pp. 15-21, 2016, doi: 10.1016/j.egypro.2016.11.242
- MKS Sastry, Jacqueline Bridge, Alvin Brown, Renee Williams, “Biomass Briquettes: A Sustainable and Environment Friendly Energy Option for the Caribbean”, Fifth International Symposium on Energy, Puerto Rico Energy Center-LACCEI, February 7-8, 2013, Puerto Rico.
- K. S. Sastry Musti, “Circular Economy in Energizing Smart Cities”, Chapter in Handbook of Research on Entrepreneurship Development and Opportunities in Circular Economy, 2020, doi: 10.4018/978-1-7998-5116-5.ch013
- Kashif Javed, Haroon Ashfaq & Rajveer Singh, “Optimized Load Profile & Cost Analysis of Stand-alone Photovoltaic System for Rural Power Applications in Indian Scenario”, Smart Science, 6:3, 245-255, 2018, doi: 10.1080/23080477.2018.1466678
- Sastry Musti K.S., Paulus G.N.T., Katende J., “A Novel Framework for Energy Audit Based on Crowdsourcing Principles”, Springer, 2021, doi: 10.1007/978-3-030-77841-5_11.
- H. O. R. Howlader, M. M. Sediqi, A. M. Ibrahimi and T. Senjyu, “Optimal Thermal Unit Commitment for Solving Duck Curve Problem by Introducing CSP, PSH and Demand Response,” IEEE Access, vol. 6, pp. 4834-4844, 2018, doi: 10.1109/ACCESS.2018.2790967.
- Haberschusz, D., Kairies, K. P., Wessels, O., Magnor, D., & Sauer, D. U., “Are PV Battery Systems Causing Ramping Problems in the German Power Grid? ” Energy Procedia, 135, 424–433, 2017, doi: 10.1016/j.egypro.2017.09.512.
- K. S. Sastry Musti, Helvi Iileka, Fenni Shidhika, “Industry 4.0 Based Enterprise Information System for Demand-Side Management and Energy Efficiency”, Chapter in Novel Approaches to Information Systems Design, 2020, doi: 10.4018/978-1-7998-2975-1.ch007.
- Šćekić, L., Mujović, S., & Radulović, V., “Pumped hydroelectric energy storage as a facilitator of renewable energy in liberalized electricity market”. Energies, 13(22), 2020, doi: 10.3390/en13226076.
- E. Taibi, C. Fernandez, L. Gutierrez, J. Kiviluoma, and T. J. Lindroos, “Colombia power system flexibility assessment: IRENA FlexTool case study”, October, 2018, ISBN: 978-92-9260-085-3
- M. K. S. Sastry and A. Sahadeo, “Distributed Cloud Computing Based GIS Solution for Electrical Power Utility Asset Management,” International Conference on Computational Intelligence and Communication Networks (CICN), pp. 832-838, 2015, doi: 10.1109/CICN.2015.169.
No related articles were found.