Barriers of the Green Supply Chain Management Implementation: A Benchmark of Studies of Analytic Hierarchy Process and Interpretive Structural Modeling
(This article belongs to the Special Issue on Special Issue on Multidisciplinary Sciences and Advanced Technology (SI-MSAT 2022) and the Section Green and Sustainable Science & Technology (GSS))
Export Citations
Cite
Fahmy, H. , Mazouzi, M. , Masmoudi, A. A. and Mehdi, T. E. (2022). Barriers of the Green Supply Chain Management Implementation: A Benchmark of Studies of Analytic Hierarchy Process and Interpretive Structural Modeling. Journal of Engineering Research and Sciences, 1(5), 223–230. https://doi.org/10.55708/js0105023
Hamza Fahmy, Mohamed Mazouzi, Ayoub Alami Masmoudi and Tamasna El Mehdi. "Barriers of the Green Supply Chain Management Implementation: A Benchmark of Studies of Analytic Hierarchy Process and Interpretive Structural Modeling." Journal of Engineering Research and Sciences 1, no. 5 (May 2022): 223–230. https://doi.org/10.55708/js0105023
H. Fahmy, M. Mazouzi, A.A. Masmoudi and T.E. Mehdi, "Barriers of the Green Supply Chain Management Implementation: A Benchmark of Studies of Analytic Hierarchy Process and Interpretive Structural Modeling," Journal of Engineering Research and Sciences, vol. 1, no. 5, pp. 223–230, May. 2022, doi: 10.55708/js0105023.
Because firms are considering the influence of their operations on the environment, the green supply chain has become a crucial indication of corporate performance. The issues here necessitate both competent management and a fresh, innovative strategy for cost reduction, productivity enhancement, and natural resource protection. We shall try to understand the Barriers of Green Supply Chain Management concept in this report. A total of 47 obstacles were discovered after a thorough review of the literature. Priority ranking stability is investigated via a sensitivity analysis. Using existing models have mostly focused on identifying these constraints.
1. Introduction
In recent years, ecological hardship and devastation have drawn attention to the negative repercussions of human activities. Green supply chain practices are gaining traction in today’s manufacturing environment. Natural resource depletion, rising consumer demands for quality and quantity, tight regulations, and cost reduction are all issues we face. On the other side, environmental protection by the government and the general population is a significant problem and hardship. As a result, the GSCM, or “Green Supply Chain Management,” addresses the environmental conundrum, which illustrates the absorption of environmental issues into traditional SCM, or “Supply Chain Management,” on many levels. GSCM is essential for decreasing a manufacturing facility’s total negative environmental impact. Green values can be included into everyday supply chain operations [1]. Nonetheless, the benefits of the GSCM in the sector, as well as the adoption of the Green ideology, will pose a slew of issues for businesses. The difficulties, referred to as problems encountered throughout GSCM’s employment, are classified into five categories: subcontracting, technology, information, financial, engaging, and supporting.
The following is how this paper is made: A literature overview of GSCM obstacles is presented in Section 2. part 3: a list of all the barriers that we were able to get from the studies Section 4 discusses the study’s solution method, which represents the two solutions that we will focus on: the ISM and the AHP. Finally, section 5 summarizes the study’s findings and makes recommendations for further research [2].
2. Literature review and background.
Despite the benefits and relevance of the GSCM for our company and future, businesses may face challenges in implementing the Green idea. Obstacles experienced during GSCM’s time on the job.
Many scholars conducted a literature review, according to which [3–5] . The hurdles to GSCM are divided into five categories:
- Inadequate technology and facilities.
- A lack of awareness and assistance.
- Administration and activity policies that are not supportive.
- Economic problems.
- Outsourcing.
Table 1: Some existing works on green supply chain barriers analysis [2]
Authors | Nature of contribution |
[6] | Lessons from the public and private sectors on the drivers and impediments to environmental supply chain management techniques. |
[7] | From an Indian viewpoint, the barriers to implementing green supply chain management employing interpretative structural modeling methodologies in the car sector. |
[8] | Modeling the Information Sharing Barriers with an ISM framework. |
[9] | The drivers and roadblocks to implementing green supply chain management in Mozambique’s industrial industry. |
[10] | A Complete Interpretive Systemic Modeling Approach to Flexible Green Supply Chain Management Opportunities and Barriers |
[11] | Multi-objective sustainable and green closed loop Network architecture of a fuzzy supply chain. |
[12] | Definition and Challenges of Green Supply Chain Management, as well as Literature Analysis During Implementation |
[1] | An instance of an emerging economy’s assessment of impediments to green supply chain management application |
[13] | An exploratory investigation of Chinese SMEs in terms of integrating sustainable, operationally successful supply chain techniques. |
3. The list of the barriers in GSCM
Based on literature surveys and research conducted [14], 47 obstacles were discovered and categorised based on their context and similarities throughout this study. Table 2 lists the sources of source barriers.:
Table 2: List of barriers [14]
Outsourcing | 1. A concern for environmental suppliers’ preservation. |
2. Difficulty in calculating and recording suppliers’ environmental practices. | |
3. There is no environmental interaction between the supplier and the environment. | |
4. Goods and rules may collide in the future. | |
5. The government’s lack of support for environmentally friendly initiatives. | |
6. There is no suitable training or reward structure in place for vendors. | |
Inadequate technology and facilities. | 7. Don’t be frightened to fail. |
8. A lack of successful environmental policies. | |
9. Humans are not supported. | |
10. Difficulty in putting one’s optimistic outlook on the world into action. | |
11. In terms of professional experience, there is a dearth of it. | |
12. Difficulty in reusing/recycling used things. | |
13. Use feature complexity to reduce resource/energy consumption. | |
14. There isn’t enough flexibility in current practice to switch to a new method. | |
15. A scarcity of new items, technologies, and procedures. | |
A lack of awareness and assistance. | 16. A lack of awareness about the implementation of reverse logistics. |
17. Lack of belief in the benefits of climate change. | |
18. Perception of a’responsibility-free zone.’ | |
19. Finding opportunities for the environment is difficult. | |
20. A lack of eco-literacy among supply chain members. | |
Inadequate environmental awareness is number twenty-one. | |
22. Practitioners’ lack of visibility in the green system. | |
23. Difficulty in determining third-party remembrance of used products. | |
24. There are no explicit environmental goals. | |
25. Collecting information on future climate changes is difficult. | |
26. Reluctance to convert to new systems due to fear or apprehension. | |
Economic problems. | 27. A strong investment with a low investment-to-return ratio. |
Expenses for the collection of used things (number 28). | |
29. The cost of environmentally friendly packaging. | |
30. Inability to obtain bank loans to facilitate processes or purchase green items. | |
31. The inventory of hazardous materials poses a risk. | |
Finance’s contradictions number 32. | |
33. The requirement for additional human characteristics | |
The high expense of hazardous waste disposal. | |
35. The cost of migrating to a new system. | |
Administration and activity policies that are not supportive. | 36. A lack of industry-specific training courses, consulting firms, and organizations to prepare, monitor, and mentor advancement. |
37. GSCM pressure and a lack of consumer awareness. | |
38. A lack of corporate social responsibility. | |
39. There is little interest in climate-related initiatives or meetings. | |
40. Business rules that discourage product/process stewardship. | |
41. Poor supplier engagement/reluctance to share information. | |
42. Inadequate coordination of interdepartmental communication. | |
43. A lack of enthusiasm on the part of upper management in implementing green supply chain management. | |
44. A lack of understanding of the company’s environmental impact. | |
45. Inadequate management space. | |
46. In the corporate world, there is a lot of competition and a lot of misunderstanding. | |
47. A lack of support and guidance from regulatory authorities. |
4. Solution methods
4.1. Interpretive structural modeling:
ISM (Interpretive Structural Modeling) is a tool for assessing the relationship between specific elements that define a problem or issue. It was first created in the 1970s. [15], [16]. ISM is interpretive since the choice of group for analysis determines if and how the variables are linked.[17] These ISM modeling phases are depicted in Figure 1.
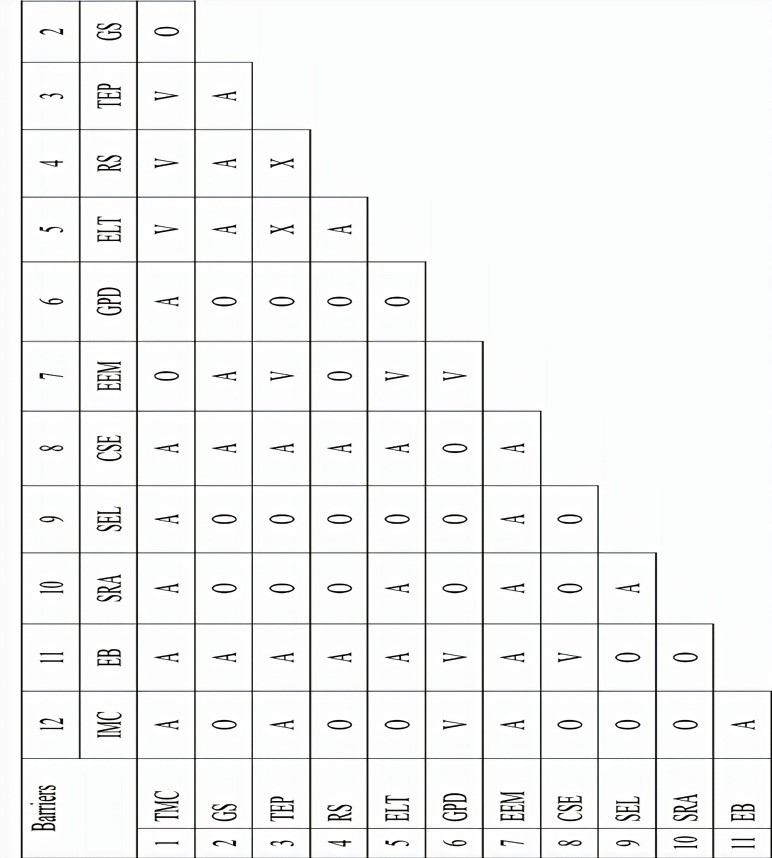
Table 3: Top 12 barriers of green textile supply chain [13]
1 Absence of a Supplier Incentive Program (RS) |
2 There is a scarcity of eco-literacy and training (ELT) |
3 The Green Method and the Complexity of System Design (GPD) |
4 Noncompliance with regulatory requirements (SEL) |
5 A lack of commitment to the top management (TMC) |
6 A scarcity of green providers (GS) |
7 Regulatory agencies provide insufficient direction and assistance (SRA) |
8 Significant installation and maintenance costs (IMC) |
9 There are no economic benefits (EB) |
10 Customer support and motivation are lacking (CSE) |
11 Between supply chain participants, there is a lack of trust and environmental coordination (TEP) |
12 There aren’t enough climate protections in place (EEM) |
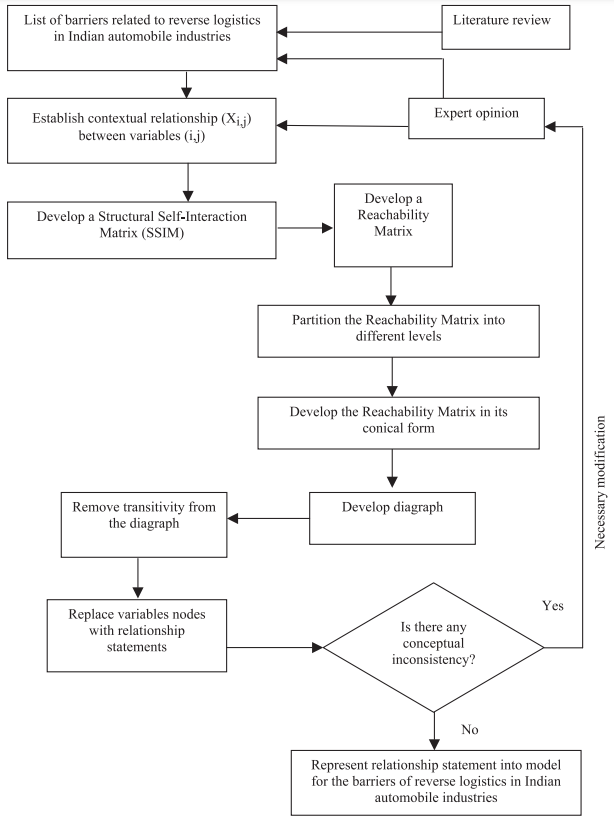
- Stage 1: Variables that impact the system: barriers (Table 2)
- Stage 2: With the most experienced supply chain managers and corporate executives, a group investigation is conducted to identify the most prominent barriers and establish a short list for the ISM study based on the hurdles highlighted in phase 1:
Example of case study of textile in South-east Asia [13]:
- Stage 3 : The formation of the structural self-interaction matrix is the first stage of the ISM (SSIM). Between either of the two obstacles I and j) and the related relationship path, contextual relationships were tested. Four symbols were utilized to represent the orientation of the relationship between two barriers (I and j) .:
- V: Barrier I has an impact on Barrier J.
- A: Barrier J has an impact on Barrier I .
- X: I and j are barriers that impact each other.
- O: The I and j barriers have nothing to do with each other.
- Stage 4: The SSIM has developed an accessibility matrix that has been tested for transitivity. ISM makes a key assertion about the transitivity of contextual interactions. Variable A must be associated with variable C if variable B is connected with variable C. SSIM was transformed to a binary matrix called the Initial Reachability Matrix by replacing V, A, X, and O with 1 or 0 and implementing the following principles. o If the SSIM entry I j) is V, the entries I j) and (j, I become 1 and 0, respectively.
o If the SSIM entry (I J) is A, the entries (I J) and (J, I) become 0 and 1, respectively.
o If the SSIM entry (I J) is X, then both (I J) and (J I) become 1.
o If the SSIM entry (I J) is O, then both (I J) and (J, I become 0.
Table 4: Reachability matrix [13]
TMC | GS | TEP | RS | ELT | GPD | EEM | CSE | SEL | SRA | EB | IMP | |
TMC | 1 | 1 | 1 | 1 | 1 | 0 | 1 | 0 | 0 | 0 | 0 | 0 |
GS | 0 | 1 | 0 | 0 | 0 | 0 | 0 | 0 | 0 | 0 | 0 | 0 |
TEP | 0 | 1 | 1 | 1 | 1 | 0 | 1 | 0 | 0 | 0 | 0 | 0 |
RS | 0 | 1 | 1 | 1 | 1 | 0 | 1 | 0 | 0 | 0 | 0 | 0 |
ELT | 0 | 1 | 0 | 0 | 0 | 0 | 1 | 0 | 0 | 0 | 0 | 0 |
GPD | 1 | 1 | 1 | 1 | 1 | 1 | 1 | 0 | 0 | 0 | 1 | 1 |
EEM | 0 | 1 | 0 | 0 | 0 | 0 | 1 | 0 | 0 | 0 | 0 | 1 |
CSE | 1 | 1 | 1 | 1 | 1 | 0 | 1 | 1 | 0 | 0 | 1 | 0 |
SEL | 1 | 1 | 1 | 1 | 1 | 0 | 1 | 0 | 1 | 0 | 0 | 0 |
SRA | 1 | 1 | 1 | 1 | 1 | 0 | 1 | 0 | 1 | 1 | 0 | 0 |
EB | 1 | 1 | 1 | 1 | 1 | 0 | 1 | 0 | 0 | 0 | 1 | 0 |
IMP | 1 | 1 | 1 | 1 | 1 | 0 | 1 | 0 | 0 | 0 | 1 | 1 |
- Stage 5 : The reachability matrix from Phase 4 was separated into many layers. The final reachability matrix’s reachability and history collection [15] For each factor, they are obtained. The intersection of the sets was then used to extract all variables. The top-level factor in the ISM hierarchy becomes the factor for which the accessibility and intersection sets are the same. [17]:
Table 5: Level partitions [13]
Barrier | Reachability set | Antecedent set | Intersection set | Level | |
1 | TCM | 1,2,3,4,5,7 | 1,6,8,9,10,11,12 | 1 | IV |
2 | GS | 2 | 1,2,3,4,5,6,7,8,9,10,11,12 | 2 | I |
3 | TEP | 2,3,4,5,7 | 1,3,4,5,6,8,9,10,11,12 | 3,4,5 | III |
4 | RS | 2,3,4,5,7 | 1,3,4,5,6,8,9,10,11,12 | 3,4,5 | III |
5 | ELT | 2.3.4.5.7 | 1.3.4.5.6.8.9.10.11.12 | 3.4.5 | III |
6 | GPD | 1.2.3.4.5.6.7.11.12 | 6 | 6 | VII |
7 | EEM | 2.7 | 1.3.4.5.6.7.8.9.10.11.12 | 7 | II |
8 | CSE | 1.2.3.4.5.7.8.11 | 8 | 8 | VI |
9 | SEL | 1.2.3.4.5.7.9 | 9.10 | 9 | V |
10 | SRA | 1.2.3.4.5.7.9.10 | 10 | 10 | VI |
11 | EB | 1.2.3.4.5.7.11 | 6.8.11.12 | 11 | V |
12 | IMC | 1.2.3.4.5.7.11.12 | 6.12 | 12 | VI |
- Step 6: Table 5’s level is utilized to generate a new digraph that contains transitivity ties that have been gained: A final digraph was constructed once the indirect connections were removed. The top level of the digraph was placed at the top. the second level at the second position. and so on until the bottom level was placed at the lowest position of the digraph.

- Stage 7: The generated diagraph is transformed into an interpretative structural model by replacing variable nodes with sentences [17].
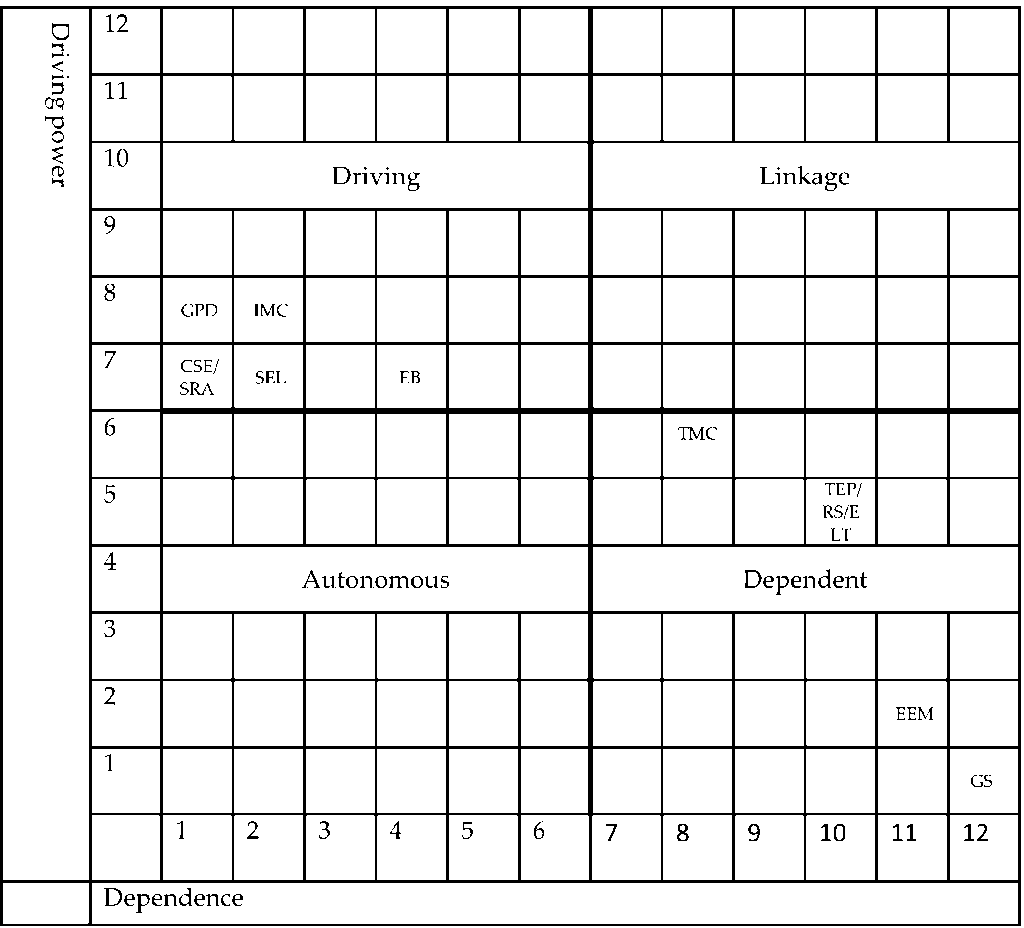
The driver’s power-dependence matrix reveals the relative importance of each aspect as well as their interdependence. Factors of Autonomy / Dependence / Driving / Linkage
4.2. Analytic Hierarchy Process
The Analytic Hierarchy Process (AHP). which rigorously delineates the complexity of the issue setting. is based on a set of assumptions. It is built on a well-defined mathematical structure of consistent matrices and the capacity to construct true or approximate right-hand weights. the eigenvector [18]. It’s a multi-criteria decision-making (MCDM) methodology that’s been successfully used to environmental challenges in recent years. This method is commonly used in the corporate world to make decisions [19].
Three criteria have been used to AHP to assure the grading of obstacles to GSCM deployment. and the findings have been reported.
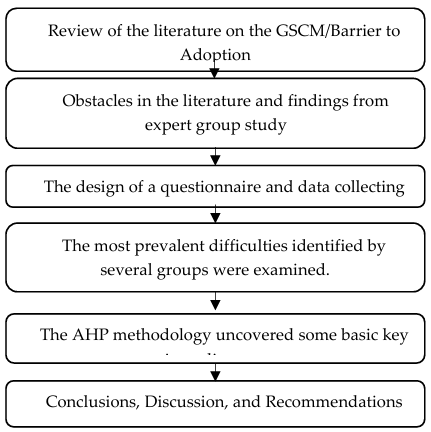
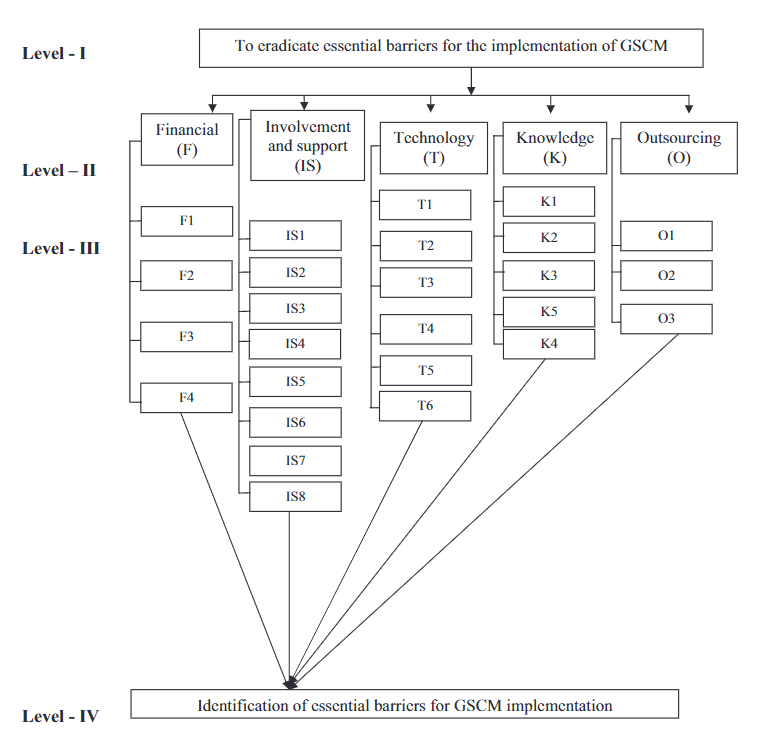
4.2.1. Identifying roadblocks and constructing a hierarchical prioritizing model. as specified in Chapter III
The common impediments are identified and escalated to a priority level of concern after the first stage. In this level Figure 6. the four-hierarchy choice process is broken down into phases:
- Level-I: The goal/general purpose.
- Level-II: This is the level reflected in the barrier group.
- Level III: This level of the system presents unique obstacles.
- Level-IV: Priorities for critical barriers are defined at this level.
4.2.2. Establish normalized weights for each barrier category and each individual barrier
We’ll need a numerical scale to do comparisons that demonstrates how much more significant or better one piece is than another in terms of the criteria or characteristic being compared against.
Table 6: Selection ratio among two components
Weights of choice | Definition | Explanation |
1 | Equally preferred | There are two procedures that lead to the same objective. |
3 | Moderately | Practice and judgment favor one behavior over another by a little margin. |
5 | Strongly | Experience and choice significantly or fundamentally favor one action over another. |
7 | Very strongly | A certain activity is greatly desired over another. and its superiority is demonstrated in practice. |
9 | Extremely | The greatest level of affirmation is the proof that favors one procedure over another. |
2.4.6.8 | Intermediate values | A balance between theabove-mentioned preferences is represented by this symbol. |
Reciprocals | Reciprocals for inverse comparison |
4.2.3. Pair-Wise Comparison Matrix Consistency Check [20]
The consistency ratio may be computed using the procedures below:
- Calculate the eigenvector or relative weights for each n-dimensional matrix.
- Compute the consistency index for each matrix of order n by the formula: CI = (λmax−n) / (n−1)
- The consistency ratio is then calculated using the formula: CR=CI/RI (random Index)
Arrange the elements in a matrix and get comments from individuals who are arguing the relative relevance of the various factors in relation to the ultimate objective of home happiness [21]. Table 6 depicts the decision-making scale to be used. This scale has been proven to be effective in a variety of applications as well as theoretical comparisons with a variety of other scales.
Table 7: Pair-by-pair comparison matrix for the barrier group [14]
O | T | K | F | IS | |
O | 1 | 0,78 | 2,73 | 0,66 | 2,48 |
T | 1,281 | 1 | 2,89 | 3,7 | 2,89 |
K | 0,3663 | 0,346 | 1 | 1,66 | 1,98 |
F | 1,5152 | 0,2703 | 0,6024 | 1 | 2,6 |
IS | 0,4032 | 0,346 | 0,5051 | 0,3846 | 1 |
SUM | 4,5676 | 2,7423 | 7,7275 | 7,4046 | 10,95 |
Table 8: Standardize matrix of barrier category
O | T | K | F | IS | Weight | |
O | 0,219 | 0,284 | 0,353 | 0,089 | 0,226 | 0,2345 |
T | 0,280 | 0,365 | 0,374 | 0,500 | 0,264 | 0,3565 |
K | 0,080 | 0,126 | 0,129 | 0,224 | 0,181 | 0,1482 |
F | 0,332 | 0,099 | 0,078 | 0,135 | 0,237 | 0,1761 |
IS | 0,088 | 0,126 | 0,065 | 0,052 | 0,091 | 0,0846 |
The weight is simply derived by dividing each value from Table 7 by the sum, yielding the standardised matrix,
To test if the measured value is right, multiply the value of the column of criterion value by the weight,
Table 9: Matrix of pair-wise comparisons multiplied by weight [14]
0,2345 | 0,3565 | 0,1482 | 0,1761 | 0,0846 | |
O | T | K | F | IS | |
O | 1*0,23 | 0,78*0,35 | 2,73*0,14 | 0,66*0,17 | 2,48*0,08 |
T | 1,2*0,23 | 1*0,35 | 2,89*0,14 | 3,70*0,17 | 2,89*0,08 |
K | 0,36*0,23 | 0,34*0,35 | 1*0,14 | 1,66*0,17 | 1,98*0,08 |
F | 1,51*0,23 | 0,27*0,35 | 0,60*0,14 | 1*0,17 | 2,6*0,08 |
IS | 0,40*0,23 | 0,34*0,35 | 0,50*0,14 | 0,38*0,17 | 1*0,08 |
Table 10 :Weighted sum value ration with Critirea value [14]
Weighted sum value | Critirea weight | Ratio |
1,243 | 0,2345 | 5,3022 |
1,981 | 0,3565 | 5,5570 |
0,817 | 0,1482 | 5,5167 |
0,937 | 0,1761 | 5,3194 |
0,445 | 0,0846 | 5,2602 |
So λ max = 5,39114602
CI = (λmax−n) / (n−1) = 0,0977865 è 0<CI<1
CR = CI/RI = 0,094732
The random index is abbreviated as RI, the random index table for up to 10 parameters was shown by the randomly produced pairwise matrix consistency index [14]:
n | 1 | 2 | 3 | 4 | 5 | 6 | 7 | 8 | 9 | 10 |
RI | 0 | 0 | 0,58 | 0,9 | 1,12 | 1,24 | 1,32 | 1,41 | 1,45 | 1,49 |
We may assume that the matrix is sufficiently consistent since CR 0,1 and then utilize the result
Table 11 : AHP weights for barrier category [14],
Class Of Barrier | Sorted weight importance |
T | 0,3566 |
O | 0,2345 |
F | 0,1762 |
K | 0,1482 |
IS | 0,0846 |
5. Conclusion
To focus on environmental challenges, manufacturing firms have lately begun to implement the green idea in their supply chain management. However, owing to the identification of impediments, the process of applying green concepts in their supply chain management was found to be extremely challenging. The goal of this study is to identify and prioritize the hurdles to implementing Green supply chain management (GSCM) using both assess the ISM and AHP methods . From a thorough literature review and discussions with industry experts, 47 frequent hurdles were identified, and both studies were carried out using a questionnaire-based survey and work study group . this work utilizing a model used by well-known researchers in the field into foreign countries, An ISM-based model was constructed to investigate the interactions between the factors, The driver’s power-dependence matrix reveals the relative importance of each aspect as well as their interdependence, The ISM-based model provides a clear picture of the relationship between the variables, [22], The recommended solution, however, The AHP method was used to assign these barriers a rank (priorities) based on industrial experts judgments, which were then converted into a Pair-wise comparison matrix for barrier category, by dividing this matrix on the sum of each colomne we get a standardization matrix for barrier category, and finally a weight wich is the medium of the sum of each line, which gave us the barriers priorities ,This method is more accurate and give a clear idea on the impact of the main barriers and then we can focus on the solution , this method is used for almost all the issues that face the industrial world,
Our perspective for the the future is the application of AHP process on the moroccan industries with various activities in order to understand what block ou moroccan companies to apply the green supply chain management in their activities .
Acknowledgment
The authors thank the reviewers for their helpful comments to earlier drafts of this paper.
- T, Rahman et al,, “Evaluating barriers to implementing green supply chain management: An example from an emerging economy”, Production Planning & Control, vol, 0, no, 0, pp, 1–26, 2019, doi:10,1080/09537287,2019,1674939,
- H, Fahmy et al,, “Barries of the GSCM Implementation: A benchmark of studies of AHP and ISM”, 2020 13th International Colloquium of Logistics and Supply Chain Management, LOGISTIQUA 2020, pp, 1–8, 2020, doi:10,1109/LOGISTIQUA49782,2020,9353902,
- P, Government, M, Perron, “Barriers to Environmental Performance Improvements in Canadian SMEs Barriers to Environmental Performance Improvements in Canadian SMEs by Geneviève M , Perron Interdisciplinary PhD Student Dalhousie University”no, January, 2005,
- K, Govindan, Mathiyazhagan, A, Noorul Haq, “Barriers analysis for green supply chain management implementation in Indian industries using analytic hierarchy proce”, International Journal of Production Research, vol, 52, no, 1, pp, 188–202, 2014, doi:10,1080/00207543,2013,831190,
- C, R, Carter, M, Dresner, “Purchasing ’ s role in environmental management : cross-functional”, Journal of Supply Chain Management, vol, 37, no, 3, pp, 12–27, 2001, doi:10,1111/j,1745-493X,2001,tb00102,x,
- H, Walker, L, Di Sisto, D, McBain, “Drivers and barriers to environmental supply chain management practices: Lessons from the public and private sectors”, Journal of Purchasing and Supply Management, vol, 14, no, 1, pp, 69–85, 2008, doi:10,1016/j,pursup,2008,01,007,
- S, Luthra et al,, “Barriers to implement green supply chain management in automobile industry using interpretive structural modeling technique-an Indian perspective”, Journal of Industrial Engineering and Management, vol, 4, no, 2, pp, 231–257, 2011, doi:10,3926/jiem,2011,v4n2,p231-257,
- B, Sharma, M, Singh, Neha, “Modeling the Knowledge Sharing Barriers using an ISM approach,”, International Proceedings of Computer Science & Information, vol, 45, no, ICIKM, pp, 233–238, 2012,
- W, Niemann, T, Kotze, F, Adamo, “Drivers and barriers of green supply chain management implementation in the Mozambican manufacturing industry”, Journal of Contemporary Management, vol, 13, no, 13, pp, 977–1013, 2016,
- K, T, Shibin et al,, “Enablers and Barriers of Flexible Green Supply Chain Management: A Total Interpretive Structural Modeling Approach”, Global Journal of Flexible Systems Management, vol, 17, no, 2, pp, 171–188, 2016, doi:10,1007/s40171-015-0109-x,
- H, Soleimani et al,, “Fuzzy multi-objective sustainable and green closed-loop supply chain network design”, Computers and Industrial Engineering, vol, 109, pp, 191–203, 2017, doi:10,1016/j,cie,2017,04,038,
- R, Baki, “Literature Review on Green Supply Chain Management Concept and Problems During It’s Implementation”, The Journal of International Scientific Researches, vol, 3, no, 2, pp, 17–25, 2018, doi:10,23834/isrjournal,412121,
- A, Majumdar, S, K, Sinha, “Analyzing the barriers of green textile supply chain management in Southeast Asia using interpretive structural modeling”, Sustainable Production and Consumption, vol, 17, pp, 176–187, 2019, doi:10,1016/j,spc,2018,10,005,
- K, Govindan et al,, “Barriers analysis for Green Supply Chain Management implementation in Indian Industries Using Analytic Hierarchy Process Int , J , Production Economics Barriers analysis for green supply chain management implementation in Indian industries using analytic ”, Intern, Journal of Production Economics, vol, 147, no, September 2013, pp, 555–568, 2018, doi:10,1016/j,ijpe,2013,08,018,
- J, N, Warfield, “Developing Interconnection Matrices in Structural Modeling”, IEEE Transactions on Systems, Man and Cybernetics, vol, SMC-4, no, 1, pp, 81–87, 1974, doi:10,1109/TSMC,1974,5408524,
- A, P, Sage, T, J, Smith, “On group assessment of utility and worth attributes using interpretive structural modeling”, Computers and Electrical Engineering, vol, 4, no, 3, pp, 185–198, 1977, doi:10,1016/0045-7906(77)90029-5,
- V, Raci, R, Shankar, “Analysis of interactions among the barriers of reverse logistics”, Technological Forecasting and Social Change, vol, 72, no, 8, pp, 1011–1029, 2005, doi:10,1016/j,techfore,2004,07,002,
- T, L, Saaty, “WHAT IS THE ANALYTIC HIERARCHY PROCESS ?”1988,
- K, Mathiyazhagan et al,, “Application of analytical hierarchy process to evaluate pressures to implement green supply chain management”, Journal of Cleaner Production, vol, 107, pp, 229–236, 2015, doi:10,1016/j,jclepro,2015,04,110,
- C.C. Pradeep, “Assessment and analysis of GSCM barriers using AHP”, International Research Journal of Engineering and Technology(IRJET), vol, 4, no, 6, pp, 1777–1782, 2017,
- C, W, Hsu et al,, “Green supply chain management in the electronic industry”vol, 5, no, 2, pp, 205–216, 2008,
- S. Singh, “Vol , 03 Issue – 03 , ( March 2015 ) ISSN : 2321 – 1776 International Journal in IT and Engineering”vol, 03, no, March, pp, 279–287, 2015,
No related articles were found.