Identification of Basic Respiratory Patterns for Disease-related Symptoms Through a Microphone Device
 , Varad Raut1, Madhura Jadhav2, Shreya Alva2, Kalpesh Vichare1 and Ameya Nadkarni1
(This article belongs to the Special Issue on Special Issue on Multidisciplinary Sciences and Advanced Technology (SI-MSAT 2022) and the Section Biochemical Research Methods (BRM))
Export Citations
Cite
Khatkhate, A. M. , Raut, V. , Jadhav, M. , Alva, S. , Vichare, K. and Nadkarni, A. (2022). Identification of Basic Respiratory Patterns for Disease-related Symptoms Through a Microphone Device. Journal of Engineering Research and Sciences, 1(6), 36–44. https://doi.org/10.55708/js0106005
Amol M Khatkhate, Varad Raut, Madhura Jadhav, Shreya Alva, Kalpesh Vichare and Ameya Nadkarni. "Identification of Basic Respiratory Patterns for Disease-related Symptoms Through a Microphone Device." Journal of Engineering Research and Sciences 1, no. 6 (June 2022): 36–44. https://doi.org/10.55708/js0106005
A.M. Khatkhate, V. Raut, M. Jadhav, S. Alva, K. Vichare and A. Nadkarni, "Identification of Basic Respiratory Patterns for Disease-related Symptoms Through a Microphone Device," Journal of Engineering Research and Sciences, vol. 1, no. 6, pp. 36–44, Jun. 2022, doi: 10.55708/js0106005.
The research in this paper focuses on the capture of respiratory patterns in real-time through a minor modification of an anti-snoring device that is readily available off the shelf or can be bought online and attaching a microphone to it. The audio pattern is recorded for the various lung conditions at different stages. The data recorded is generated in graphical form to understand the pattern. The setup for recording and generating data patterns is explained in the paper. The procedure for using the device and gathering data is mentioned in detail in this paper and sample raw data is presented for researchers. The purpose of this device is easy data collection and interpretation for self-diagnosis of the anomalies in the breathing pattern through audio data and display of the patterns in smartphone applications that can further be investigated by a physician.
1. Introduction
Breathing is the most important respiratory activity which can change according to human health conditions. It is the amount of air that enters and exits with each respiratory cycle. A healthy human being experiences a stress-free Respiratory cycle. Inhaled oxygen is responsible for various bodily functions such as digestion of food, peaceful sleep, mental stability, improved body immune system, reduced stress levels, etc.
According to the health conditions the respiratory pattern changes along with the change in oxygen inhaled and the amount of carbon dioxide thrown out of the body.
During cough and cold, the Inhaled oxygen amount and its pattern change along with the change in voice disrupting the homeostasis. Usually cold, cough and throat conditions are symptoms of various infections, pulmonary problems, sleep apnea, and other minor health conditions that cause ineffective breathing, some major circumstances could be Heart failure, lymphomas, Paralysis, liver, and kidney problems, etc. Abnormal respiration can be in the form of hyperventilating due to stress, anxiety, a panic attack or due to heart or lung disease, or hypoventilation due to lung conditions like bronchitis or cystic fibrosis, or Obstructive sleep apnea [1]. This disruption in normal breathing patterns is disturbing and stressful hence, the Clearance of airways in the respiratory system is a priority, as it affects the oxygen supply to tissues.
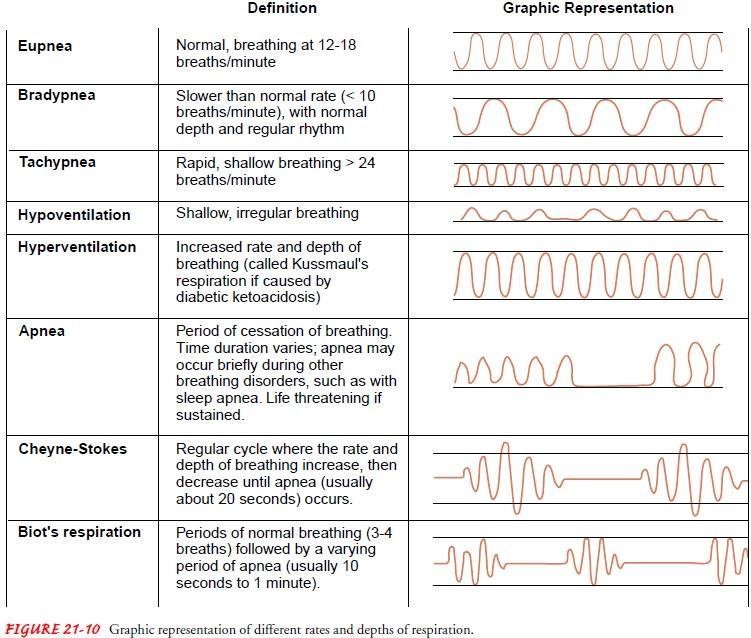
Sometimes depending upon the breathing pattern, the audio pattern of voice during speaking, and coughing, problems can be detected. Generated patterns can be used to detect the affected region of the respiratory system and help in early diagnosis and treatment. These patterns are generated in the graphical form of a sinusoidal wave, where Rate, depth, timing, and consistency of breaths are all important to maintaining a delicate balance of respiration and metabolism. In case of illness, these patterns change typically to increased, decreased respiratory rate or clusters of rapid respiration.
In normal breathing conditions at rest, there is inhalation followed by exhalation and a pause of 1-2 seconds. While in case of abnormal breathing different patterns are formed according to respiratory problems.
The given Figure 1 and [2] show the pattern formed during various conditions and a description of what exactly can be causing it. As you can see the normal breathing pattern is a sinusoidal wave.
In this paper along with breathing patterns, we have also gathered patterns for a sore throat condition, cough, and chewing. This audio pattern can be used to examine underlying health conditions with an easy setup. We are trying to highlight the cheapest method that can be further developed from an audio pattern to a graphical format to observe and understand for early diagnosis.
We recorded the breathing pattern using a device with an easy setup from scratch. We have used readily available materials such as anti-snore devices and microphones. Audio files are created as raw data to record audio patterns for speaking, coughing, chewing, and breathing from a healthy person and with a sore throat.
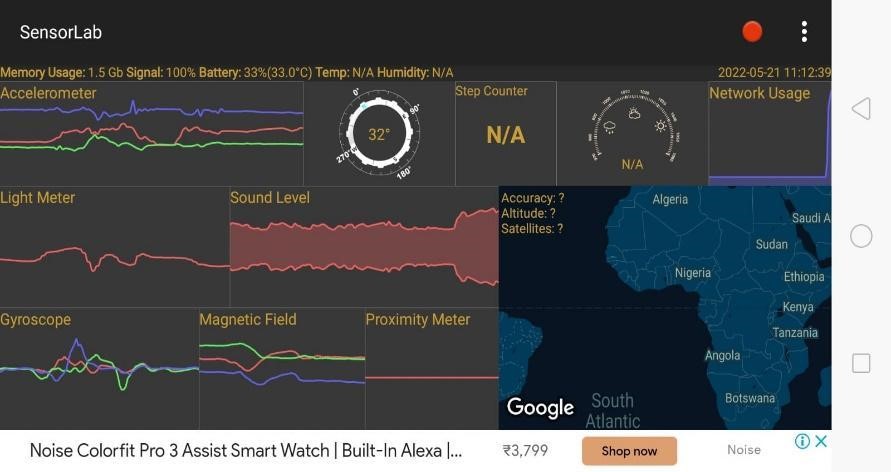
A mobile application namely Sensor Lab is used which can generate an audio file that can be transformed into graphical patterns for better examination. This application can be downloaded easily on android as well as iOS systems.
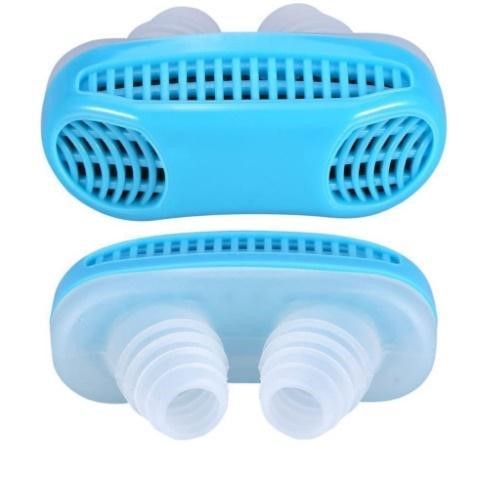
Anti Snoring device [3] Figure 2 fits properly in the nose with no gaps for the leak. It essentially is used for people with sleep apnea in which case it prevents deep sleep due to snoring. To maintain continuous positive air pressure in the respiration this device is used to provide enough extra air pressure to prevent soft tissue from partially obstructing airflow.
Through this paper, we are trying to promote the idea of regularly observing the breathing pattern by recording it into audio form and generating and storing data for comparison.
A habit of recording data over a specific time interval can result in early detection of any problem and maintaining good health conditions. Nowadays people have a variety of health conditions and data collected using wearables during sports mode has become regular. Similarly, the breathing pattern and audio pattern for cough, throat, and chewing can be noticed periodically or regularly to maintain a healthy lifestyle.
The data can be saved successfully in the form of an audio file or graphical pattern for future references. Through this, the detection of abnormal breathing patterns, cough sounds, and throat conditions can be detected for early diagnosis and treatment easily anytime anywhere. The setup of detail vice enables the user to record data in a fraction of a minute.
Users can use this setup to record breathing patterns while performing sports, at rest, during sleep, etc. Depending upon the graph he/she can seek further doctor consultation over it.
This could be the cheapest and easiest way to understand and generate data on breathing patterns from audio files.
2. Breathing pattern sensors
Breathing patterns can be monitored by pressure sensors that can be attached as a belt to the ribcage, humidity sensor that is attached to a mask, oximetry sensor to measure oxygen saturation and hence, detect respiratory anomalies due to decreased oxygen intake, acceleration sensors that monitor muscular contraction during breathing and are attached to the chest wall, resistive sensors, the thoracic or abdominal expansion, and relaxation manipulate the resistance of the stretch sensor [4].
Lung sounds can be monitored by acoustic sensors as well [4], and this paper intends to explore this sensing technique due to its convenience and availability.
3. Design of Anti-snoring air-purifying Device
The proposed device for sampling input is a simple modification to the commercially available anti-snoring device on the market. The detailed diagram of the anti-snoring device is shown in Figure 2.
3.1. Description of the original device
The anti-snoring device as seen in Figure 2, consists of a medical-grade silicone and plastic insertion module that snugly fits in the nose of the person and an activated carbon filter to purify the air while breathing to remove contaminants. The manufacturer claims that the device also does PM2.5 filtering [1].
3.2. Working on the original device
Some types of snoring are caused due to obstruction of the nasal passage. The anti-snore device as shown in Figure 2 claims to open this restriction by clearing the air and purifying it at the same time thereby maximizing the airflow and eliminating the need to gasp for air. However, there is insufficient data to reinforce its efficiency in eliminating snoring completely, as there are several causes including nasal congestion, obesity, sleep apnea, anatomy, sleeping position, and consumption of relaxants such as alcohol, etc [2] and this device fails to address other causes of snoring. But this device can certainly be modified for another purpose.
3.3. Cleaning mechanism of the modified device
The modified device can be opened using a minus-type screwdriver. The device needs to be cleaned and sanitized after usage to avoid infection. To clean the device, prepare a solution of soap. Cleaning can be carried out by immersing a cotton swab and wiping or dipping the silicon-plastic device in this cleaning solution to ensure no allergen or pathogen triggers an immune response. This will also ensure the drastic reduction of any kind of viral load, including SARS-COV2 on the inner surface of the device. Then it needs to be rinsed with water. The cleansing solution can be stored in a spray bottle and can be used intermittently. Make sure to remove the activated charcoal filter before cleaning can be attached and assembled once the device is cleaned and dry [5].
3.4. Design and working of the modified device for breathing input
A] Device setup
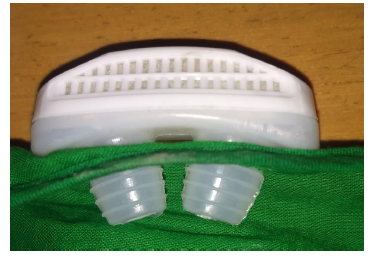
The device as seen in Figure 3, has two frontal openings that are to be inserted into the nostrils and one opening at the top for airway passage. The steps for assembly are as follows:
- The device can be opened from the inside by removal of two + screws using a screwdriver. This will separate the silicone module from the plastic casing.
- The original device is dismantled, and an activated carbon filter is added, due to its effectiveness as a barrier or an entrapment against pathogens as small as a virus with sizes in nanometers [5].
- The device is reassembled and is fitted into a cloth mask or surgical mask, that is easily available and can be discarded after use [6].
- A small microphone is attached to the mask to capture audio signals. This microphone can be attached to any smart device like a smartphone, computer, or laptop via a wired/ wireless network such as Bluetooth.
- Applications like sensorlab need to be downloaded to visualize the interpreted data.
B] Data interpretation
- Connect your microphone to your smart device and open the sensor lab application to sample your audio data while making a sound of coughing or sneezing. You can also sample your data during the sore throat and normal conditions and compare the graph in the form of waves.
- Ensure that the microphone is at least 1-2 cm away from your modified anti-snoring device to get a clear sound. Record the audio for 1 minute.
- The data is generated in the form of audio signals and the application saves this data anywhere on your device in a .zip file extension.
- To locate the file, rename the file and upload it to your drive, cloud, or in an accessible location on your device.
- Now the recorded sample needs to be interpreted in the form of a wave graph. For this, we need to open the file in a CSV file extension. This would allow data to be saved in a tabular format in Microsoft excel.
- This tabular data can be plotted as a wave graph using a chart tool in excel to display the final pattern with the crests and troughs for a given sample.
- The method that we adopted was manual but there is a scope for automation to directly take the recorded sample as an input and generate the patterns and scalar value of the anomaly as an output. This can be done by using various software such as MATLAB.
- Machine learning algorithms can be used in the software that would collect the samples for each respiratory condition in individuals and predict the outcome. The algorithms that perform as per the calculations can be incorporated into the sensor lab application as well.
3.5. Audio data recording for Breathing pattern
The anti-snoring device combined with a microphone attached to a smartphone for real-time data collection and post-processing to give levels of anomalies in respiratory patterns of individuals like sore throat, cough, and cold which can act as precursors to the disease. Also, in addition to this, accelerometer data can be gathered using a mobile application namely Sensor Lab, and correlated with the respiration patterns to indicate other symptoms like shortness of breath, etc.
A sensor lab is used to generate the audio data patterns. The recorded audio files in CSV format can be used with the sensor lab. The sensor lab has an accelerometer that is used to measure the vibration of motion, it has a transducer that converts mechanical force caused by vibration or change in motion into electric current using the piezoelectric effect.
Installation of sensor lab on android:
- Open google play and search for sensorlab.
- Look for the 1.3 sensor lab version offered by LP Ellis
- Click on the install button to initiate the download
- Open the application and start using it.
The Sensor lab app is initiated after installation in the smartphone and must record the acceleration data along with the sound data. This selection must be made by going into settings and checking the box next to the sound, accelerometer. Other data may also be recorded and stored in CSV format for offline analysis.
4. Sample Data Recorded in Audio pattern and charts
Figure 2 shows blank data generated with no sound. Usually, this blank is recorded as a reference or control before any further data collection.
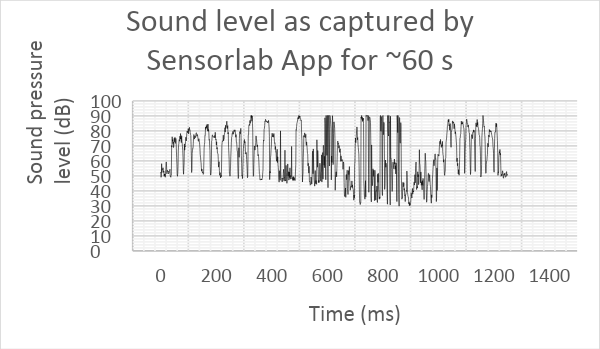
The given pattern is breathing data recorded by the user in a sitting position at rest. The user simply held the device close to the nose while breathing for 1 min. The graph shows sinusoidal waves which are very much like each other. There is no disturbance in the wave pattern recorded for a 1 min time duration. From this Figure 7, we can easily interpret the user being a normal healthy human being at rest whose respiratory pattern is undisturbed.
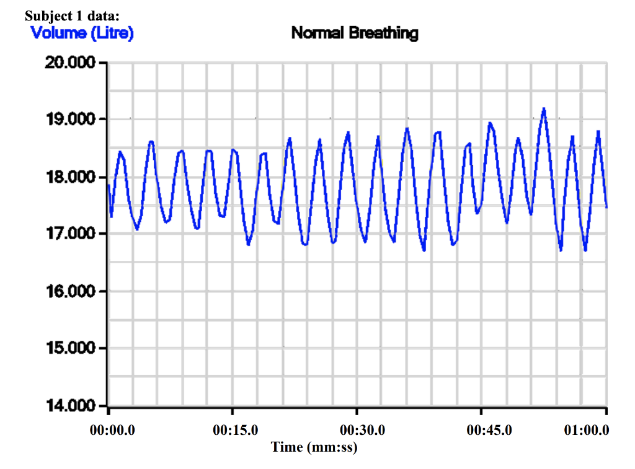
Users can record breathing patterns periodically to compare the pattern generated. Depending upon the stored data user can understand if any anomalies are detected in the waveform. Figure 8 (taken from Chegg.com as a reference or for pictorial representation) clearly explains the breathing pattern. Normal breathing is a sinusoidal wave with a crest and trough representing exhalation and inhalation respectively.

During a sore throat, the quality of the voice becomes gravelly-sounding and sometimes too quiet or soft to hear. The vocal cords swell up which affects the way they vibrate and cause hoarseness. The pattern generated for sore throat must change pitch.
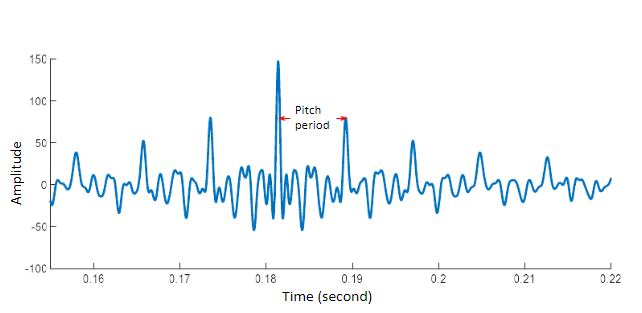
It can be seen in Figures 9 & 10 [7] pattern in the graphical format generated for sore throat fluctuates considerably. The pitch varies repetitively from high sharp to low pitch. A broken or cracking sound pattern sometimes flat pitch can also be observed. This pattern generated can be used to detect the problem involving the throat.
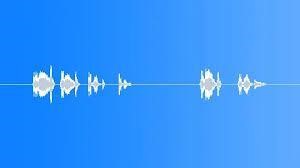
Figure 11 (taken from the website Pond5) is an audio pattern for human male sore throat coughing that differs from Figure 13 representing normal coughing. The difference can be seen at the end of coughing with a sound, and a sharp fluctuation is seen at the end of the voiced region. Also the difference between the explosion region, intermediate region, and voiced region is unclear in Figure 11. A sore throat can be caused due to smoking, acid reflux, allergies, infections, etc. could be the reason that can be used for prediction.
Early detection of sore throat is possible through this cheap and readily available device set up by observing the pattern generated.
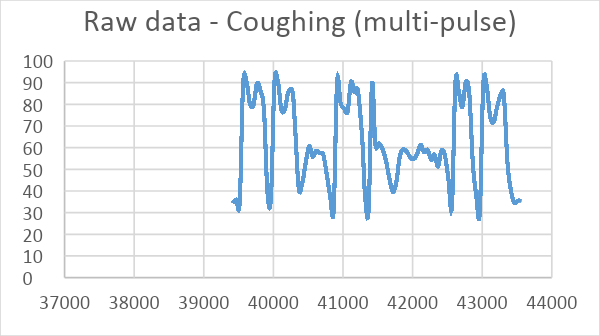
Figure 12 shows the interpreted audio pattern in the graphical one and Figure 13 shows the audio pattern recorded by ERS Publication [8]. In Figure 12 one can notice easily that a square wave is formed. The crest and trough region together forms a square pattern as it is a thick exhalation activity. Coughing is a louder sound with very low inhalation during the period. A small trough formed between crests represents a small inhalation time needed to complete the coughing.
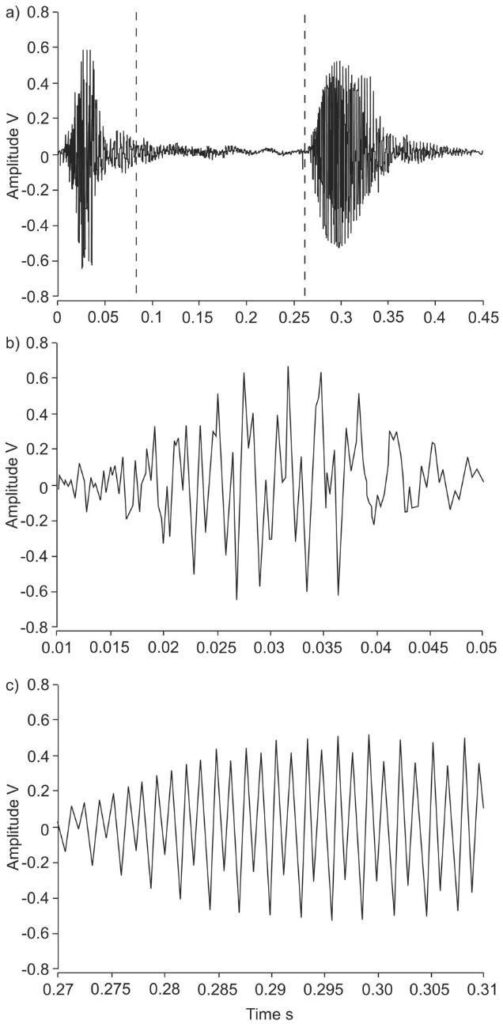
The audio waveform in Figure 13 can be divided into namely explosive (left) which is an enlarged or expanded wave pattern that indicates noise, intermediate (center indicating gate break in the first cough exhale, and inhaling time before the next cough, voiced (right) indicate periodic appearance.
Such patterns can indicate the extent to which cough is present in the throat or lungs. Cough in the lungs called bronchitis sounds whistling with the noise. So, depending upon sound and audio patterns we can detect the cough condition. We can compare the two images Figure 11 and Figure 13 to spot and study the difference between coughing and sore throat conditions and coughing in normal conditions.
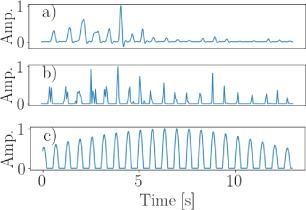
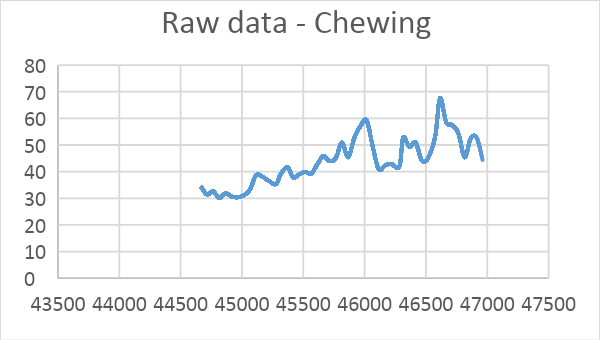
We have also recorded data patterns for Chewing sounds Figure 14. This graph appears to be different from other sound patterns. Chewing in the initial period is slow because of big food bites and becomes steady after the breakdown of big bites into smaller chunks so fluctuation can be seen at the center in Figure 14 and the pattern then starts to move downward representing the gulping of food after a considerable breakdown. In figure 15 [9] it can be observed the sound pattern increases in the initial period, is stable at the center, and starts decreasing towards the end of chewing.
The reason to record chewing patterns is to observe healthy dietary means. The digestion process starts right from your mouth when a person chews. Saliva moistens food and its enzymes break down starches. It is important to chew food properly as it is a healthy activity and helps in better digestion and absorption.
Some people swallow food quickly with no significant chewing. Such activity is not healthy and should be given attention. Recording such activity can increase awareness about the chewing period for better digestion and absorption.
5. Calculation of intensity of anomalies in respiratory patterns using symbol sequences
- The anomalies in respiratory patterns like cough, sore throat, etc, and other patterns like chewing are identified using Sensorlab App data in Dbl.
- The data in DBL is ranging from 0 – 128 and hence, can be represented using 7 bits. Use 1 bit for sign, 7 bit for the pre-decimal part, 1 bit for decimal, and 7 bit for 2 digits after decimal which gives us a string of 16 bits.
- For each value of DBL, calculate the symbol sequence and concatenate each sequence with the previous time version of the DBL sequence. This will then form a string of symbol sequences.
- Convert the string of 0 and 1 into a finite state machine of alphabet size A = 2 and depth D, which is chosen to decide the complexity of the machine.
- Find the probabilities of visits of all the states in the finite state automata and compute the probability vector.
- Use a suitable norm to identify the intensity of the anomalies in the patterns like the intensity of cough, cold, and other plausible symptoms.
Sample calculation
A single value of DBL is parsed into a symbol sequence as shown below and a sample calculation of probability for a 2-state machine (0 and 1) is carried out for the understanding of the readers. The analysis is carried out for a singleton data point, however, in reality, a window of suitable size must be chosen (for eg; 100 data points, in this case, is a likely window) and then the above procedure must be followed to quantify the anomalies. As seen in Table 1, the value of the pressure level P1 is converted to binary after rounding up to 2 digits The probability of occurrence of 0 = 11/16 = 0.6875 and the probability of occurrence of 1 is 5/16 = 0.3125
Table 1 : Conversion of dB to binary string for computation
k | time | dB (SPL) | P1(µpa) | Round up to 2 digits | Binary(P1) after rounding up to 2 digits | 0 in 16 bit | 1 in 16 bit |
0 | 15 | 51.90992 | 787.9995975 | 787.99 | 0000001100010011 | 11 | 5 |
A similar analysis has to be carried out after each time interval of 100 sample points in column 1 of the data stored via the Sensorlab app.
The results shown via the above analysis indicate that the potential anomalies can be classified and the intensity of the same can be quantified using the above procedure.
The studies conducted by the authors also imply that gaps (as caused by an improper fit of the mask) can result in over a 60% decrease in the filtration efficiency, implying the need for future cloth mask design studies to take into account issues of “fit” and “leakage”, while allowing the exhaled air to vent efficiently.
To overcome this drawback, the proposed design in this paper of the device allows the nose to be directly exposed to the environment and breathing to take place through the device itself rather than the mask. The inhalation can occur free from the frontal end and exhalation can take place from the top end. As the device snugly fits into the nose, it will eliminate the problem of gaps to a large extent. This will lead to almost zero leakage and hence, filtration efficiencies will increase dramatically as well as pressure drop due to leakages will be minimal.
6. Results
It is clear from the given information that Audio patterns and graphical patterns can be recorded easily by setting up the device from the readily available materials. The setup hardly takes 1 min and recording the audio files in CSV extension can be done using the Mobile application Sensor lab.
The breathing pattern for the normal condition shown in Figures 7 & 8 clearly shows sinusoidal waves with crest and trough. This data pattern was extracted directly from the Sensor lab in the audio format followed by transformation into Graphical format through Programming (automation). Figures 9 & 10 Show sore throat, and coughing patterns. One can observe the change in the waveform in case of sore throat and coughing. Figure 14 Chewing pattern which can also be observed and examined through the line chart. Similarly, sleep respiratory rate can also be examined by timing the modified device to record data after certain time intervals.
All of the sample recordings clearly show the differences in a pattern according to sound captured in a specific time interval.
The acoustic type sensing of the breathing patterns can be manipulated or impeded by external perturbations and care must be taken while sampling the data. One needs to ensure that they sample their data in a place where they are immune to any kind of auditory disturbances.
While sampling, the microphone also has to be placed at least 1-2 cm away from the modified device to avoid crackling noises which can result in a disturbing pattern.
More data is required from individuals that can be grouped into one category of symptoms related to lung conditions and run the algorithm to generate the probabilities. This data can be used by pulmonologists and cardiologists based on which they can suggest further tests or diagnose a particular anomaly, briskly.
7. Conclusions, Salient features, and Future work
The paper proposes a respiratory data collection procedure and sample data from a modification to the existing antisnoring device available in the Indian market at the link [4].
The salient features of the work presented in this paper are given below
- The device snugly fits the nose and hence will not cause any disruption to normal breathing.
- The device very well fits the microphone and can be used along with the Sensorlab App available on the play store.
- The device also overcomes the drawbacks of masks like gaps and leaks and eliminates recirculation of CO2.
- The respiratory patterns are gathered along with accelerometer data which is necessary to know the current body movements of the individual and to know if the person is walking, running, jogging, or doing heavy exercise.
- The sample data is recorded without any voice or any speech during the trial. The patterns are distinguishable and can be classified into various categories of sore throat, cough, and chewing.
- The sample data shown in the Figure above indicates that the respiratory patterns can very well be identified and distinguished using the microphone data. The patterns can be classified into various categories of sore throat, cough, and chewing with their intensities.
More such applications can be created with a highly efficient design of the device that can cut down the disturbance while recording the audio data, interpreting the data, and directly one day diagnose the condition or assist the physicians with treatment. Additions to the features of this system may enable a person to one day diagnose cardiovascular diseases or even concussions. There is tremendous potential for this technology in the future, as scientists are already making innovations and are looking for inspiration in the healthcare sector. Machine learning algorithms have proven to be reliable for more accurate predictions and this system can be implemented universally without any inconvenience.
Conflict of Interest
The authors declare no conflict of interest.
- Diana Starovoytova, “Snoring and its- management (Part 1/2): A review”, Innovative Systems Design and Engineering, ISSN 2222-1727 (paper) ISSN 2222-2871 (online), Vol.9, No.12, 2018.
- Iain Wheatley,” Respiratory rate 4: breathing rhythm and chest movement” Nursing Times; 114: 9, 49-50,2018.
- Amol Khatkhate, Khushbu Shirsat, Neha Barai, Namita Sawant, Nabil Mahadik, Manoj Paul Singh Raj, Dr. Sujata Kumari, ” Study of effective respiration through an anti-snoring device modified to restrict the entry of the novel Coronavirus (SARS-Cov2)”, Published: IEEE-BHTC 2020
- Taisa Daiana da Costa, Maria de Fatima Fernandes Vara, Camila Santos Cristino, Tyene Zoraski Zanelle, Guilherme Nunes Nogueira Neto, and Percy Nohama, “Breathing monitoring and pattern recognition with wearable sensors”, DOI: 10.5772/intechopen.85460, June 2019.
- Md Sumon Reza, ABM Kamrul Hasan, Shammya Afroze, Muhammad S. Abu Bakar, Juntakan Taweekun, Abul K. Azad, “Analysis on preparation, application, and recycling of activated carbon to aid in COVID-19 protection”, DOI: 10.30880/ijje.2020.12.05.029.
- Abhiteja Konda, Abhinav Prakash, Gregory A. Moss, Michael Schmoldt, Gregory D. Grant, and Supratik Guha, “Aerosol filtration efficiency of common fabrics used in Respiratory cloth masks”, ACS Nano 2020 14 (5), 6339-6347. DOI: 10.1021/acsnano.0c0325
- Hendra Setiawan, Sutono Sutono,” The Effect of Sore Throat on Changes of Vowel Sounds”, Research Gate, vol. 9, no. 1, Halaman 87-90, DOI:26760/elkomika.v9i1.87
- Kelsall, S. Decalmer, D. Webster, N. Brown, K. McGuinness, A. Woodcock, J. Smith, European Respiratory Journal 2008 32: 175-179; DOI: 10.1183/09031936.00101307
- David Kopyto, Rui Zhang, Oliver Amft,” Audio-Based Onset Detection applied to Chewing Cycle Segmentation”, ISWC ’21: 2021 International Symposium on Wearable Computers, Pages 124–128, DOI:10.1145/3460421, September 2021,
No related articles were found.