Asthma Monitoring Systems Based on Electro-Infrared Sensors: A Review

(This article belongs to the Section Biomedical Engineering (BIE))
Export Citations
Cite
Al-Neami, A. Q. and Abed, Z. A. (2024). Asthma Monitoring Systems Based on Electro-Infrared Sensors: A Review. Journal of Engineering Research and Sciences, 3(3), 27–32. https://doi.org/10.55708/js0303004
Auns Qusai Al-Neami and Zina Ali Abed. "Asthma Monitoring Systems Based on Electro-Infrared Sensors: A Review." Journal of Engineering Research and Sciences 3, no. 3 (March 2024): 27–32. https://doi.org/10.55708/js0303004
A.Q. Al-Neami and Z.A. Abed, "Asthma Monitoring Systems Based on Electro-Infrared Sensors: A Review," Journal of Engineering Research and Sciences, vol. 3, no. 3, pp. 27–32, Mar. 2024, doi: 10.55708/js0303004.
Asthma is one of the chronic diseases that affected on the respiratory system. Studies had showed that more than 350 million people who suffering from asthma around the world which is equivalent to 1 in each 12 adults. Many intelligent monitoring systems had proposed in order to help the patient to know the situation before the frenzy happens. This approach has additionally been applied by individuals wanting to boost the standard of life by utilizing this technology. This paper tends to perform a comprehensive coverage and review that aim to show and analyze the advances of the most recent studies supported medical aid in the field of respiratory system especially monitoring and detection of the asthma disorder based on infrared sensors. The present analysis covers revealed manuscripts in scientific journals and recognized conferences since the year 2016. Also, it tends to show a reference model supported the analysis of the resources used from the chosen studies. Finally, the objective of the present proposal is to assist future enthusiasts to get and enumerate the specified factors related with asthma monitoring systems based on infrared sensors.
1. Introduction
The most important parameter in the human lungs is the Carbon Dioxide (CO2) concentration, this measurement called capnogram. Which was first measured in the early 1900s [1, 2]. The concentration of the CO2 can be measured accurately by using capnogram, Also its features use to provide overall information about Chronic Pulmonary Disease in addition to cardiorespiratory disorders, Congestive Heart Failure, and asthma [3-5]. Nowadays, asthma consider as one of the most threated diseases of respiratory disorders. in the world, Asthma considered as the fourteenth rank of the most common respiratory disorders. About 334 million people affected by asthma around the world, 9% from them are adult while children represent 14% of them [4, 6, 7]. In Malaysia, 10-13% of population affected by Asthma, While in Malays 67% of population affected by this disease, In Chinese and Indians the percentage goes from 7.3% to 12.9% respectively [8, 9]. The devices that used to diagnosis asthma are patient dependent device, which they require co-operation from patients, so it’s difficult to use by children. Therefore, an independent device used to diagnosis asthma must be exist, for example, capnography in order to assess the respiratory the function of asthmatics [10-12]. Many devices were developed to make the diagnosis and monitoring of asthma easier such as Spirometer and peak flow meter. Hence, many studies were carried out in Google Scholar between 2010 to 2023 by utilizing standard English language, By using different keywords such as (capnogram, infrared sensor, asthma monitoring system, CO2 sensor, respiratory CO2, capnogrph, and monitoring system) to define CO2 sensors technology, and capnogram features [13-15].
The concentration of exhaled carbon dioxide was measured by using end-tidal CO2 (ETCO2) detectors. The endtidal CO2 represent the partial pressure or maximal concentration of CO2 at the end of exhalation. Which is correlates to the arterial concentration of CO2 in patient [16]. Different design of the detectors are introduce along the time, But overall quantitative and qualitative Detectors can be considered as the main type of capnograph [17]. If the detector use to detect the presence or absent of the CO2, it’s a qualitative detector such as colorimetric detector which indicate the absent or present of the CO2 in exhaled gas by using color. More detailed information given by using the quantitive detector because it read the level of CO2 in the exhaled gas [18-20]. Another classification of the detector depend on Their location in the airway system divide into mainstream and sidestream devices, IR sensor (Infrared sensor) are a Mainstream detectors where gas flow goes directly into the device to produced real-time wave of the CO2 waveform. Which is used mainly with intubated patients. While Sidestream detectors are located away from the path of air flow in the respiratory system. Such as Nasal monitoring of end-tidal CO2 [21, 22].
Capnography used in patients through anesthesia, ventilator cases, and head trauma. But its main benefit used in intubated patients, Also it can be used in patients that are awake in children and adult [23, 24]. By using a sidestream capnograph attached to a nasal catheter produced ETCO2 values that correlated well with PaCO2 readings capnography could be used attached to a facemask [25-28].
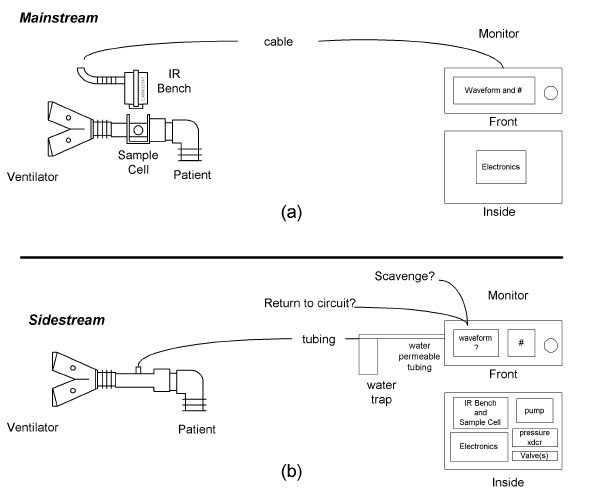
The main different between mainstream and sidestream are shown in table 1 and figure 1. witch represent the different in definition of the names, the effect of the environment on the reading to show that mainstream capnogram has un issue by mixing the sample gas which will effect on the reading, While the sidestream capnogram has delay time results from remote location. Also the table and figure show the different in the main parts of each devices and give the end result of each device.
Table 1: Comparison Between Mainstream and sidestream capnography [21, 27, 29, 30]
Mainstream | Sidestream |
Name as Non-Diverting capnometer measuring CO2 concentration away from the patient airway. | Name as Diverting capnometer measuring CO2 concentration at the patient airway. |
Issue of the mainstream capnometer include different in temperature and humidity between sampling site and monitor site, removal of water through the distance, the sample gas may mix through the cell which will affect on the reading, pressure drop across the tubing, and dynamic distortions to the waveform | Issue of the sidestream capnography include delay time results from using a remote location, this delay may last for up to several seconds with 200ms distortion the total response time (delay) can be useful to provide time for the clinician to prepare for the patient’s case |
It consists from the sample cell and infrared bench | It consists of 6- to 8-foot-long small-bore tube with water trap and drying tubing and sample cell |
Give a real-time reading of the partial pressure of CO2 (carbon dioxide) within the respiratory system | To aspirate a sample of gas from the breathing circuit in the respiratory through a 6- to 8-foot-long small-bore tube at a flow rate that may vary as much as ±20% |
2. Related Work
In 2013, the authors made a comparison between mainstream and sidestream measurement of end tidal carbon dioxide (PETCO2) was made by taking 114 subjects which was patients require arterial blood gas analysis, By using Bland-Altman method (it’s a method used to calculates the mean difference between two methods of measurement (the ‘bias’)) to evaluate between the PETCO2 measurements and PaCO2 measurement witch represent the measures of an arterial blood gases (ABG) to evaluates carbon dioxide (CO2) levels in the blood. It results in the mainstream, 13mm Hg value different between PETCO2 and PaCO2 (0.6 to 25.5 agreement limits to 95%) with moderate correlation (P < .001, r 0.55). While in the sidestream 9.7 mm Hg value difference between PETCO2 and PaCO2 (5.4 to 24.7 agreement limits to 95%) with poor correlation (P < .001, r 0.41). that improve PETCO2 has lower value than the PaCO2 [26].
In 2016, the authors had proposed a continuous monitoring system that helps asthmatics to monitor the activity of their lungs as well as the related environmental parameters. Asthma symptoms can be detected by using this monitoring system. The designed system consists of a device module to monitor the temperature, humidity, activity, air pressure and the flown gases that surround asthmatics patient. The data then sent from the device to the patient’s doctor by using a Global System for Mobile Communication (GSM). The doctor could examine the sensed values and he could take the desired decision for giving the asthmatics the right treatment and medications. This proposed system is low cost, credible, and friendly to use in order to find out the asthma symptoms in asthmatics [31]. In 2017, the authors had developed a smart model of asthma prediction system using Internet since there are 334 million people around the world are suffering from asthma. Asthmatics are sensitive to things that may not bother the normal people, they feel uncomfortable when the level of smoke increased, either fog or pollution in the surrounding air. The number of asthmatics has been increasing so fast over the years. The developed model helps to prevent asthma from happen by detecting the causes of asthma [32]. In 2018, the authors made a review study investigate, and compare between different infrared carbon dioxide sensors specifications, this study also gives the capnogram features that use to develop an asthma-monitoring device. The keywords used was (infrared sensor, CO2 sensor, capnograph, CO2 measurement, capnogram, and asthma detection) by using PubMed, Google Schooler, scoups and another search engine. The COMET (COMET is the name of the company made the sensor) carbon dioxide sensor distinguish as the most suitable and reliable sensor proper for asthma diagnosis and monitoring according to this study, this device was chosen from other based on its weight (7 g), warm-up time (2-15s), output range (0-99 mmHg), and response time (0.028 s). Furthermore, to screen asthma severity level, slope and time-frequency components must be measured from alveolar phase and complete breath cycle respectively [33]. In 2018, the authors made a Narrative Review on the Applications of End-Tidal Carbon Dioxide (ETCO2) Monitoring in Emergency room was made by using PubMed, Scopus, Cochrane Databases, and other search engine by using keywords like emergency department monitoring, ETCO2, and critical monitoring. In this study capnography was use to measure many clinical cases. It’s use to measure ETCO2 as an precise method that use to help in emergency cases. But this device is not used in all emergency cases and not used regularly. it’s usually used in patients under sedation (Anesthesia) or connected to mechanical ventilation, patient suffering from shock, heat dropping due to pulmonary disease, patient who suffering from metabolic disorder, or has trauma. Which is means that capnography considered as an essential tool in emergency department [34].
3. Methodology
Depending on the introduction, we propose a review for home-based and handheld monitoring system capnograph device [3, 35, 36]. The main objective of this study is to show the best device that has the ability to monitor asthma in the home environment and assists in the progression and handling of asthma which is the COMET CO2 sensor [5, 37, 38]. Till now, too many studies have made huge steps towards the monitoring and detection of cardio-respiratory conditions and disorders, specifically, asthma, this is done by using a capnography [32, 39]. The schematic block diagram in figure 2 shows the proposed system in the present study for monitoring asthma and also it determines the lung disease in asthmatics.
This system measures several parameters because the device is dealing with air so the Humidity, pressure, Airflow, voltage, temperature, and CO2 concentration sensors represent the main feature of the air breathed that need to be monitor for example if the humidity of the air was too high it will cause suffocation of the patient and increase the illness, each active sensor then connected to a microcontroller (Raspberry Pi was use because the code of the program was written by python language to made the program more freely to edited from other language) which is supplied by line power or battery then the processed signal display on mobile communication which has GPS locater, Bluetooth module and GSM (Global System for Mobile Communications). The data that sent to mobile communication module interfaced to the specialist to make the correct examination in medications and treatment for the patient. This monitoring system is friendly to use by patient, economic. The CO2 sensor module in which the signal conditioning (the electronic circuit that use to enhance and manipulate the signal to the desire output needed from the next process) down is shown in figure 3 [40-42].
The microcontroller also sends the data to CO2 gas concentration to determine the concentration of the exhaled CO2 and then display it on LCD monitor.
4. Results
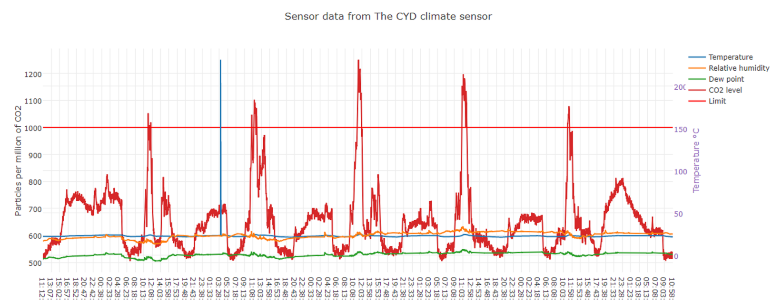
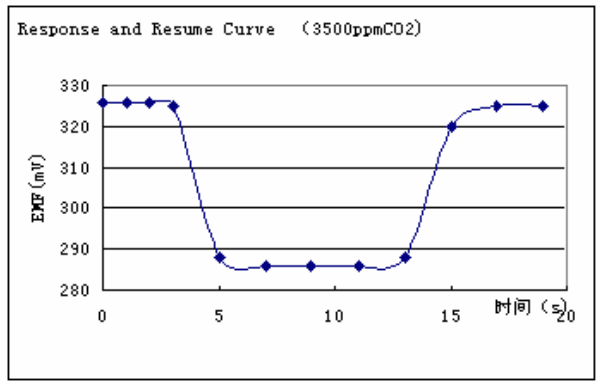
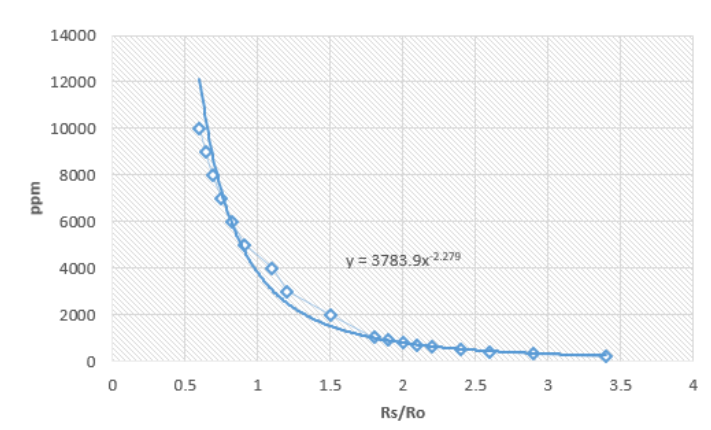
As the aim of this study is to make a full review and comparison among the infrared CO2 sensors multiple specifications and others to develop an efficient asthma monitoring device. As shown in Table 2 and 3 the specification of COMET CO2 sensor which indicate that this sensor is the most reliable sensor used to assess the asthma. Moreover, time-frequency components and the slope which measured from the overall respiratory cycle and alveolar phase; which is found the most important features to show the seriousness level of asthma. The feedback was done at a constant temperature (25°C) discovers that the carbon dioxide values are totally changed as (17,835.19-86,321.29) parts per million (ppm) whenever the pressure changed as (16.53-81.53) kPa. These measurements have. The sensors measurements are illustrated in figures (3), (4), and (5).
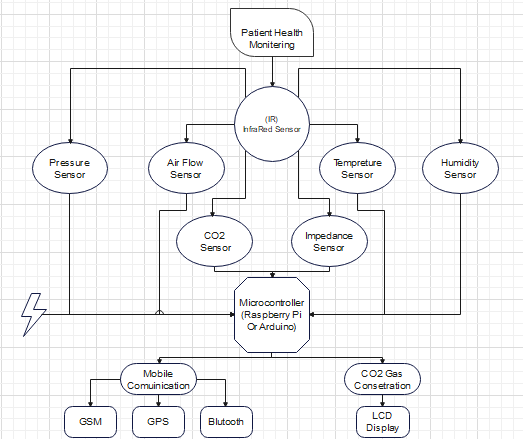
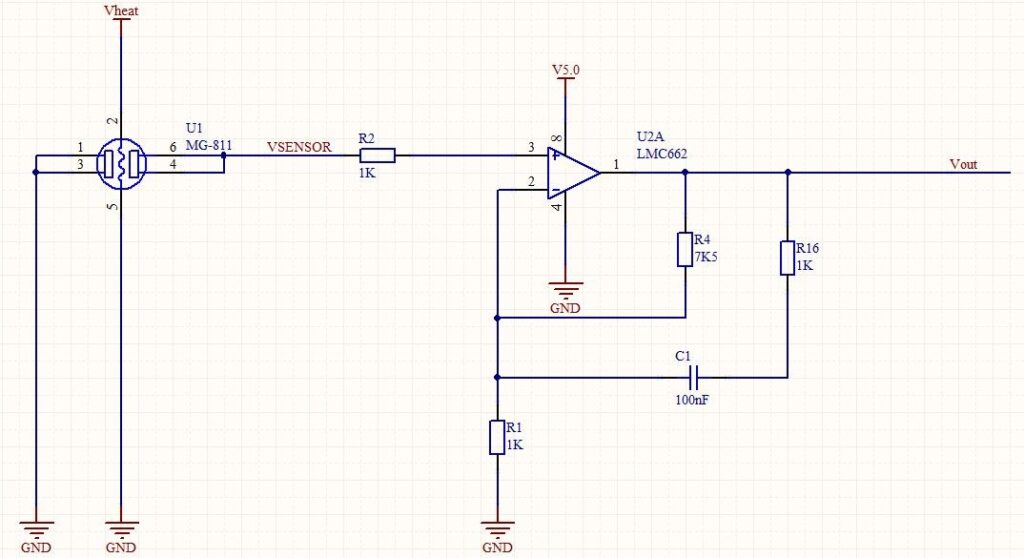
Table 2: CO2 Infrared Sensor Specifications [44, 45]
Sensor Parameter | Specifications |
Weight in gram | 7 g |
(Tr) Response Time | 0.028 s |
Pressure Output Range | 0-99 mmHg |
(Tw) Warm-up Time | 2-15 s |
The line graph responses of three different CO2 sensors show that the COMET I and II types are the best types of the CO2 sensors. In figure 4 these lines graph is color coded. the blue line represents the temperature which was fixed at 25°C, the orange line represents the relative humidity which is approximately between 14-24% of the air, the green line represents the Dew point between -7 to 0.8, The red line represents the CO2 level while the pink line represents the maximum limit can the result reach. In figure 5 represent the most turbulence area zoomed from figure 4 and show all the label with reading on the graph.
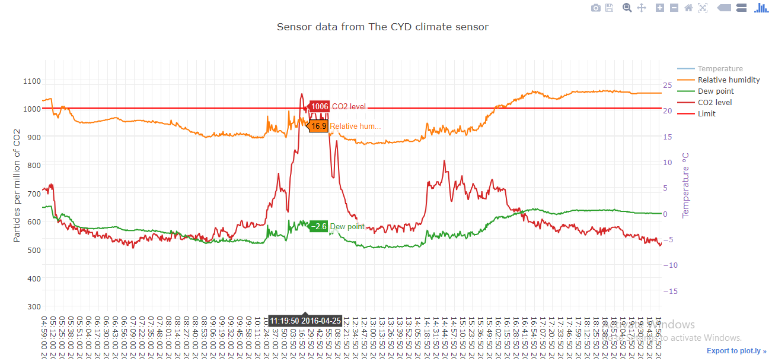
In figure 6 and 7 show the different between the line graph of real and digital CO2 sensors it shows that the real CO2 sensor react as a U shape curve while the digital CO2 sensor act as downward slope to infinity because in digital CO2 many parameters were neglected like the temperature and humidity.
Conclusion
The proposed paper gives overall investigations and also comparison between more than one research that were based on infrared CO2 sensors. There are many specifications should be taken in considerations like, Temperature at the operating time, weight of the device that will be held by the patient, voltage at the operating time, approximate cost of the device, time that take the device to response to the signal, the time that the device needs to warm-up, the pressure output range, and the applications of the device. It was clear from this study that both the COMET one and two, Digital carbon dioxide (EE893) sensors and carbon dioxide (27929) are the most accurate and efficient for creating a home-made asthma monitoring system. Furthermore, these sensors measured the inspired CO2, rate of respiration, ETCO2 (end-tidal carbon dioxide), and TIME OF inspiration and expiration Therefore, by using the equivalent CO2 sensors which is a light weight, hand-held, precise, and quantitative capnography device that designed and developed. for this reason, the lifetime of the pretended features when developing a canograph system or device should conform in future work.
Table 3: Different Types Infrared CO2 Sensors and their Specification [49-52]
Application | Carbon dioxide partial pressure, end tidal ETCO2, Respiration Rate, inspired carbon dioxide, Inspiration and Expiration time | alarm of over-limit Gas level; device; equipment of Environmental monitoring | transmitters Data loggers; Wireless; Handhelds; Demand controlled ventilation Building management; |
(Tr) Response Time (s) | 0.028 | >10 | 105 |
(Tw) Warm-up Time (s) | 2-15 | >20 | 15 |
Approx. Cost (in$) | 400 | 43.55 | 299 |
Weight/Size (Approx. in grams) | <7.0 | 4 | 10 |
Sensitivity/ Accuracy (%) | ±0.42% | High Sensitivity | 0-0.2%: < ±(0.005% at ±2% of measuring value) |
Operating Temperature (°C) | 5-55 | 0 to 70 | 40- to 60 |
Range (% CO2 ) | 0-13.8 | 0.035-1 | 0-0.2/0.5/1 |
Operating voltage | 5 | 6.5-12 | 4.75-7.5 |
CO2 Sensor | COMET-I, II | CO2 Sensor 27929 | Digital CO2 Sensor EE893 |
- M. S. Siobal, “Monitoring Exhaled Carbon Dioxide,” (in eng), Respir Care, vol. 61, no. 10, pp. 1397-416, Oct 2016.
- S. S. Pandya NK. (Updated 2022 Aug 29). Capnography And Pulse Oximetry. Available: https://www.ncbi.nlm.nih.gov/books/NBK539754/
- M. B. Jaffe, “Using the features of the time and volumetric capnogram for classification and prediction,” (in eng), J Clin Monit Comput, vol. 31, no. 1, pp. 19-41, Feb 2017.
- P. Ellwood et al., “The Global Asthma Network rationale and methods for Phase I global surveillance: prevalence, severity, management and risk factors,” (in eng), Eur Respir J, vol. 49, no. 1, Jan 2017.
- G. K. B.Abinayaa, B.Saranya, R.Gayathri, “An Intelligent Monitoring Device for Asthmatics using Arduino,” International Journal of Advanced Research in Electrical, Electronics and Instrumentation Engineering, vol. 5, no. 7, 2016.
- O. Enilari and S. Sinha, “The Global Impact of Asthma in Adult Populations,” (in eng), Ann Glob Health, vol. 85, no. 1, Jan 22 2019.
- S. C. Dharmage, J. L. Perret, and A. Custovic, “Epidemiology of Asthma in Children and Adults,” (in eng), Front Pediatr, vol. 7, p. 246, 2019.
- I. f. P. Health, “The Third National Health and Morbidity Survey (NHMS III),” vol. 1, M. Ministry of Health, Ed., ed, 2006.
- C. Nickson. (2020). Capnography Waveform Interpretation. Available: https://litfl.com/
- K. Tan Teik and M. B. Malarvili, “Analysis of capnography for asthmatic patient,” in 2009 IEEE International Conference on Signal and Image Processing Applications, 2009, pp. 464-467.
- M. Cully, M. Treut, A. D. Thompson, and A. D. DePiero, “Exhaled end-tidal carbon dioxide as a predictor of lactate and pediatric sepsis,” (in eng), Am J Emerg Med, vol. 38, no. 12, pp. 2620-2624, Dec 2020.
- David A. Wampler. (2011). Capnography as a Clinical Tool.
- B. A. a. A. A. Raja, “Smart Portable Monitoring Device for Asthma Patients,” Middle-East Journal of Scientific Research, vol. 24 (S1), no. 1990-9233, 2016.
- E. Y. Rifky Maulana Fuadi, Bambang Guruh Irianto,Abhishek Mishra, “Design of Carbon Dioxide Levels Measurement in Human Expiration Using EtCO2 Capnography Method,” Indonesian Journal of Electronics, Electromedical Engineering, and Medical Informatics, vol. vol. 5, pp. 45-47, 2023.
- G. Casey, “Capnography: monitoring CO2,” (in eng), Nurs N Z, vol. 21, no. 9, pp. 20-4, Oct 2015.
- E. Razi, G. A. Moosavi, K. Omidi, A. Khakpour Saebi, and A. Razi, “Correlation of end-tidal carbon dioxide with arterial carbon dioxide in mechanically ventilated patients,” (in eng), Arch Trauma Res, vol. 1, no. 2, pp. 58-62, Summer 2012.
- S. Fan, Z. Li, K. Xia, and D. Hao, “Quantitative and Qualitative Analysis of Multicomponent Gas Using Sensor Array,” vol. 19, no. 18, p. 3917, 2019.
- T. Nowicki, Z. Jamal, and S. London, “Carbon Dioxide Detector,” in StatPearlsTreasure Island (FL): StatPearls Publishing Copyright © 2023, StatPearls Publishing LLC., 2023.
- R. H. Friesen and M. Alswang, “End-tidal PCO2 monitoring via nasal cannulae in pediatric patients: accuracy and sources of error,” (in eng), J Clin Monit, vol. 12, no. 2, pp. 155-9, Mar 1996.
- R. J. Mieloszyk et al., “Automated quantitative analysis of capnogram shape for COPD-normal and COPD-CHF classification,” (in eng), IEEE Trans Biomed Eng, vol. 61, no. 12, pp. 2882-90, Dec 2014.
- M. B. Jaffe, “Mainstream or Sidestream Capnography?,” Medical Device depot inc.
- A. Conway, C. Douglas, and J. R. Sutherland, “A systematic review of capnography for sedation,” (in eng), Anaesthesia, vol. 71, no. 4, pp. 450-4, Apr 2016.
- M. E. Stone, Jr. et al., “End-tidal CO(2) on admission is associated with hemorrhagic shock and predicts the need for massive transfusion as defined by the critical administration threshold: A pilot study,” (in eng), Injury, vol. 48, no. 1, pp. 51-57, Jan 2017.
- K. L. Chan, M. T. V. Chan, and T. Gin, “Mainstream vs. sidestream capnometry for prediction of arterial carbon dioxide tension during supine craniotomy,” vol. 58, no. 2, pp. 149-155, 2003.
- C. Sumner. (2023). Capnography.
- O. C. Murat Pekdemir, Serkan Yılmaz, Elif Yaka and Melih Yuksel, “Disparity Between Mainstream and Sidestream End-Tidal Carbon Dioxide Values and Arterial Carbon Dioxide Levels,” Respiratory Care, vol. 58(7), no. 1152-1156, 2013.
- M. Sakuraya et al., “Accuracy evaluation of mainstream and sidestream end-tidal carbon dioxide monitoring during noninvasive ventilation: a randomized crossover trial (MASCAT-NIV trial),” Journal of Intensive Care, vol. 10, no. 1, p. 17, 2022/03/18 2022.
- T. M. G. P. Room. (2023). Differences between Mainstream and Sidestream Capnography. Available: http://www.meditech-egypt.com/Education/
- Capnomed, “Mainstream EtCO2 MODULE,” ed, 2018.
- F. P. A.L.Balogh, G.H.Fodor, J.Tolnai, Z.Csorba and B.Babik, “Capnogram slope and ventilation dead space parameters :comparison of mainstream and sidestream techniques,” BritishJournalofAnaesthesia, 2016.
- S. Zou, J. Zhang, and Z. Zhang, “A novel approach for predicting microbe-disease associations by bi-random walk on the heterogeneous network,” PLOS ONE, vol. 12, no. 9, p. e0184394, 2017.
- S. Malik, O. P. Singh, A. Nurifhan, and M. Balakrishnan, Portable Respiratory CO2 Monitoring Device for Early Screening of Asthma. 2016.
- O. P. Singh and M. Balakrishnan, “Review of Infrared Carbon-Dioxide Sensors and Capnogram Features for Developing Asthma-Monitoring Device,” Journal of Clinical and Diagnostic Research, vol. 12, pp. OE01-OE06, 10/01 2018.
- H. Aminiahidashti, S. Shafiee, A. Zamani Kiasari, and M. Sazgar, “Applications of End-Tidal Carbon Dioxide (ETCO2) Monitoring in Emergency Department; a Narrative Review,” (in eng), Emerg (Tehran), vol. 6, no. 1, p. e5, 2018.
- O. P. Singh, I. M. El-Badawy, and M. Balakrishnan, “Design and validation of a handheld capnography device for cardiopulmonary assessment based on the Arduino platform,” Journal of Innovative Optical Health Sciences, vol. 14, 04/27 2021.
- D. F. T. Morais, G. Fernandes, G. D. Lima, and J. J. P. C. Rodrigues, “IoT-Based Wearable and Smart Health Device Solutions for Capnography: Analysis and Perspectives,” vol. 12, no. 5, p. 1169, 2023.
- B. E. Himes, L. Leszinsky, R. Walsh, H. Hepner, and A. C. Wu, “Mobile Health and Inhaler-Based Monitoring Devices for Asthma Management,” (in eng), J Allergy Clin Immunol Pract, vol. 7, no. 8, pp. 2535-2543, Nov-Dec 2019.
- J. T. Oduor, “A Model for home-based remote monitoring of asthmatic patients “, Strathmore University, 2017.
- J. Prinable, P. Jones, C. Thamrin, and A. McEwan, A novel hardware implementation for detecting respiration rate using photoplethysmography. 2017, pp. 726-729.
- H. Abderrahim, M. Berrebia, A. Hamou, H. Kherief, Y. Zanoun, and K. Zenata, “Measure of carbon dioxide using a gas sensor of a semiconductor type based on tin dioxide (SnO 2 ),” Journal of Materials and Environmental Science, vol. 2, 01/01 2011.
- V. Rotar, “HEALTH STATE MONITORING SYSTEM DESIGN,” MASTER OF SCIENCE, Electrical and Electronic Engineering, California State University, Sacramento, 2012.
- A. A. a. A. F. P. C. Bambang Dwi Kuncoro, “Smart Wireless CO2 Sensor Node for IoT Based Strategic Monitoring Tool of The Risk of The Indoor SARS-CoV-2 Airborne Transmission,” MDPI, vol. 12, 2022.
- s. electronics. MG-811 CO2 Sensor Module. Available: https://sandboxelectronics.com/?p=147
- R. J. Asher, “Capnographic Analysis for Disease Classification,” Master of Science, Electrical and Computer Engineering, , Carnegie Mellon University, 2012.
- S. Ramanathan, M. B. Malarvili, and S. C. B. Gopinath, “Assessing respiratory complications by carbon dioxide sensing platforms: Advancements in infrared radiation technology and IoT integration,” Arabian Journal of Chemistry, vol. 16, no. 2, p. 104478, 2023/02/01/ 2023.
- K. Nonami et al., “DEVELOPMENT OF MINE DETECTION ROBOT COMET-II AND COMET-III,” The Proceedings of the International Conference on Motion and Vibration Control, vol. 6.1, pp. 449-454, 01/01 2002.
- plot.ly. (2023). Sensor data from The CYD climate sensor. Available: https://rawgit.com/Rovanion/comet-sensor/master/examples/2016-04-25%20-%202016-04-30.html
- O. P. Singh, T. A. Howe, and M. B. Malarvili, “Real-time human respiration carbon dioxide measurement device for cardiorespiratory assessment,” Journal of Breath Research, vol. 12, no. 2, p. 026003, 2018/01/03 2018.
- E. B. Mary Kay Bates, Molly Love Parrucci, and Douglas Wernerspach, “Evaluating Infrared Carbon Dioxide Sensors for 21st Century Cell Culture: Introducing the Thermo Scientific IR180Si Infrared CO2 sensor,” Thermo Fisher Scientific Inc, 2014.
- L. Mendes, N. Ogink, N. Edouard, H. J. Dooren, I. Tinôco, and J. Mosquera, “NDIR Gas Sensor for Spatial Monitoring of Carbon Dioxide Concentrations in Naturally Ventilated Livestock Buildings,” Sensors, vol. 15, pp. 11239-11257, 05/13 2015.
- H. Rehouma, R. Noumeir, S. Essouri, and P. Jouvet, “Advancements in Methods and Camera-Based Sensors for the Quantification of Respiration,” (in eng), Sensors (Basel), vol. 20, no. 24, Dec 17 2020.
- Masimo. (2023). Capnography and Gas Monitoring Solutions. Available: https://www.masimo.com/technology/ventilation-and-respiration/capnography/
No related articles were found.