Numerical Analysis of Riverbank Slope Stability Considering Rainfall, Vegetation and Water Level Fluctuation
 , Ji-Peng Wang1
(This article belongs to the Section Civil Engineering (CVE))
Export Citations
Cite
Ahsan, M. T. , Wang, J. , Sibgatullovich, S. M. , Dadda, A. and Salokhiddinovich, S. F. (2024). Numerical Analysis of Riverbank Slope Stability Considering Rainfall, Vegetation and Water Level Fluctuation. Journal of Engineering Research and Sciences, 3(4), 20–31. https://doi.org/10.55708/js0304003
Md Tanvir Ahsan, Ji-Peng Wang, Saidov Mirzo Sibgatullovich, Abdelali Dadda and Salikhov Farid Salokhiddinovich. "Numerical Analysis of Riverbank Slope Stability Considering Rainfall, Vegetation and Water Level Fluctuation." Journal of Engineering Research and Sciences 3, no. 4 (April 2024): 20–31. https://doi.org/10.55708/js0304003
M.T. Ahsan, J. Wang, S.M. Sibgatullovich, A. Dadda and S.F. Salokhiddinovich, "Numerical Analysis of Riverbank Slope Stability Considering Rainfall, Vegetation and Water Level Fluctuation," Journal of Engineering Research and Sciences, vol. 3, no. 4, pp. 20–31, Apr. 2024, doi: 10.55708/js0304003.
The occurrence of landslides and slope instability along riparian zones has been a recurrent phenomenon of substantial concern globally. This paper presents a comprehensive investigation of riverbank slope stability utilizing soils from the Yellow River in China, with a particular emphasis on the effects of water level fluctuations, precipitation, and vegetation. The research examines the interplay of multiple factors influencing slope stability by integrating empirical data from laboratory testing with numerical analysis using Plaxis3D. Salient findings indicate that vegetation significantly enhances riverbank slope stabilization, especially during precipitation events, and that water level fluctuations profoundly impact the mechanical behavior and integrity of riverbank slopes, particularly during rapid drawdown stages. The study underscores the significance of these aspects in riverbank protection and infrastructure development. Despite the rigorous methodology employed, the work acknowledges limitations in numerical modeling and laboratory test scale, highlighting the necessity for more advanced research in geotechnical engineering.
1. Introduction
Slope stability is a widespread and essential topic in engineering fields. Landslides and debris flows caused by slope instability often result in significant socioeconomic consequences and a significant loss of life [1]. The stability of riverbank slopes is crucial for maintaining the natural balance of riverine ecosystems and protecting human infrastructure located near streams and rivers. The gradual wearing away of riverbanks in multiple locations has a growing influence on the livelihoods of those who live near these sites. The stability of a slope can be influenced by factors such as the shape of the embankment, changes in water levels, and the properties of the soil [2]. The influencing factors of slope instability mainly include internal factors and external (induced) factors. Among them, internal factors can be summarized as geological factors, slope rock and soil properties, slope shape, groundwater, etc.; external factors mainly include climatic conditions (rainfall, temperature), earthquakes, human activities, etc. [3–5]. Regarding the influence of slope stability, various factors do not act independently, but are interrelated, promote each other, and can even transform into each other under certain conditions.
The stability of riverbank slopes in China, particularly along the Yellow and Yangtze Rivers, is profoundly influenced by precipitation and water level drawdown. Research has indicated that these conditions can precipitate landslides, especially in the Three Gorges Reservoir region [6]. Reservoir levels and precipitation have a significant impact on landslide stability, with fluctuations in reservoir levels being the primary influencing factor [7]. The reactivation of significant landslides caused by changes in reservoir levels has been documented, such as the Dasha landslide [8]. An analysis has been conducted on the weakening of soil sliding zones in accumulation landslides produced by rainfall infiltration, emphasizing the gradual development of failure in such scenarios [9].
Precipitation is a primary driver of slope instability [10], impacting riverbank stability through erosion, pore water pressure changes, and soil saturation [11]. Intense or prolonged rainfall events can trigger landslides and slope failures, compromising the structural integrity of riverbanks [12]. The temporal and spatial distribution of precipitation, as well as antecedent soil moisture conditions, significantly affect the susceptibility of riverbanks to instability. Analyzing the rainfall patterns and their correlation with slope failures is crucial for developing predictive models and early warning systems [13].
A range of physical model experiments have been conducted to investigate the failure mechanisms of soil slopes. Rawat [14] studied the behavior of nailed soil slopes under surcharge loading, finding that the inclination of the nails significantly influenced the load carrying capacity. In [15], the authors conducted centrifuge model tests to analyze the deformation and failure processes of soil slopes, introducing the concept of a shear zone to describe the failure process. The research in [16], showed the importance of considering the stability of unsaturated soil slopes under random rainfall patterns. Since field tests are usually expensive and take a long time, some scholars use indoor model tests to study landslides. Among them, some scholars conducted centrifuge model tests through self-developed centrifuge airborne rainfall simulation devices to study slope stability under rainfall conditions. In [15], the researchers further explored the mechanisms of gradual riverbank collapses, emphasizing the role of seepage exit gradient and the development of partial infiltration failures. A systematic review by [17], identified various control practices for soil erosion in Asian agricultural land, including those related to rainfall and soil slope. In [18], the authors conducted a study on slopes with and without vertical joints. Three types of indoor physical model tests were conducted to study the effects of different rainfall patterns and different slope structures on the deformation and failure process. In [19], the authors took the Pengshan landslide in Zhejiang Province as a prototype and obtained the influence of rainfall intensity and weak interlayer thickness on slope stability based on experimental monitoring data such as pore pressure, earth pressure and slope deformation.
Vegetation plays a dual role in riverbank stability. On one hand, plant roots contribute to slope stabilization by binding soil particles and enhancing cohesion [20]. On the other hand, vegetation can influence slope stability negatively if it impedes water drainage or introduces additional loads during extreme weather events. The type, density, and health of vegetation are critical factors in understanding their impact on riverbank stability [21]. Incorporating vegetation dynamics into stability models is essential for accurate assessments of the overall stability conditions. Various studies have examined the influence of vegetation on the stability of soil slopes. In [22] and [23], the authors both highlight the dual role of vegetation in influencing slope stability, through changes in soil moisture and root reinforcement. In [24] and [25], the authors further emphasize the mechanical and hydrological effects of vegetation, with Cecconi [24] specifically focusing on the positive mechanical effect of deep-rooted grass plants. In [26], the authors highlighted vegetation enhances rainfall infiltration and decreases runoff, reducing slope stability and surficial erosion. Plant transpiration induces higher suctions and hence slope stability. The effect of vegetation in creating dryer soil conditions is more significant than the orientation effect. These studies collectively underscore the significant potential of vegetation in stabilizing soil slopes, and the need for further research to develop reliable field data and models to support this.
Several studies have examined the stability of riverbank slopes using numerical analysis. In[27] and [2], the authors employed finite element methods to evaluate the influence of water level fluctuations and soil characteristics on slope stability. Zaw’s research concentrated on rapid drawdown, whereas Haque’s study encompassed different embankment conditions. In a study on a riverbank in Malaysia, GeoStudio was employed to model the riverbank based on borehole log reports and other data. The findings highlight that drawdown events significantly impact slope riverbank stability, as evidenced by the fluctuating Factor of Safety values during and after these events [28]. A new contact element model is introduced to simulate the contact friction state on the slide surface, which led to a more accurate analysis of slope stability [29]. Li furthered this work by examining the influence factors, failure modes, and dynamic stability of layered rock slopes under seismic action [30].
A number of studies have utilized both Limit Equilibrium Method (LEM) and Finite Element Method (FEM) in analyzing slope stability. In [31], the authors discovered that the Limit Equilibrium Method (LEM) typically provides a greater factor of safety compared to the Finite Element Method (FEM). Both approaches exhibit a reduction in factor of safety as water level rises. In [32], the researchers pointed out the constraints of LEM and FEM for examining slopes containing clay-rock combinations, recommending the utilization of the discrete element approach as an alternative. In [33], the authors observed that FEM yielded higher factor of safety values compared to other approaches, however both methods showed identical critical slip surface shapes and locations. In [34], the authors suggested a technique that integrates Finite Element Method (FEM) with Limit Equilibrium Method (LEM) to account for the impact of slope deformation on stability. Recent years have witnessed notable progress in the field of slope stability in civil engineering, especially in the enhancement of analysis methods. In [35], the authors discusses the development of deterministic and probabilistic methods, whereas In [36], the authors contrasts the classical limit equilibrium method with the finite element method.
Understanding the complex interactions among the aforementioned factors is essential for effective riverbank management, environmental conservation, and risk mitigation. Studying methods to manage riverbank erosion is crucial for establishing priorities for erosion control and enhancing livelihood resilience. It is imperative to comprehend erosion management techniques and apply them in marginalized regions to aid riverine communities in combating riverbank erosion [37, 38].
This study focuses on the geotechnical aspects of slope stability, specifically targeting the alluvial silt slopes of the Yellow River. It encompasses an experimental setup and data collection, numerical modeling, and a comprehensive analysis of findings. The research is intended to contribute to the broader field of geotechnical engineering, specifically in the context of riverbank erosion and environmental conservation. This research aims to analyze riverbank slope stability by examining the impact of rainfall, vegetation, and water level fluctuations which in this case rapid drawdown. By using empirical data from laboratory experiments. This research seeks to use Plaxis3D for numerical analysis to connect theoretical models and empirical observations, in order to gain a thorough understanding of riverbank dynamics.
- This research will use laboratory experiments to quantitatively study the impact of rainfall on bare and vegetated soil slopes. The investigation includes replicating rainfall conditions and assessing their effect on soil slope. Using this empirical approach will improve the dependability of the numerical models created in Plaxis3D, resulting in a more precise forecast of slope performance in various rainfall conditions.
- The research also critically examines the impact of vegetation on slope stability. Laboratory tests will be conducted to analyze the impact of plants on soil strength and erosion resistance. The data obtained from the experiment will offer vital insights into the relationship between plant roots and soil under different environmental circumstances. This mission seeks to explore the strategic utilization of vegetation to strengthen riverbank slopes.
- Variations in water levels such as rapid drawdown in this case can greatly affect the mechanical characteristics of riverbank soils. The project aims to forecast the influence of variations on slope stability using Plaxis3D, providing valuable insights for riverbank management and infrastructure building near water bodies.
- Thorough integration of numerical and empirical data, the main objective of this research is to combine numerical modeling with empirical data. The project will provide a more detailed knowledge of the elements affecting riverbank stability by integrating the results of Plaxis3D simulations with laboratory observations. This comprehensive method will help create more precise and dependable predictive models.
2. Methodology
2.1. Laboratory Test
2.1.1. Slope model design
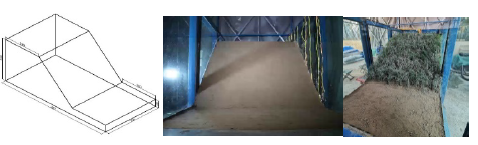
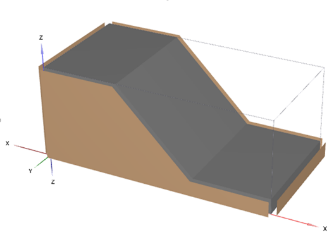
The Yellow River alluvial silt slope model was designed based on comprehensive experimental research purposes, research objects, model production operability and the layout of various monitoring devices. The design size of the slope model is 3m × 1.5m × 1.2m (length × width × height), the slope top platform is 1m long, and the slope ratio is 1:1. For vegetated slope the same dimensions has been used.
2.1.2. Rainfall Simulation System
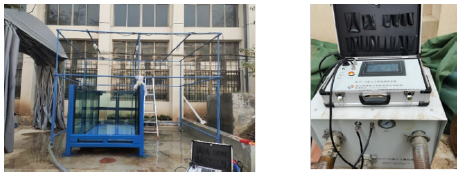
The NLJY-10 artificial simulated rainfall system, used in the experiment, consists of several components: a rainfall rack measuring 4.0m x 3.0m x 3.2m (length × width × height), a 1000L water tank with a control valve and inlet pipe, a self-priming pump with a 5.5m³/h flow rate, a 20m head, 2214r/min rotation speed, and 0.75KW power, and a network of water pipes. The system’s control center is fully automated, displaying rain intensity, operation status, pressure, countdown, and integrating all power control functions. It operates in DCS mode and can create rain pattern project files for automatic control of varying rain intensities over time. The system’s rain intensity can be adjusted with a precision of 5%, and it can simulate rain intensities ranging from 5mm/h to 240mm/h. For this research 30mm/h rainfall is used.
2.1.3. Monitoring System
The experimental setup for monitoring soil and slope stability includes various sensors and a data collector. TDR-315N Soil Volumetric Moisture Sensor to measures soil moisture content. TEROS-21 for continuously monitoring soil water potential in real-time. SPWP50 Pore Water Pressure Sensor to measures soil pore water pressure. SPS-BOX Soil Pressure Sensor, it measures earth pressure within a specified range and is capable of operating in saturated water conditions. CR350 Data Collector, A low-power device used for measuring sensors, analyzing, and storing data. A laser scanner is used to get the deformation map. Additionally, a camera with automatic continuous shooting is set to capture images every 8 seconds, providing real-time monitoring of slope deformation and damage during rainfall. This comprehensive setup allows for detailed observation and analysis of soil behavior and achieve real-time monitoring and recording of slope deformation and damage during rainfall.
2.1.4. Test preparation and process
Preparing and evaluating a slope model in soil engineering requires following a series of essential processes:
- Soil Sample Preparation: The soil is sieved to eliminate impurities and combined with water beyond the ideal moisture level to compensate for evaporation. The soil is uniformly soaked, mixed, packaged, and sealed for 48 hours to guarantee consistent moisture distribution.
- Slope Model Filling: The slope is built with 12 layers, each 10cm deep, employing a method of compacting layers to reach a density of 95%. Particular attention is given to limits, corners, and the installation of monitoring sensors. Following compaction, the slope is manually trimmed to a 1:1 slope ratio and then covered with plastic sheeting for 3 days to allow for moisture equalization.
- Test Process: Before testing, all 35 sensors and data collectors are checked for proper functioning. Cameras and lights are adjusted for optimal visibility, and the rainfall control system is set up. The test involves simulating 30mm/h rainfall until the slope becomes unstable and collapses, closely monitoring the process throughout.
2.2. Finite element modeling
Plaxis is a program that utilizes the finite element method to conduct numerical computations for geotechnical issues such as deformation, consolidation, stability, and flow studies. Plaxis allows users to simulate excavations, create structures, and apply loading and unloading to the soil in various phases, mirroring real-world projects [39]. The characteristics in Plaxis facilitate a well-suited modeling procedure. The laboratory model findings are being compared with the results obtained by PLAXIS3D. This process involves dividing the soil into smaller parts for analysis. The equilibrium equations can be solved from the nodes of the elements [40]. At each time step, the equations for individual smaller elements are solved and then combined to estimate the solution for the overall complex model. PLAXIS is a popular Finite Element Method (FEM) tool used for analyzing soils and groundwater movement [41]. It is known for being easy to use while also being able to simulate many real-world aspects. The research utilizes Plaxis3D for several purposes such as initial stress generation, plastic calculations, fully coupled flow-deformation analysis, and safety calculations. PLAXIS can perform a flow-deformation analysis to address the interaction between deformations, consolidation, and groundwater flow simultaneously in a single phase. The software is utilized to simulate the overall stability of the slope model. The objective is to assess the observation during the laboratory slope model test.
2.2.1. Geometry and mesh
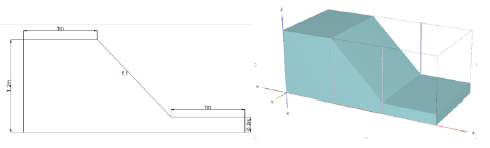
Following the completion of the slope model test, we have now transitioned into a critical phase where the acquired data is being applied for numerical modeling using Plaxis 3D. To provide a detailed perspective, the physical slope model, which served as the source of experiment data, was used for designing with precise dimensions. The overall structure measured 3 meters in length, 1.5 meters in width, and 1.2 meters in height. The slope top platform is 1m long. Another critical aspect of the model was its slope ratio, which was set at a 1:1 gradient. This ratio, indicating a 45-degree angle, was selected to study the slope stability under a relatively steep condition. The initial slope model in Plaxis is showed in the following figure,
Mesh creation occurs next in Plaxis when the modeling phase is finished and the input parameters are set. In Plaxis, the term “mesh” refers to the process of breaking down the modeled soil and structure into smaller, finite components to create a structure that resembles a grid. The finite element analysis is built upon this mesh. More processing power and time are needed for more detailed results. The graphic displays the created mesh is shown in figure 4.
2.2.2. Parameters
The Mohr-Coulomb material model is used for the soil and also the Van Genuchten function was used in Plaxis finite element analysis software to investigate soil behavior and water retention properties. The characteristics are obtained from the laboratory analysis of the Yellow River alluvial silt. The precise values for these parameters were entered into Plaxis and are outlined in the table 1. This method guarantees that the soil analysis is accurate and feasible.
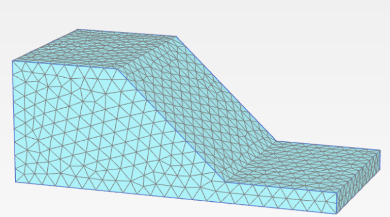
Table 1: Input parameters for the silty fine sand
Silty Fine Sand | ||
Property | Value | Unit |
Saturated Unit Weight, γsat | 20.51 | KN/m³ |
Dry unit weight, γd | 16.58 | KN/m³ |
Void ratio | 0.649 | |
Porosity | 39.388 | % |
Cohesion | 4.5 | KPa |
Friction angle | 34.7 | |
Permeability | 2.34144 | m/day |
Poisson’s ratio | 0.3 | |
Young’s Modulus | 32500 | KN/m² |
Rainfall | 30 | mm/h |
Saturation | 25 | % |
Node tensile strength | 29.72 | MPa |
2.2.3. Boundary condition
Establishing suitable boundary conditions is an essential step in the modeling procedure. In this particular case, where glass covers the slope box model, establishing suitable boundary conditions is also essential. To represent the enclosure of the model, five closed boundary conditions are used, which effectively restrict the flow of materials and forces through these barriers. This configuration closely resembles the situation that occurs in real life when the slope is limited inside a model box. Where the slope material interacts with the model box, an interface condition is also applied. In order to accurately simulate the interaction between the slope material and its container, which affects things like friction and movement at the border, this is crucial. Three boundary conditions are set on top of the slope model to imitate infiltration during rains. These prerequisites are essential for correctly simulating the effects of precipitation-derived water on soil, especially with regard to soil stability and behavior. Figure 5 displays the created model following the boundary condition.
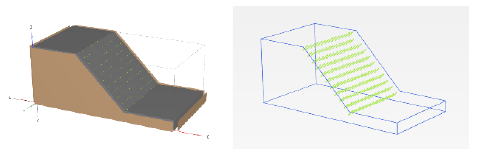
2.2.4. Vegetation inputs
During the modeling process, node-to-node anchors were used to replicate the existence of plants on the slope. This method effectively demonstrates how plant or tree roots can strengthen soil and enhance slope stability. 153 nodes were arranged in this configuration, each positioned 10 centimeters apart, with a tensile strength of 29.72 MPa for shrubs [42]. The nodes are elastoplastic model with an EA of 29.72*103 KN. During the calculations the maximum stress value on the node is 28.15 MPa, that’s below the plastic limit of the node anchors, indicating that the stress is within the material’s elastic range and thus within safe operational limits. This configuration of nodes, evenly spaced, guarantees a continuous depiction of vegetation along the incline. The node-to-node anchor system functions similarly to roots, offering extra support and resistance to soil movement. This is crucial for assessing how vegetation affects the slope’s stability. The nodes on the slope model are can be seen in the figure 6.
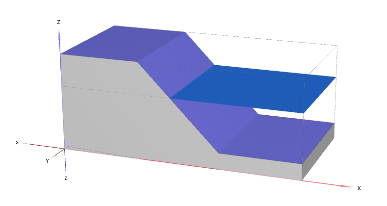
2.2.5. Drawdown condition
The Plaxis model simulates a specific water level fluctuation in the flow condition scenario to analyze the impact of rapid drawdown on the slope. The model is initially set with a water level of 0.8 meters to simulate a high-water scenario. This simulation focuses on the swift decrease of the water level, which is intended to rapidly go from 0.8 meters to 0.4 meters. The quick decline will last for around 6 hours, allowing for a realistic evaluation of the slope’s reaction to the sudden water level shift. This brief timeframe is crucial for grasping the immediate impact on the slope’s stability, since swift drawdown conditions can greatly change the stress distribution within the slope, possibly resulting in instability or failure. Plaxis model showing the water level is illustrated in the figure 7.
2.2.6. Phases
The Plaxis model was constructed in stages to simulate various situations and examine their effects on the slope’s stability:
- Initial Phase: The calculation type was set to ‘gravity loading’ for this phase. This setting is important for establishing the initial stress conditions in the model, simulating the natural gravitational forces acting on the slope.
- Safety Phase: This phase was included to determine the initial factor of safety. Setting up a safety phase helps in assessing the stability of the slope under the initial, undisturbed conditions.
- Rainfall Phase: The time for this phase was set to 0.3 days, simulating an 8-hour rainfall event. The calculation type was ‘Fully coupled flow deformation (FCFD)’, a crucial setting for realistically simulating the interaction between the soil and the water flow during heavy precipitation. The rainfall intensity was set at 0.72 meters per day (equivalent to 30mm per hour), to mimic a significant rainfall event.
- Safety Phase for Rainfall Analysis: Following the rainfall simulation, another safety phase was set to analyze the factor of safety of the model after the rainfall. This helps in understanding how the slope’s stability is affected by the added water from the rainfall. Ignored suction has been used for this phase.
- Drawdown Analysis: The calculation type for this phase was again ‘fully coupled flow deformation (FCFD)’. Precipitation was turned off, and the model was adjusted to simulate a water level of 0.8 meters. This setup is used to allow the model to experience drawdown by assigning a flow function that reduces the water head to 0.4 meters, replicating a rapid decrease in water level.
- Safety Phase for Drawdown: Finally, a safety phase was set to analyze the factor of safety for the drawdown analysis. Ignored suction has been used for this phase. This phase is critical for evaluating the stability of the slope post-drawdown, an essential aspect in understanding the impacts of rapid changes in water level on slope stability.
Each of these phases plays a vital role in comprehensively analyzing the different aspects that affect the stability of the slope, from initial conditions to extreme weather events and rapid environmental changes.
3. Results
3.1. Initial stage
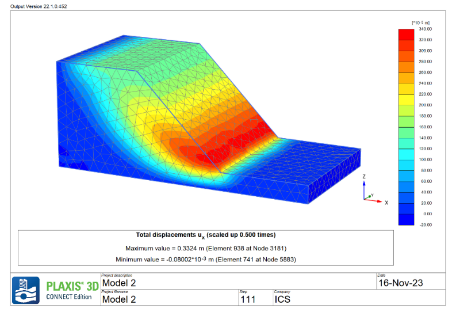
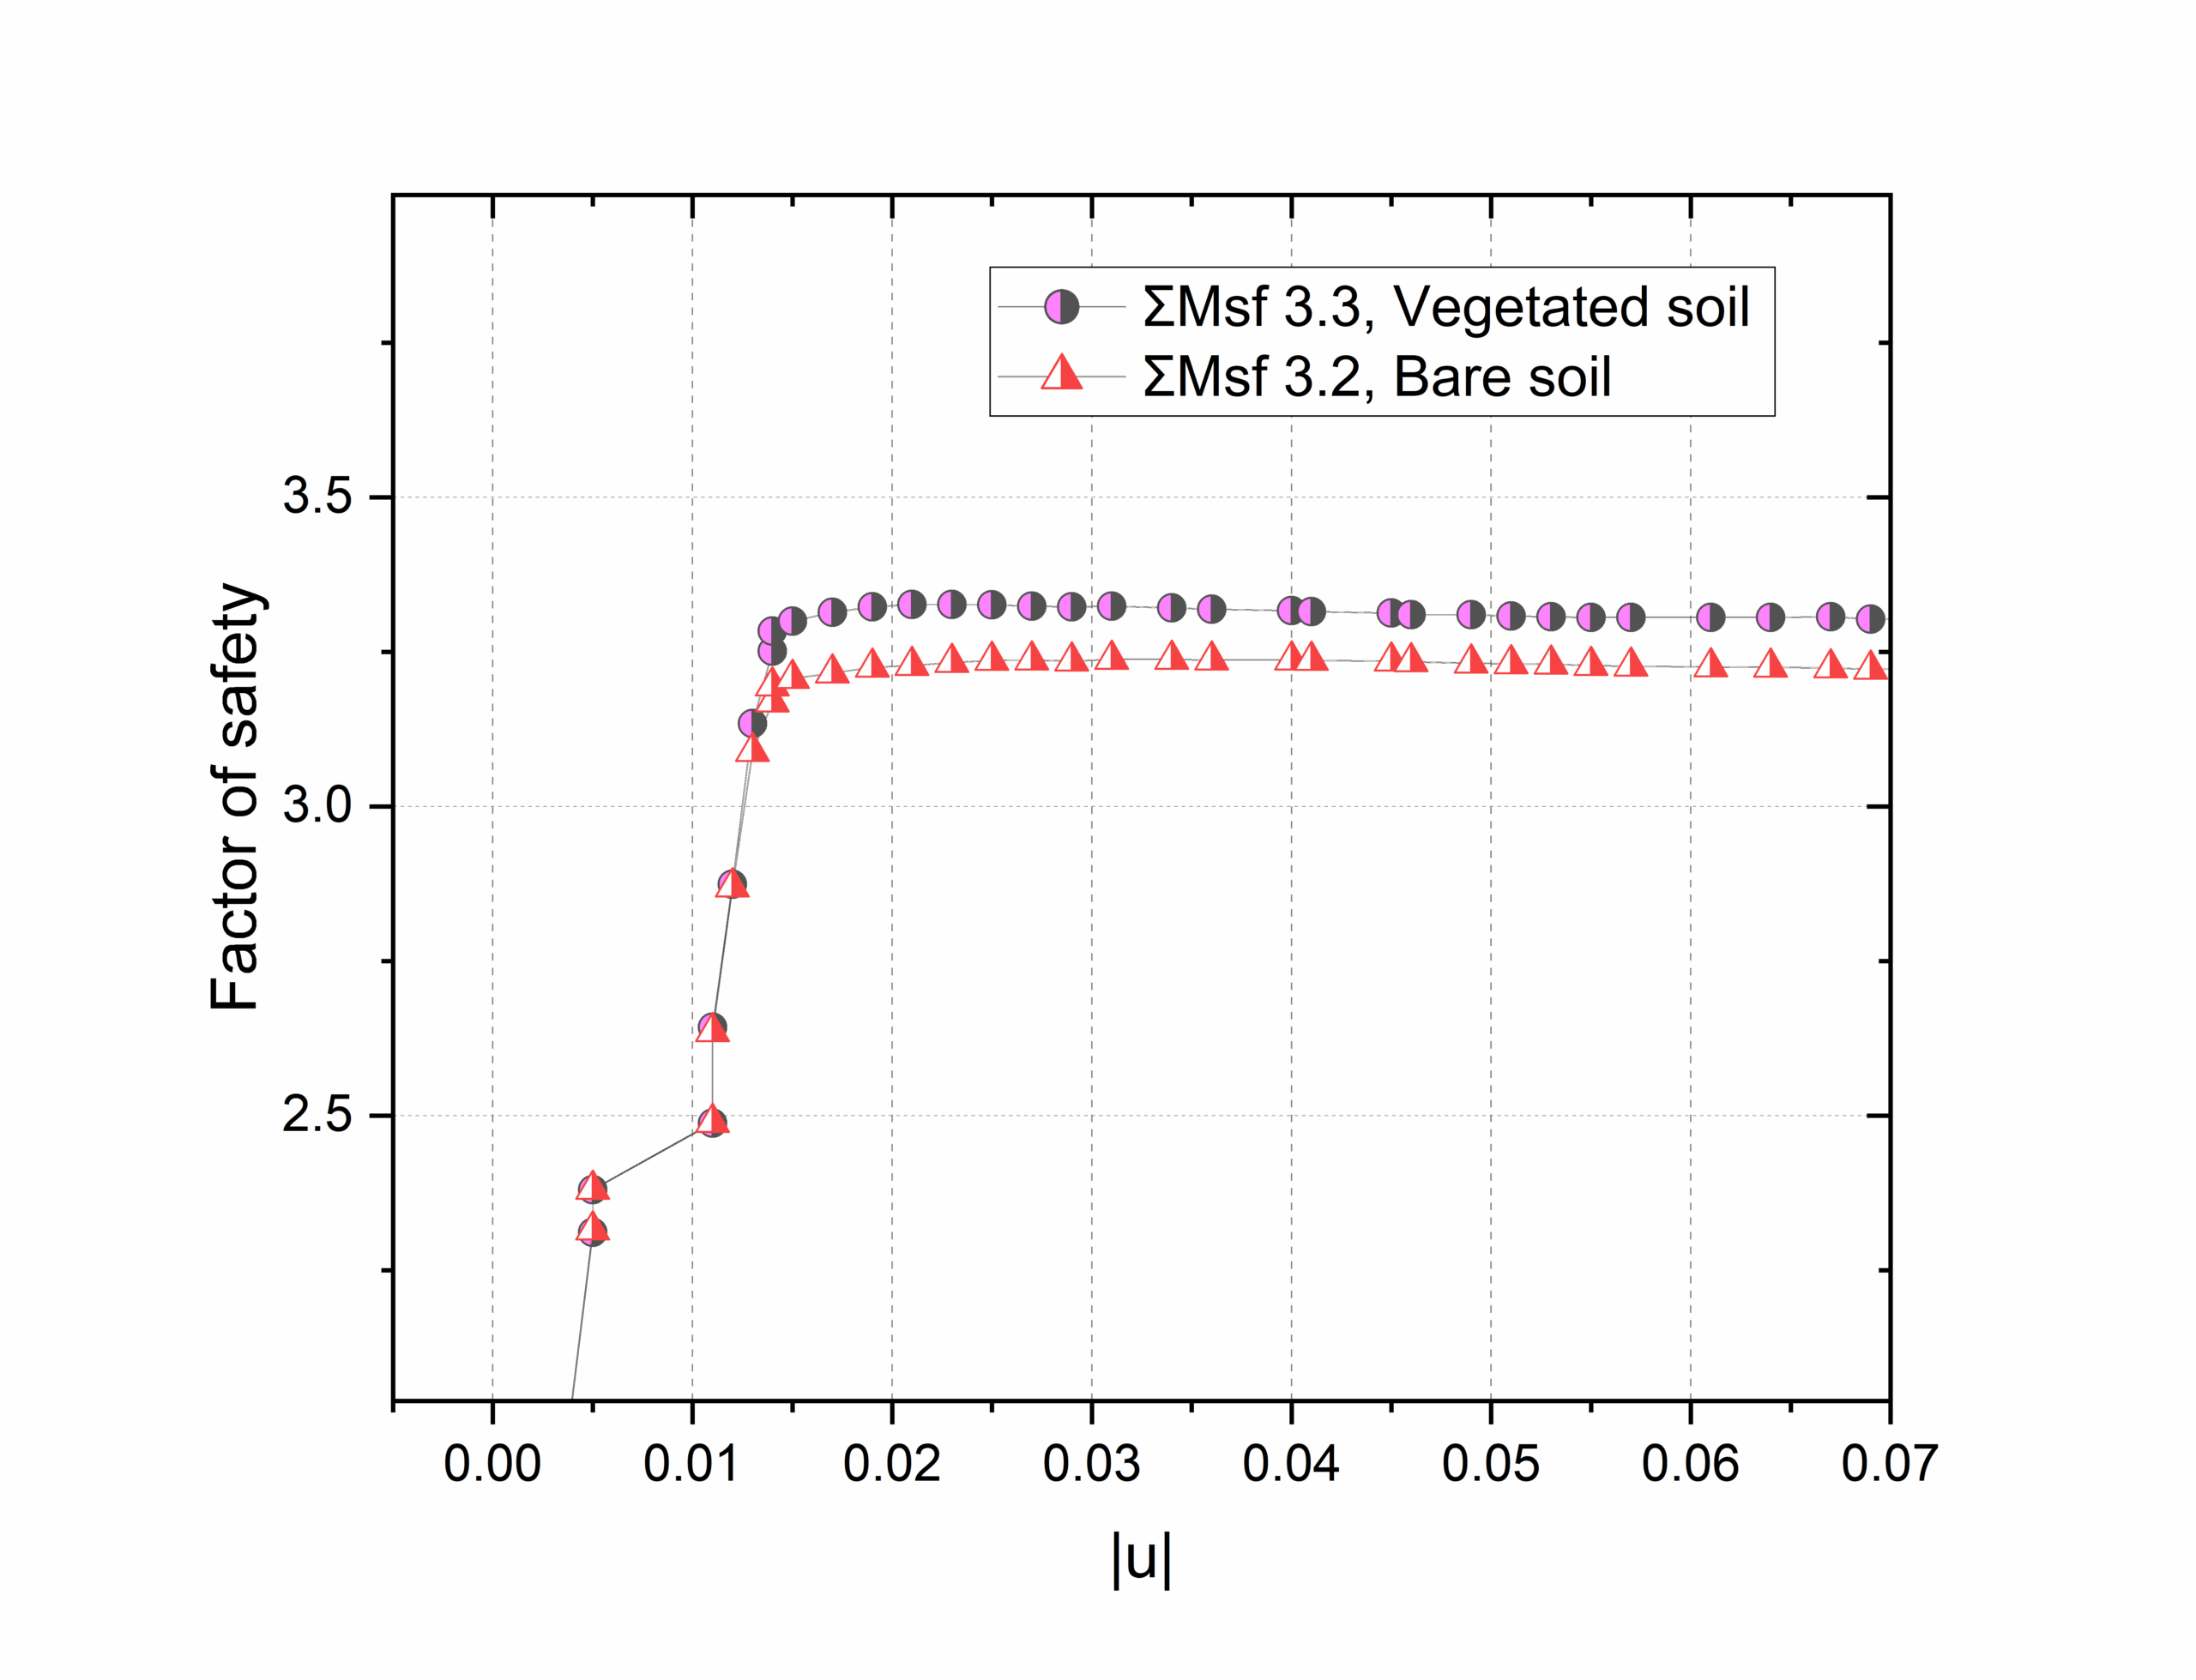
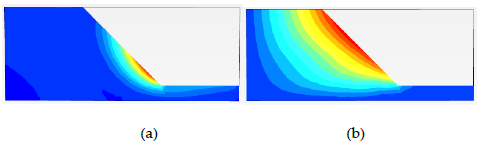
In the initial phase of the analysis, it is observed how the land is shifting or changing shape. The image clearly shows this happening at the bottom end of the slope. This is common because the toe of a slope often bears a lot of the load and is where movement typically starts if things are going to shift. It’s a critical zone where initial movements are most likely to be detected. Numerically, the factor of safety is calculated to be 3.22 with gravity loading. When assessing the vegetated slope, the analysis follows a similar pattern of stability. However, there is a slight increase in the numerical value of the factor of safety, recorded at 3.3. This increment, although marginal, suggests a slightly enhanced stability in the vegetated area compared to the non-vegetated section. The displacement prediction and safety factor comparison for the initial safety phase is show in the figure 8.
3.2. Effect of rainfall
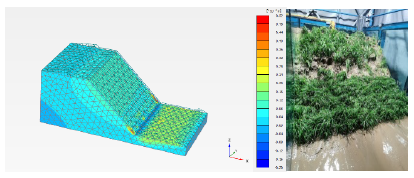
For bare soil, during the 30mm/h rainfall phase of the analysis, observations confirm the initial predictions: the displacement indeed begins at the slope toe. As the rainfall continues, this deformation isn’t just confined to the bottom; it gradually works its way up the slope. Can be seen in the figure 10. The maximum calculated displacement of the slope is 14.7mm. This progression is typical when the lower portions of a slope become saturated and less stable, causing the upper sections to also become more susceptible to movement. Although from the laser scanner, the observed displacement during the experiment were much larger varying from 10mm to 0.21m with a mean displacement of 82mm. This disparity suggests that while the Mohr-Coulomb model(MCM) provides a foundational understanding, it may benefit from refinement. The incorporation of a different behavior law, such as the Hardening Soil Model (HSM), could potentially offer a more precise evaluation of slope displacement. The HSM, which accounts for soil hardening under loading and unloading conditions, might provide a closer alignment between the numerical predictions and the observed data. A brief analysis with HS model has been done to confirm this theory. The maximum displacement in this analysis is 51.2mm, which is higher than the displacement calculated using the MC model. It is also close to the mean displacement observed with the laser scanner shown in figure 12.
The deviatoric strain diagram included in the figure 13 and 14 serves as a detailed visual cue for understanding the shear strain within the landslide body. Essentially, this diagram offers a map of how the soil within the slope is being distorted by the shear forces at play. The size of the shapes in the diagram correlates to the magnitude of shear strain—the larger the shape, the greater the strain. Meanwhile, the area covered by these shapes gives us an idea of where a potential landslide might occur, indicating the probable extent and reach of the sliding surface.
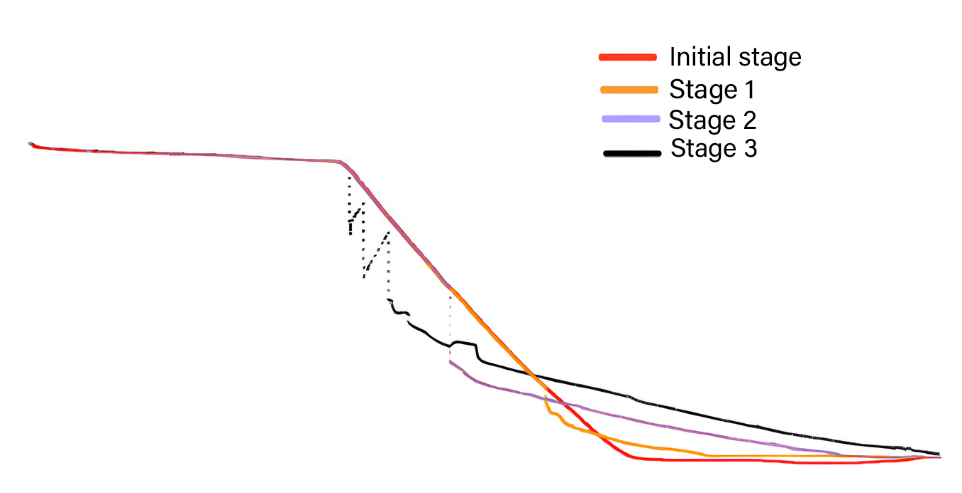
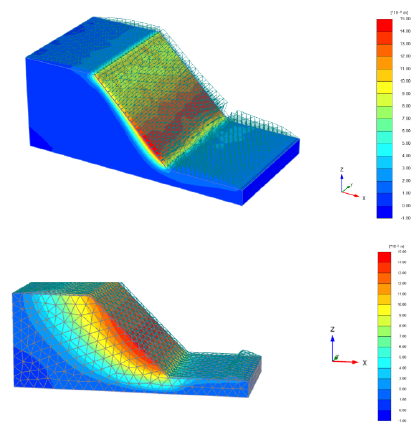
The patterns of displacement and deformation observed during the rainfall (FCFD) phase align with the actual erosion seen in the slope model box that can be seen in the laser scanner diagram from figure 12. The progression of movement starting from the slope toe and advancing upward reflects the real-life erosion process can be seen in figure 10. It is comparable with the beginning of the phase to the orange line in figure 12 that is beginning of the deformation observed during the experiment. The deviatoric strain diagram provided a predictive insight into the slope’s response to rainfall (shown in figure 15), which turned out to be consistent with the physical erosion seen in the model box.
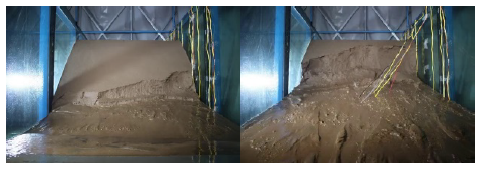
During the rainfall phase, the factor of safety is calculated to be 1.007 as shown in figure 16. A huge drop from the initial phase. the factor of safety value of 1.007 observed during the rainfall phase indicates that the slope is barely stable, existing in a state of near-equilibrium. This value represents a precarious balance, where the strength of the slope is only slightly greater than the applied stresses. Given this marginal stability, it’s understandable why a collapse occurred during the experiment. The rainfall introduces additional variables that negatively impact slope stability, such as reducing soil strength and increasing weight through saturation. These factors, combined with the already minimal safety margin, make the slope highly susceptible to failure.
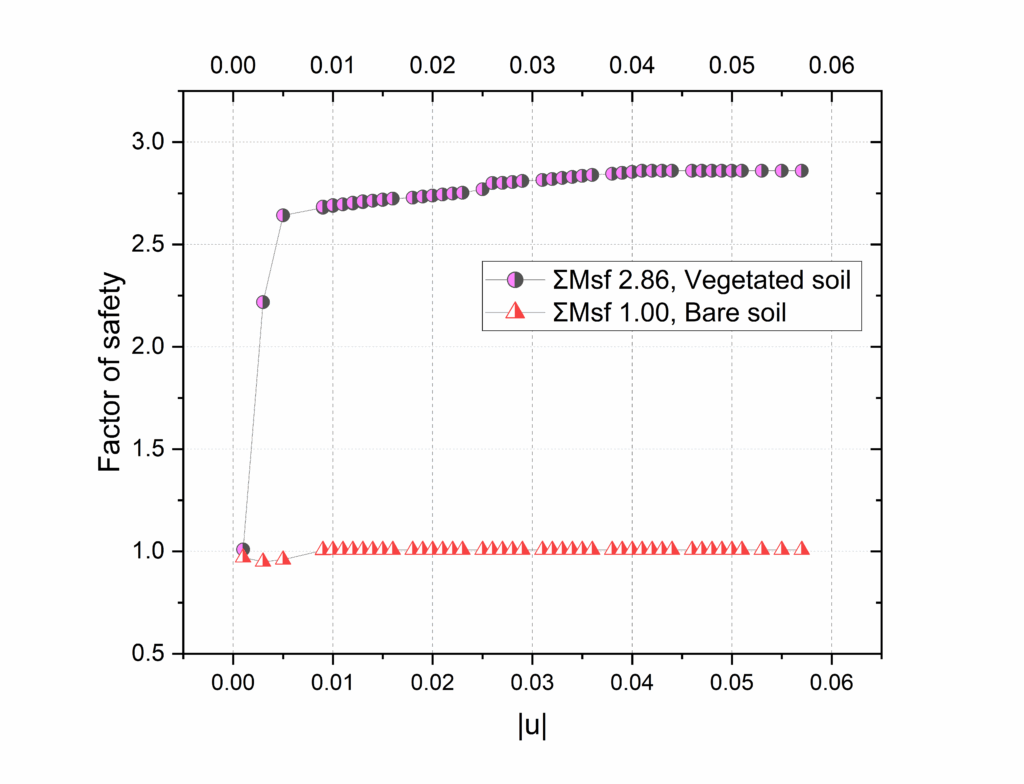
For vegetated soil, the numerical model indicated minimal displacement during the rainfall phase, which aligns well with the actual experimental observations. Also, the safety factor increased to 2.86. The calculated maximum displacement is 5.2mm, more than 64% decrease from the bare soil analysis. This suggests that the vegetation effectively reinforced the soil, through root systems that helped to bind the soil particles together and distribute the water flow, mitigating the impact of erosion.
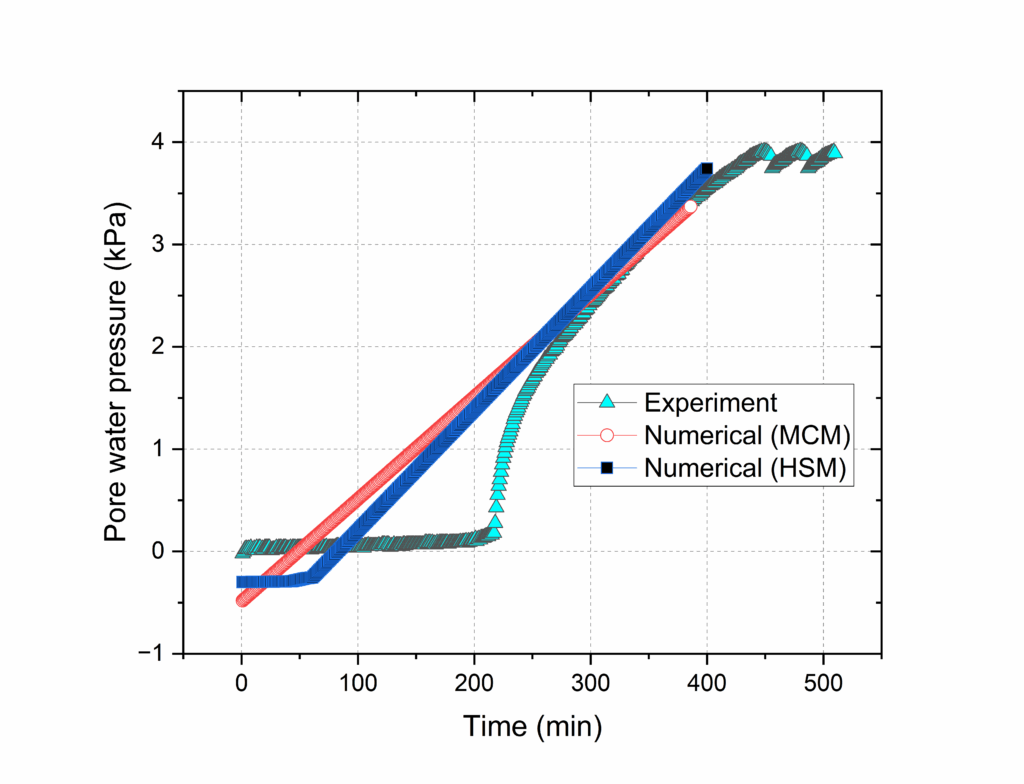
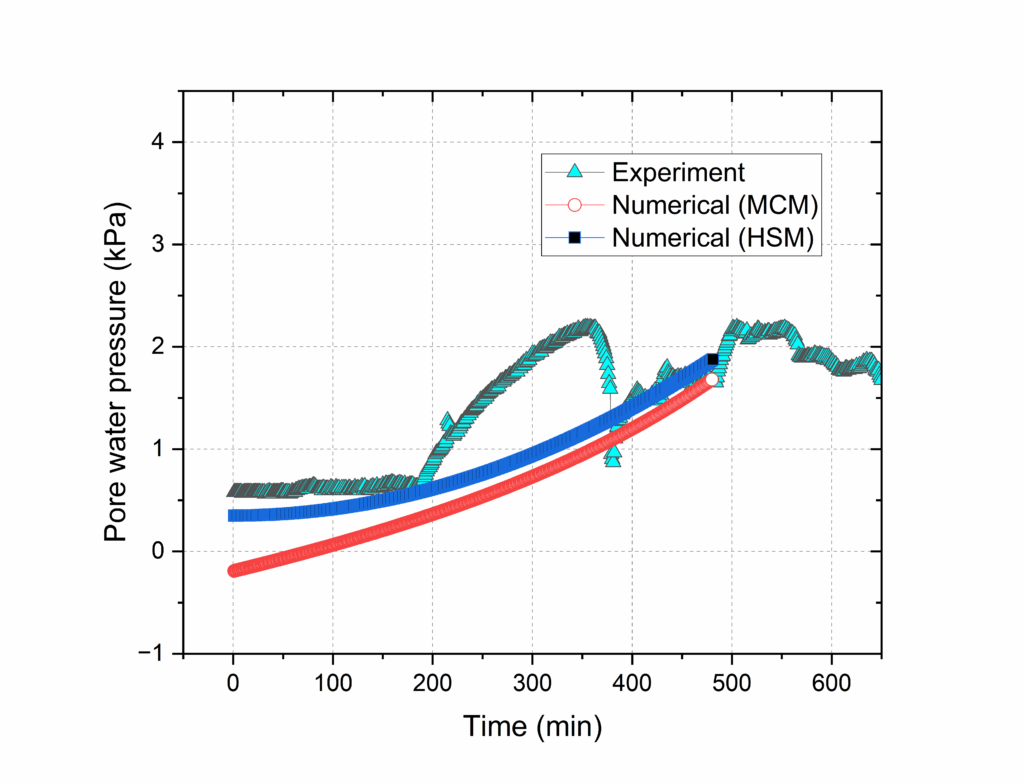
The study combined practical experiments and numerical analysis to explore the behavior of pore water pressure (PWP) at various locations. Utilizing sensors, PWP data was gathered, revealing noticeable variations across different points. Specifically, the maximum PWP values recorded by different sensors for bare soil were 4.5, 1.3, 3.8, 0.16, 0.06, 1.28, 0.04, and 0.45, respectively. A notable finding was that the sensor placed mid-slope registered a maximum PWP of 3.8 kPa. This result was particularly interesting because it closely aligned with the peak values predicted by our numerical model, shown in figure 18. For vegetated soil, the sensor data for maximum pwp were 4.89, 5.16, 6.11, 6.20, 1.75, 1.54, 2.14 and 1.36, respectively. The simulated value that closely aligned with the data is 1.68 kPa and 1.74 kPa, shown in figure 19. The observations also indicated that the numerical model tended to simplify the complexity of real-world data. This simplification was evident in the formation of a linear curve in the model, contrasting with the more varied readings from the physical sensors.
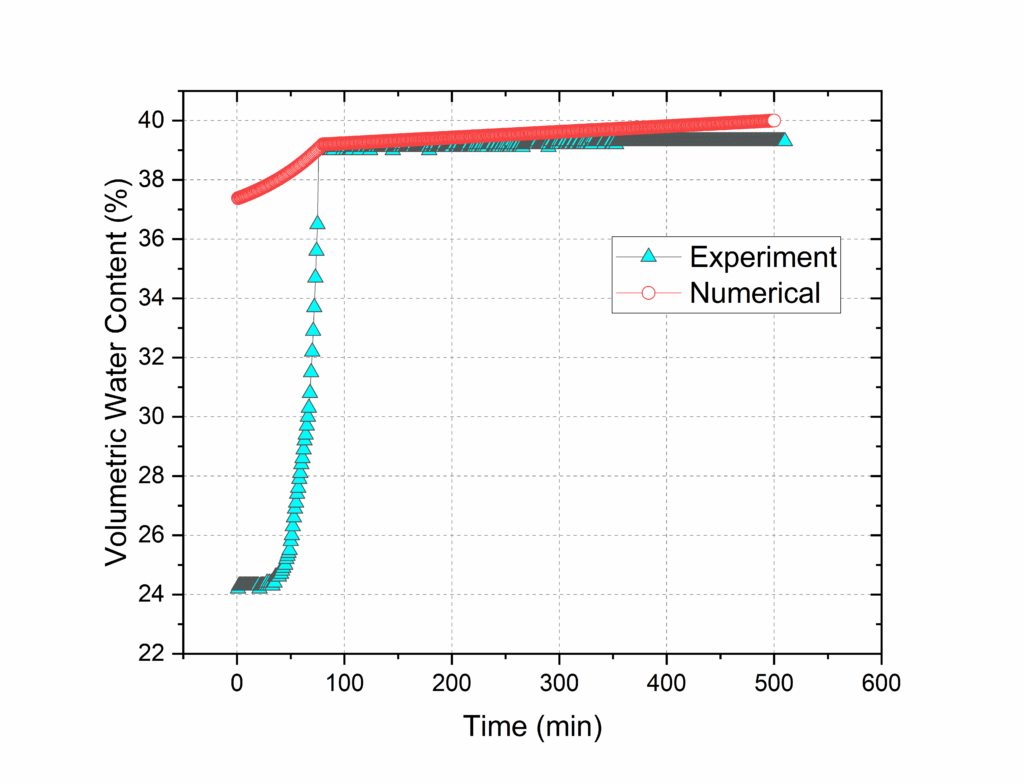
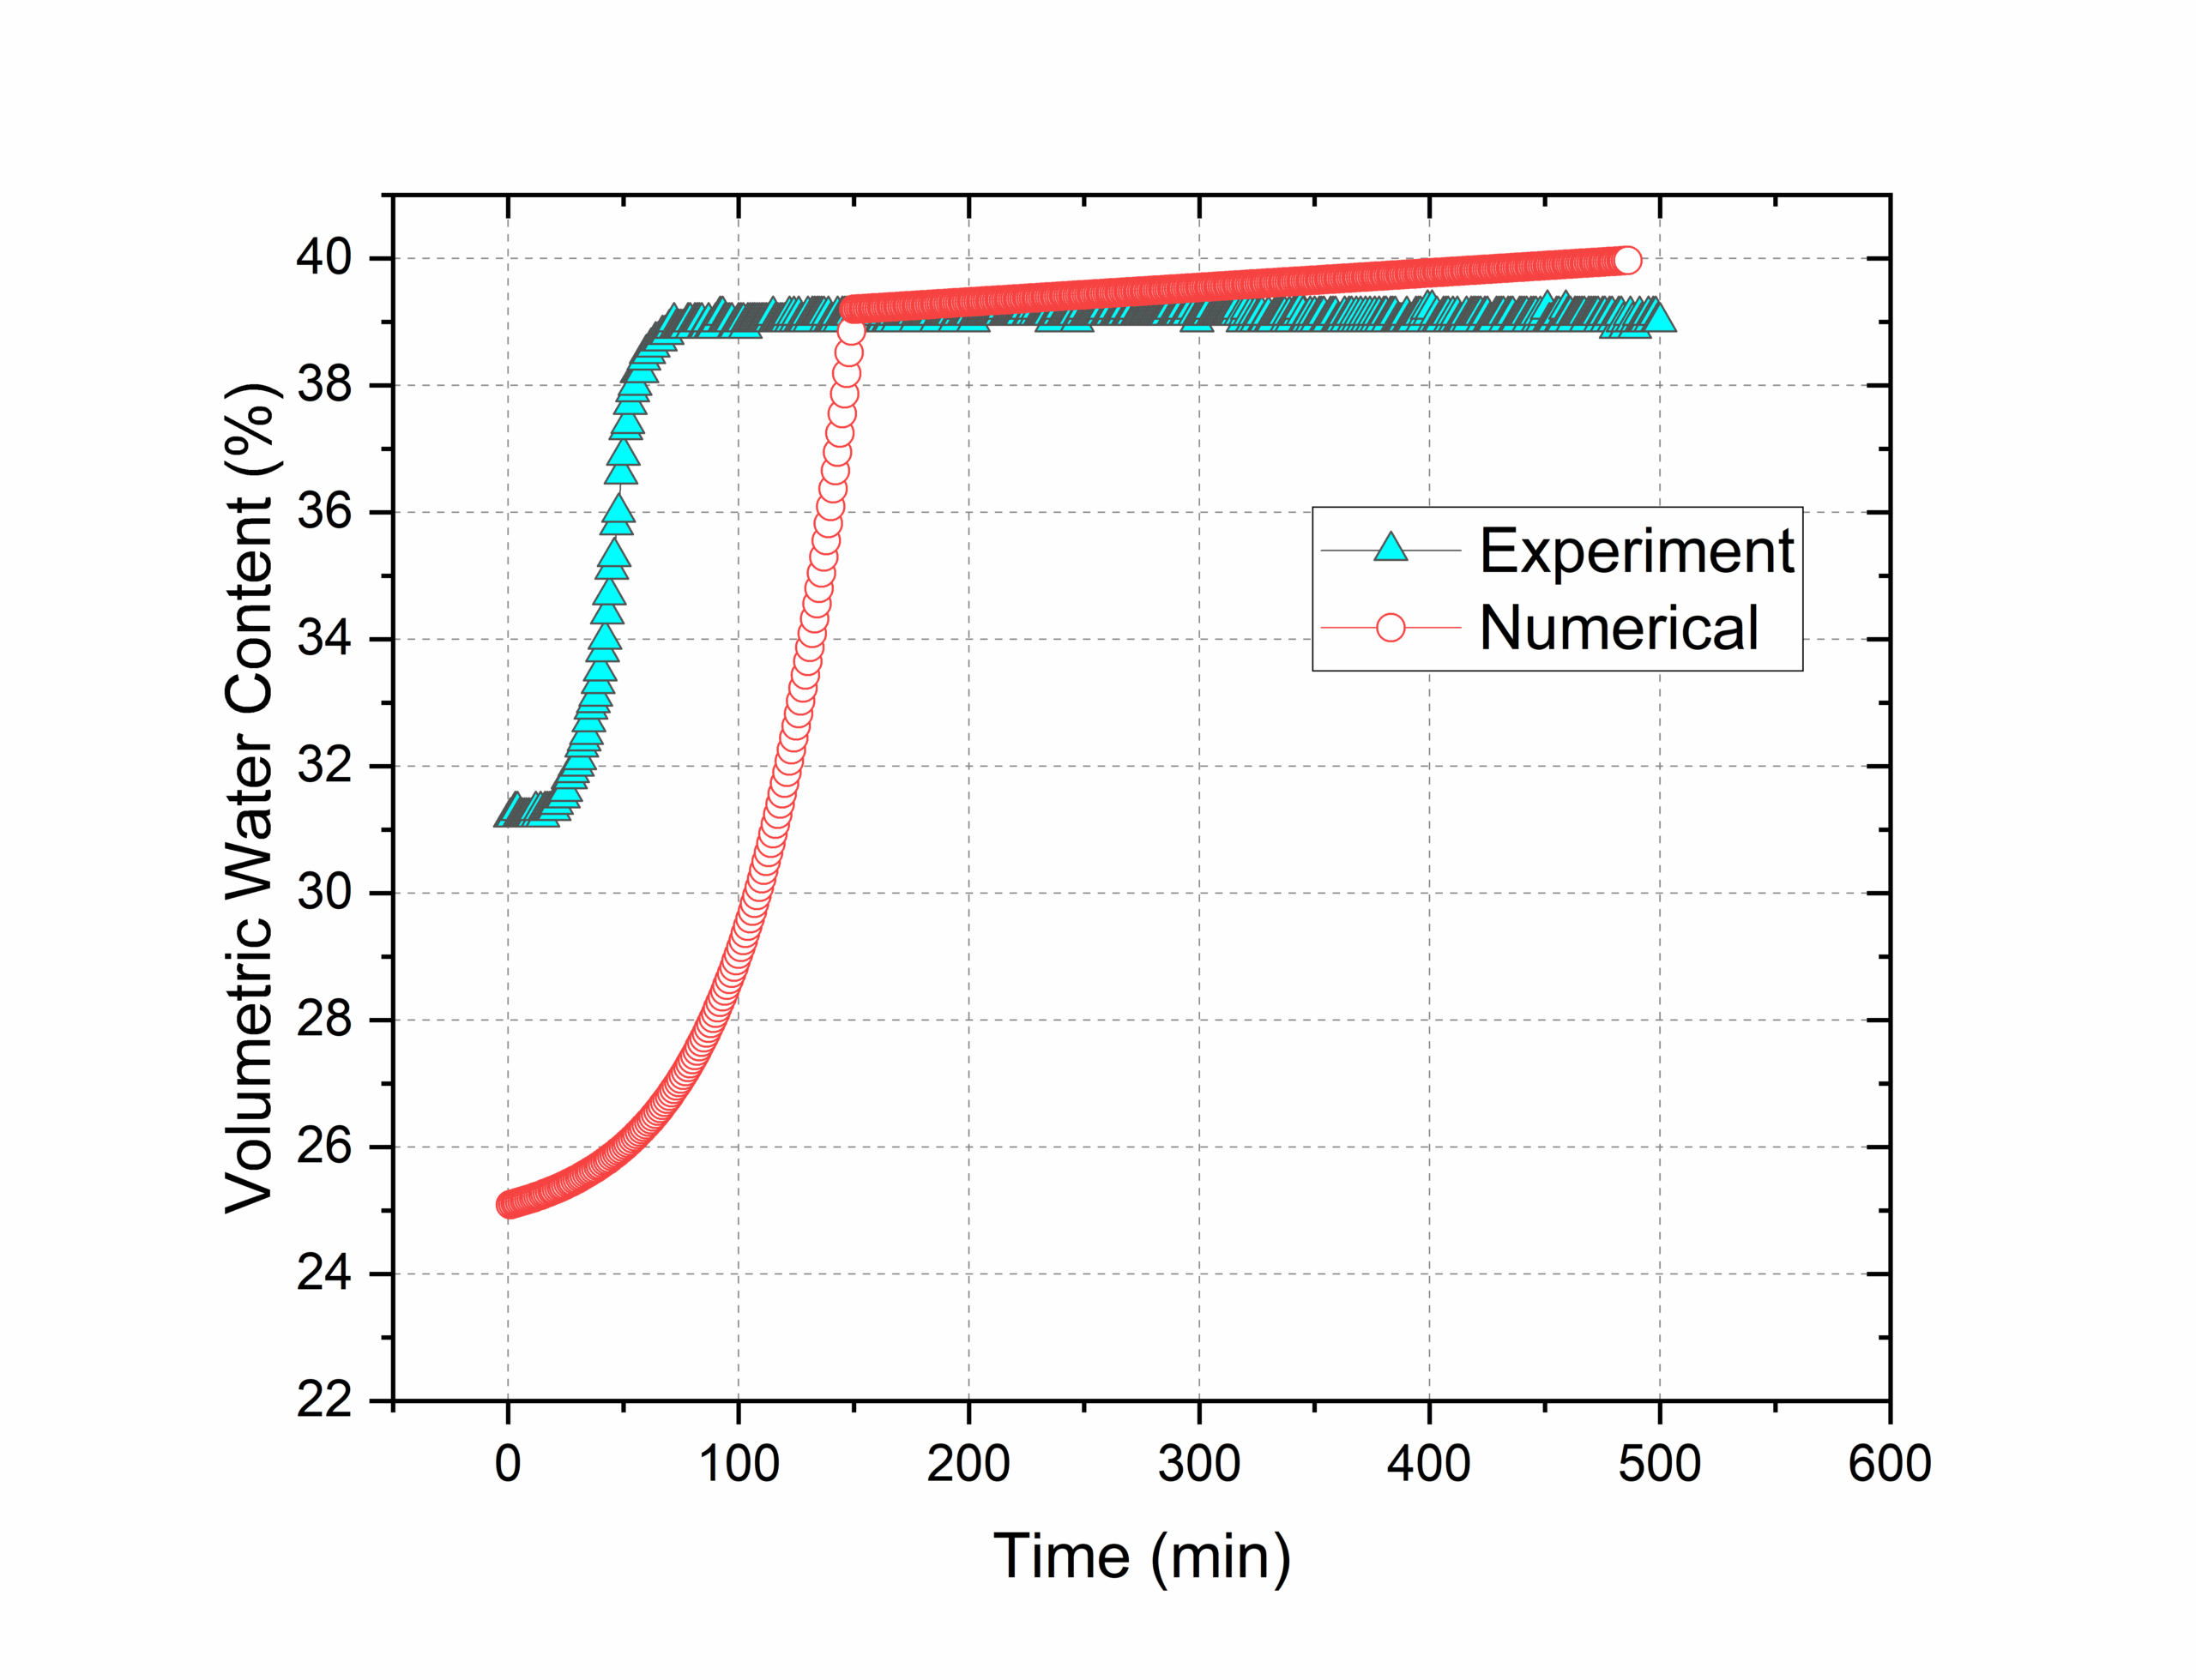
From the sensors volumetric water content data was also gathered. For bare soil, the max value was ranged between 35.1% to 41.5%. From numerical model the max value was 40%, as shown in figure 20 compared to one sensor data. For vegetated soil, max sensor data ranged between 38.8% to 40.9%. numerical model for both MC model and HS model gave similar assumption. So it is showed as one, as shown in figure 21.
3.3. Effect of rapid drawdown
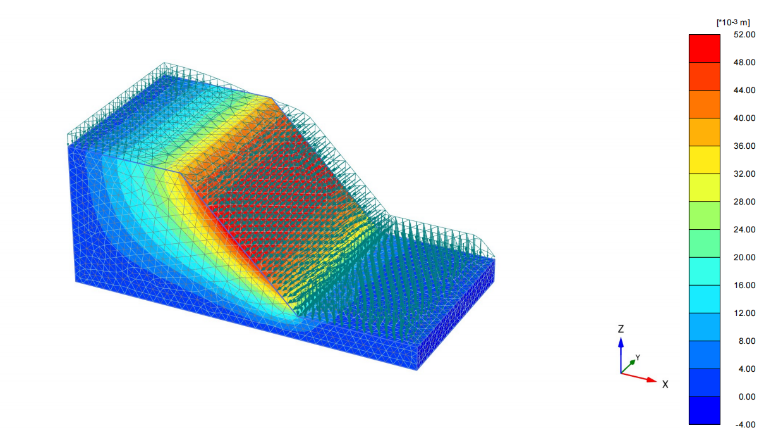
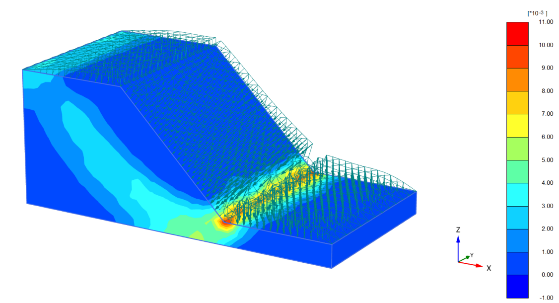
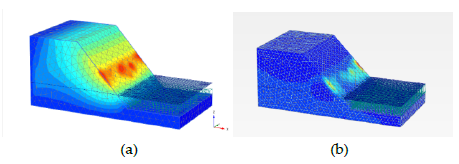
During the rapid drawdown phase, where the water level dropped 0.4 meters over a period of 8 hours, the slope exhibited a distinct pattern of displacement. The maximum displacement occurring in the middle of the slope is a critical observation. This indicates that the middle section was the most affected by the changes in water level, a phenomenon that can be attributed to the rapid reduction in water pressure and the consequent loss of support for the soil particles.
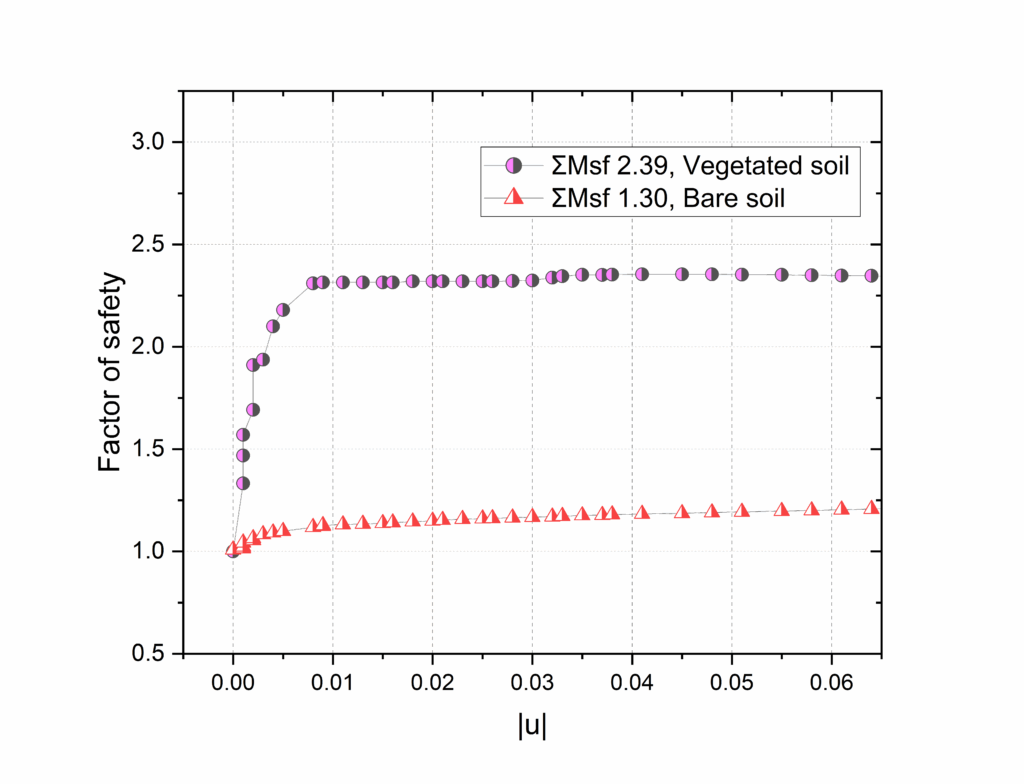
After the rapid drawdown phase, the factor of safety calculated for the slope is 1.3 without vegetation and 2.39 with vegetation.
4. Discussion
The main goal of this study was to investigate riverbank slope stability dynamics, with a specific focus on the impact of water level changes, rainfall, and vegetation. The completion was made by combining empirical data from laboratory experiments with numerical analysis using Plaxis 3D. The methodologies offered a thorough understanding of the complex interactions among different natural factors and how they together affect slope stability.
In the initial phase, the analysis depicted a noticeable shift in the landform, especially at the slope’s bottom end, a region typically subjected to significant load and the starting point of movement in case of any instability. The factor of safety was calculated to be 3.22, indicating a stable condition at this stage for gravity loading. For vegetated soil, the factor of safety was slightly higher at 3.3, suggesting that vegetation contributes to the slope’s overall stability.
Later, the investigation indicated that during the rainfall phase, displacement started at the slope toe for bare soil. The deformation pattern, beginning at the bottom parts and progressing upwards, corresponds with common reactions to moisture caused by rainfall. The deviatoric strain diagram offered a good depiction of shear strain in the slope, providing predictive information about possible landslide locations. During the observation from the experiment, the diagram closely matches the displacement of the slope. Although from the laser data it can be seen that the actual displacement value was much higher during the experiment than simulation. Later using the Hardening Soil Model, the displacement was higher and close to the laser data than the Mohr-Coulomb Model analysis. The hardening soil model, accounting for non-linear soil behavior and changes in stiffness under different load conditions, offers a more realistic representation of how soil behaves in real-world scenarios. This contrasts with the simpler, linear approach of the Mohr-Coulomb model, which doesn’t fully capture complexities like strain hardening or pressure effects on soil strength. Displacement during the plaxis simulation for vegetated soil decreased by over 64%. The laser cannot scan the soil below the vegetation, that’s why it was not used during this experiment. But the plaxis displacement shows the correlation observed during the vegetated slope experiment. For further confirmation, the factor of safety in this phase is 2.86 whereas for bare soil factor of safety is 1, which shows highlights of the critical role of vegetation in reinforcing slope stability under heavy rain conditions. A factor of safety of 1 for bare soil suggests that the slope’s strength is just enough to counteract the applied stresses, signifying a threshold condition where any additional stress could lead to failure such as rainfall in this case. In contrast, a factor of safety above 2 for vegetated slopes indicates a much more stable condition.
In comparing the two slope models pore water pressure, it can be seen that the bare soil numerical presents somewhat consistent correlation between experimental data. However, the vegetated soil numerical data revealed a marked variance where notable fluctuations not captured by the smoother numerical model. While it is broadly following the trend, but may not account for certain complex transient conditions that are reflected in the experimental measurements. For volumetric water content, comparing the two graphs depicting volumetric water content over time, both illustrate a characteristic rapid increase followed by a plateau, indicative of approaching saturation. The numerical simulations slightly overestimate the volumetric water content in both. Despite the discrepancies, the consistency of the numerical predictions across both graphs supports their validity in capturing the overall trend of water content changes.
During the rapid drawdown phase, where water levels decreased by 0.4 meters, revealed significant displacement patterns, particularly in the slope’s middle section. This phenomenon is attributed to the rapid reduction in water pressure, resulting in less support for the soil particles and subsequent displacement. The factor of safety in this phase for bare soil calculated at 1.3 and 2.39 for vegetated soil. The vegetated soil’s strength is more than double the stress acting on it, suggesting a robust level of stability. Vegetation, through its root systems, increases the shear strength of the soil, thereby enhancing its stability. Because the soil is enforced with vegetation, the deformation is minimum.
The study’s methodology, while robust, does encounter several limitations that could influence its internal and external validity. Plaxis inevitably involves simplifications and assumptions. These may not fully capture all nuances of real-world scenarios, such as accurate modeling of soil heterogeneity, root-soil interactions, and complex hydrological processes. The laboratory experiments conducted were on a smaller scale. When scaling up these results to real-world scenarios, there might be inaccuracies. The controlled environment of a laboratory cannot perfectly replicate the variable and often unpredictable natural conditions.
The impact of factors like seasonal water level variations and rainfall patterns can differ significantly across various geographic regions. Thus, the study’s findings may not encompass the full range of environmental conditions found in diverse settings. The study’s approach to understanding the role of vegetation in slope stability may be somewhat generalized. The effects of vegetation can vary greatly depending on species, age, root structure, and health. These limitations highlight the need for cautious interpretation of the study’s findings and suggest areas for further research to enhance the understanding and predictive capabilities of slope stability models under various environmental conditions.
5. Conclusion
The study examined the impact of water level fluctuations, rainfall, and vegetation on riverbank slope stability, offering vital insights into the intricate relationship among these natural elements. Empirical evidence and numerical research showed that vegetated slopes are more stable, especially during rains. The study verified the crucial function of vegetation in strengthening soil and reducing erosion, highlighting its significance in slope stability. The study also suggests that using hardened soil in the models yielded more accurate measurements in comparison to real-world data. This indicates the importance of considering soil hardening as a factor in predicting slope stability. This study also emphasizes the influence of water level rapid drawdown and precipitation patterns on slope stability. Quick changes in water levels, especially during drawdown phases, are important elements that affect the mechanical behavior and stability of riverbank slopes.
The study is consistent with other research, highlighting the substantial influence of rainfall on slope instability. Nevertheless, it faces constraints because of the simplifications in the numerical model and the limited scope of laboratory experiments, which may not accurately reflect a wide range of real-world scenarios. The results emphasize the necessity for additional study in geotechnical engineering, particularly in enhancing modeling methods and comprehending the diverse effects of natural elements on slope stability.
Acknowledgement
The research is financially supported by the National Key Research and Development Program of China (No. 2021YFE0194300).
Conflict of Interest
The authors declare no conflict of interest.
- J.E. Norris, A. Stokes, S.B. Mickovski, E. Cammeraat, R. Van Beek, B.C. Nicoll, A. Achim, Slope stability and erosion control: Ecotechnological solutions, 2008, doi:10.1007/978-1-4020-6676-4.
- D. Haque, M.I. Reza, “Parametric Analysis of Slope Stability for River Embankment,” Journal of Advanced Engineering and Computation, 2020, doi:10.25073/jaec.202043.291.
- S. Wen, H. La, C. Wang, “Analysis of influence factors of slope stability,” in Applied Mechanics and Materials, 2013, doi:10.4028/www.scientific.net/AMM.256-259.34.
- R. Hack, D. Alkema, G.A.M. Kruse, N. Leenders, L. Luzi, “Influence of earthquakes on the stability of slopes,” Engineering Geology, vol. 91, no. 1, 2007, doi:10.1016/j.enggeo.2006.12.016.
- H. Rahardjo, T.H. Ong, R.B. Rezaur, E.C. Leong, “Factors Controlling Instability of Homogeneous Soil Slopes under Rainfall,” Journal of Geotechnical and Geoenvironmental Engineering, vol. 133, no. 12, 2007, doi:10.1061/(asce)1090-0241(2007)133:12(1532).
- D. Huang, S.L. Luo, Z. Zhong, D.M. Gu, Y.X. Song, R. Tomás, “Analysis and modeling of the combined effects of hydrological factors on a reservoir bank slope in the Three Gorges Reservoir area, China,” Engineering Geology, vol. 279, , 2020, doi:10.1016/j.enggeo.2020.105858.
- M. Kamran, X. Hu, M.A. Hussain, K. He, A. Nawaz, R. Ali, “Characterizing the Fundamental Controls on Deformation and Stability of an Active Reservoir Landslide, Southwest China,” Polish Journal of Environmental Studies, vol. 31, no. 4, 2022, doi:10.15244/pjoes/146937.
- J. Iqbal, X. Tu, W. Gao, “The impact of reservoir fluctuations on reactivated large landslides: A case study,” Geofluids, 2019, doi:10.1155/2019/2374236.
- Z. Zhou, J. Shen, S. Tang, W. Duan, J. Wang, R. Yang, S. Zheng, F. Guo, “Analysis of weakening law and stability of sliding zone soil in thrust-load-induced accumulation landslides triggered by rainfall infiltration,” Water (Switzerland), vol. 13, no. 4, 2021, doi:10.3390/w13040466.
- L.L. Zhang, J. Zhang, L.M. Zhang, W.H. Tang, Stability analysis of rainfallinduced slope failure: A review, Proceedings of the Institution of Civil Engineers: Geotechnical Engineering, vol. 164, no. 5, 2011, doi:10.1680/geng.2011.164.5.299.
- A. Tohari, M. Nishigaki, M. Komatsu, “Laboratory Rainfall-Induced Slope Failure with Moisture Content Measurement,” Journal of Geotechnical and Geoenvironmental Engineering, vol. 133, no. 5, 2007, doi:10.1061/(asce)1090-0241(2007)133:5(575).
- A.B. Fourie, “Predicting rainfall-induced slope instability,” Proceedings of the Institution of Civil Engineers: Geotechnical Engineering, vol. 119, no. 4, 1996, doi:10.1680/igeng.1996.28757.
- W. Wu, “Lulu Zhang, Jinhui Li, Xu Li, Jie Zhang, Hong Zhu: Rainfall-induced soil slope failure: stability analysis and probabilistic assessment,” Acta Geotechnica, vol. 12, no. 5, 2017, doi:10.1007/s11440-017-0591-8.
- S. Rawat, R. Zodinpuii, B. Manna, K.G. Sharma, “Investigation on failure mechanism of nailed soil slopes under surcharge loading: testing and analysis,” Geomechanics and Geoengineering, vol. 9, no. 1, 2014, doi:10.1080/17486025.2013.804211.
- G. Zhang, Y. Hu, L. Wang, “Behaviour and mechanism of failure process of soil slopes,” Environmental Earth Sciences, vol. 73, no. 4, 2015, doi:10.1007/s12665-014-3522-0.
- G. Tang, J. Huang, D. Sheng, S.W. Sloan, “Stability analysis of unsaturated soil slopes under random rainfall patterns,” Engineering Geology, vol. 245, , pp. 322–332, 2018, doi:10.1016/J.ENGGEO.2018.09.013.
- N.S.B. Nasir Ahmad, F.B. Mustafa, S.@. Y. Muhammad Yusoff, G. Didams, A systematic review of soil erosion control practices on the agricultural land in Asia, International Soil and Water Conservation Research, vol. 8, no. 2, 2020, doi:10.1016/j.iswcr.2020.04.001.
- P. Sun, G. Wang, L.Z. Wu, O. Igwe, E. Zhu, “Physical model experiments for shallow failure in rainfall-triggered loess slope, Northwest China,” Bulletin of Engineering Geology and the Environment, vol. 78, no. 6, pp. 4363–4382, 2019, doi:10.1007/S10064-018-1420-5/METRICS.
- Q. Zhang, Z. Luo, Y. Chen, Z. Wang, “Physical Model Experiments on Failure Mechanism on Slopes of Weathered Basalt Soils during Heavy Rainfall Events,” Materials, vol. 16, no. 2, 2023, doi:10.3390/ma16020832.
- A. Gurnell, “Plants as river system engineers,” Earth Surface Processes and Landforms, vol. 39, no. 1, 2014, doi:10.1002/esp.3397.
- P.M. Rowiński, K. Västilä, J. Aberle, J. Järvelä, M.B. Kalinowska, How vegetation can aid in coping with river management challenges: A brief review, Ecohydrology and Hydrobiology, vol. 18, no. 4, 2018, doi:10.1016/j.ecohyd.2018.07.003.
- T.H. Wu, “Effect of vegetation on slope stability,” Transportation Research Record, vol. 965, , pp. 37–46, 1984.
- Y. Chok, W. Kaggwa, “Modelling the effects of vegetation on stability of slopes,” in Australia-New Zealand Conference on Geomechanics, 391–397, 2004.
- M. Cecconi, P. Napoli, V. Pane, “Effects of soil vegetation on shallow slope instability,” Environmental Geotechnics, vol. 2, no. 3, 2015, doi:10.1680/envgeo.13.00110.
- W.L. Wieder, S.A. Shoop, State of the knowledge of vegetation impact on soil strength and trafficability, Journal of Terramechanics, vol. 78, , 2018, doi:10.1016/j.jterra.2018.03.006.
- R. Oorthuis, J. Vaunat, M. Hürlimann, A. Lloret, J. Moya, C. Puig-Polo, A. Fraccica, “Slope orientation and vegetation effects on soil thermo-hydraulic behavior. An experimental study,” Sustainability (Switzerland), vol. 13, no. 1, 2021, doi:10.3390/su13010014.
- H.Z. Oo, L.Z. Ai, Z. Qiu, “Numerical Analysis of River Bank Slope Stability During Rapid Drawdown of Water Level,” Study of Civil Engineering and Architecture, vol. 2, no. 4, 2013.
- N.A. Taha, M.S.M. Shariff, M.A. Ladin, “Case Study on Analyses of Slope Riverbank Failure,” Modelling and Simulation in Engineering, vol. 2022, , 2022, doi:10.1155/2022/1965224.
- W. Geng-sun, “THE PROGRESSIVE FAILURE OF SLOPE AND THE STABILITY ANALYSES,” Chinese Journal of Rock Mechanics and Engineering, vol. 19, no. 1, pp. 29–33, 2000.
- Y. Li, C. He, “Research Progress on Dynamic Stability of Layered Rock Slope,” in IOP Conference Series: Earth and Environmental Science, 2021, doi:10.1088/1755-1315/760/1/012058.
- M. Sazzad, F.I. Rahman, A.A. Mamun, “Effects of Water-Level Variation on the Stability of Slope By Lem and Fem,” International Conference on Civil Engineering for Sustainable Development, no. February, 2016.
- Y. Lu, Y. Tan, X. Li, “Stability analyses on slopes of clay-rock mixtures using discrete element method,” Engineering Geology, vol. 244, , 2018, doi:10.1016/j.enggeo.2018.07.021.
- N.M. Saim, A. Kasa, “Comparative Analysis of Slope Stability using Finite Element Method (FEM) and Limit Equilibrium Method (LEM),” in 2023 IEEE 14th Control and System Graduate Research Colloquium, ICSGRC 2023 – Conference Proceeding, 2023, doi:10.1109/ICSGRC57744.2023.10215453.
- Y.W. Zeng, W.M. Tian, “Slope stability analysis by combining FEM with limit equilibrium method,” Yanshilixue Yu Gongcheng Xuebao/Chinese Journal of Rock Mechanics and Engineering, vol. 24, no. SUPPL. 2, 2005.
- A. Kaur, R.K. Sharma, “SLOPE STABILITY ANALYSIS TECHNIQUES: A REVIEW,” International Journal of Engineering Applied Sciences and Technology, vol. 1, , 2016.
- A. Burman, S.P. Acharya, R.R. Sahay, D. Maity, “A comparative study of slope stability analysis using traditional limit equilibrium method and finite element method,” Asian Journal of Civil Engineering, vol. 16, no. 4, 2015.
- G.M.M. Alam, K. Alam, S. Mushtaq, M.N. Khatun, W. Leal Filho, Strategies and barriers to adaptation of hazard-prone rural households in Bangladesh, 2018, doi:10.1007/978-3-319-64599-5_2.
- J.P. Aryal, T.B. Sapkota, D.B. Rahut, T.J. Krupnik, S. Shahrin, M.L. Jat, C.M. Stirling, “Major Climate risks and Adaptation Strategies of Smallholder Farmers in Coastal Bangladesh,” Environmental Management, vol. 66, no. 1, 2020, doi:10.1007/s00267-020-01291-8.
- Plaxis, General Information Manual, 2024.
- Plaxis, Reference Manual 3D, 2024.
- J.T. Bowers, M.C. Webb, J.L. Beaver, “Soil Parameters for Design with the 3D PLAXIS Hardening Soil Model,” Transportation Research Record, 2019, doi:10.1177/0361198119851723.
- F. Ali, “Use of vegetation for slope protection: Root mechanical properties of some tropical plants,” International Journal of Physical Sciences, vol. 5, no. 5, 2010.
No related articles were found.