Analytical Framework to Minimize the Latency in Tele-herbal Healthcare Service
(This article belongs to the Section Information Systems – Computer Science (ISC))
Export Citations
Cite
Omuya, O. S. A. and Tayo, A. O. (2022). Analytical Framework to Minimize the Latency in Tele-herbal Healthcare Service. Journal of Engineering Research and Sciences, 1(1), 39–50. https://doi.org/10.55708/js0101004
Ogirima Sanni Abubakar Omuya and Arulogun Oladiran Tayo. "Analytical Framework to Minimize the Latency in Tele-herbal Healthcare Service." Journal of Engineering Research and Sciences 1, no. 1 (February 2022): 39–50. https://doi.org/10.55708/js0101004
O.S.A. Omuya and A.O. Tayo, "Analytical Framework to Minimize the Latency in Tele-herbal Healthcare Service," Journal of Engineering Research and Sciences, vol. 1, no. 1, pp. 39–50, Feb. 2022, doi: 10.55708/js0101004.
Telemedicine is using telecommunications and IT and other ICT tools to widen healthcare services to remote rural areas. ICT global coverage, multicasting ability, and the high capacity of satellites in GEO can be served as an instrument to widen and enhance the high quality of healthcare service to remote rural areas. Long end-to-end latency could be attributed to the GEO satellites that demean the performance of data communications that can lead to underutilization of the high available capacity due to high link errors and the long latency. The real latency of GEO satellites could be 200ms or above, which can leads to capacity utilization as lower as 37% with a maximum of 458kbps obtainable capacity of the test from LAUTECH Ogbomoso (service provider). The TCP performance can be enhanced through the adoption of other necessary transmission protocols for testing and investigating any possible modifications to improve the performance over the satellite and hybrid channels network. TCP performances largely depend on its loss recovery. To minimize latency, the network must have the necessary resources to provide quality communication within the shortest latency times to perform its required real-time transmission. To transmit from node to node it needs a minimum of 3123.2 1KB and a maximum of 5683.2 1KB packets to go from each connection.
1. Introduction
With the technological advancement, to develop converged broadband network, there is a need to have enhanced the NGNs and advanced multimedia services, the potential has been increased for the delivering of various e-Health services to the end-users “anywhere and anytime”. E-health can be regarded as the application of ICT tools in delivering healthcare services to patients at a distance [1]. There are varieties of e-health services currently in existence, this includes health information networks, EHR, telemedicine services, wearable and portable systems that communicate with health portals, and other ICT-based tools (used for disease prevention, diagnosis, treatment, health monitoring, and lifestyle management). As Nigeria population is increasing rapidly, it has been projected by year 2030 the population will rise from 200 million to 250 million. It has lower healthcare practitioners that can meet the needs of the populace; hence most healthcare professional has traveled to other countries for better pay. Most Nigerians live in rural areas with health challenges, such as malaria, tuberculosis, HIV, and other related diseases. Some Nigerians living in less populated areas with no access to medical care due to the lack of medical facilities may not benefit from telediagnosis as a result of connectivity. But those living in urban areas are digitally connected and have advanced healthcare. There are policies made by the government to improve the standard of living of the population in both urban and rural areas to make the necessary infrastructure for healthcare services [2].
Telemedicine will be very helpful to the healthcare services to the people of Nigeria as it has the potential to aid the delivery of quality medical care to remote rural areas if properly implemented. For the tele-herbal services, the use of modern technology such as IT to extend access to high quality herbal medical care and offered improved healthcare services with aid of remote diagnosing, treatment, and accessibility of patient information to remote areas in reducing the distance and barriers cost [3]. To increase the physical data rate, share the common network infrastructure and network virtualization, there is a need to consider the 3GPP or other modern technology device to support the network slicing and reliable communication [4].
2. Related works
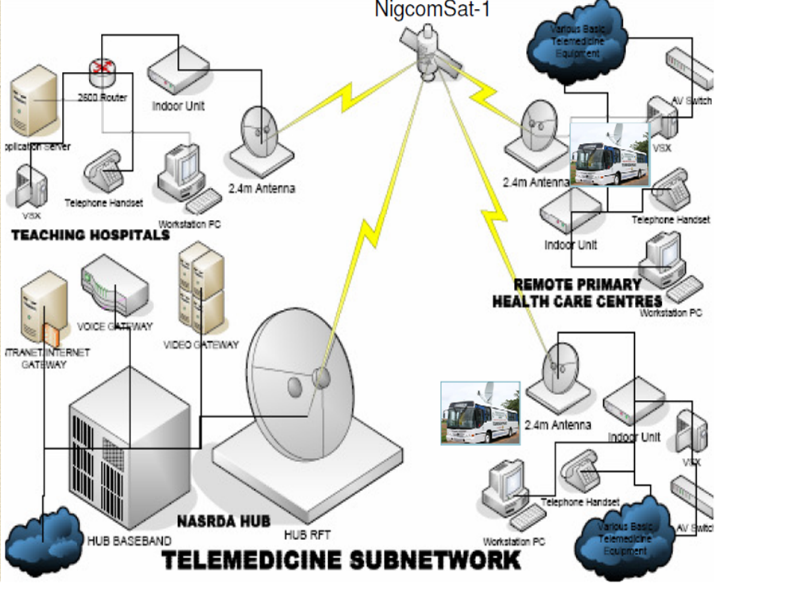
In 2005, the WHA resolution was hopeful that countries will take the advantage of potential offered through e-health application to strengthen the health systems which led to the inauguration of the TTF in the workshop held in Brussels in 2006 with the mandate to develop a comprehensive representation of telemedicine opportunities to Africa countries through modern technology [5]. The Nigeria government swung into action by the formation of a telemedicine unit under the NASRDA so that the unit can make use of NigComSAT 1 to perform tele-surgery from selected hospitals across Nigeria with services from experts in various teaching hospitals across the six geographical regions shown Figure 1 [6].
The NigComSAT 1 and other ICT tools could have a serious impact on healthcare services but implementing telemedicine in Nigeria is faced with challenges with ICT tools (such as internet accessibility, and electricity supply) especially in the rural areas. Though the initiatives and research are at infant stages and insufficient to solve Nigeria’s medical care problems. Hence there is a need to be complemented with herbal medication using the WAVA principle as shown in Figures 2 [7].
There are different modalities in which telemedicine allows real-time interaction in a video conference environment this includes the necessary pieces of equipment for both audio and video capturing and reproduction with other connected link other related equipment through the ISDN or IP. The quality of Video and audio will depend on the success of a video conference [8]. In a collaborative telediagnosis, sharing of images of the scars and adaption can be transmitted across to client stations to monitor the scar excision to ascertain the removal of the cells of cancer or not. This study aimed at adapting to the changing the initial needs, to emerging needs, and changes in contexts in conformity with the current technologies [9]
Allowing tele-consultants to share data with others on a remote diagnosis of patients, the tele-consultants need a high level of information available to validate the required result. WAVA adaptation determines the specific devices to be used while the server determines and reports the best quality or capacity of data needed to meet the requirements of the devices. More so, the quality of the resolution and compression rate can be determined on the adaptation of the encoding type used [10]. For proper telediagnosis, there must be Videoconferencing equipment at both sites connected utilizing broadband lines to facilitate the treatment of patients [11]. These sites are connected with the use of ISDN lines with the combination of both local and remote web applications. This enables seamless integration of the necessary medical equipment stationed at the patient’s location for easy diagnosing [12, 13]. VAGABOND was designed to familiarize the practitioners and network levels with the possible binomial probability needed to trigger the practitioner’s adaptations. Therefore, probabilities are calculated based on the retained video packets and those received [14].
A Wi-Fi-based mask-type laryngoscope was designed to complement the effort of medical personnel during the COVID-19 pandemic in order to minimize and reduce the chances of contamination and spread of the disease to the medical field. There is a tendency for the disease to infect other medical facilities during the spread. Thus, there is a need for the operator and patient separation to avoid further spreading of the disease this led to the instructions to wear the mask remotely using the Smartphone app. If there is an emergence, practitioners waiting outside the room can interrupt the procedure and ensure the patient’s safety. In this Wi-Fi-based contactless mask endoscopy system, the delay in video streaming can be evaluated by comparing the frame rate and image over direct Wi-Fi connectivity [15].
For telemedicine modalities to be effective in facilitating real-time communication of remote healthcare information there should be an integrated optical-wireless based network to provide high super broadband, ultra-low-latency connection link for data, voice, video, and image transmission through the network. Mobility services enable efficiencies in telediagnosis workflows in the healthcare environment which is critical to provide cost-effective and efficacious care to patients. Secure mobile networking requires using industry-standard security protocols, which control authentication, heighten data encryption, minimize latency, and support roaming among access points, and voice is more sensitive to latency and loss than other kinds of data traffic [16].
Therefore, for a telediagnosis in a tele-herbal environment, latency is one of the issues that cannot be ignored and it cannot be avoided due to transmission delay. It is a significant problem to get ethical realism with such delays. To avoid high packet loss, international communication regulations need to put into consideration that the packet loss rate should not exceed 5.0% through network transmission [17].
3. Methodology
3.1. Analytical framework for telediagnosis in tele-herbal environment
To achieve this, an analytical framework was designed to enhance the tele-herbal consultant’s connectivity in Figure 2.
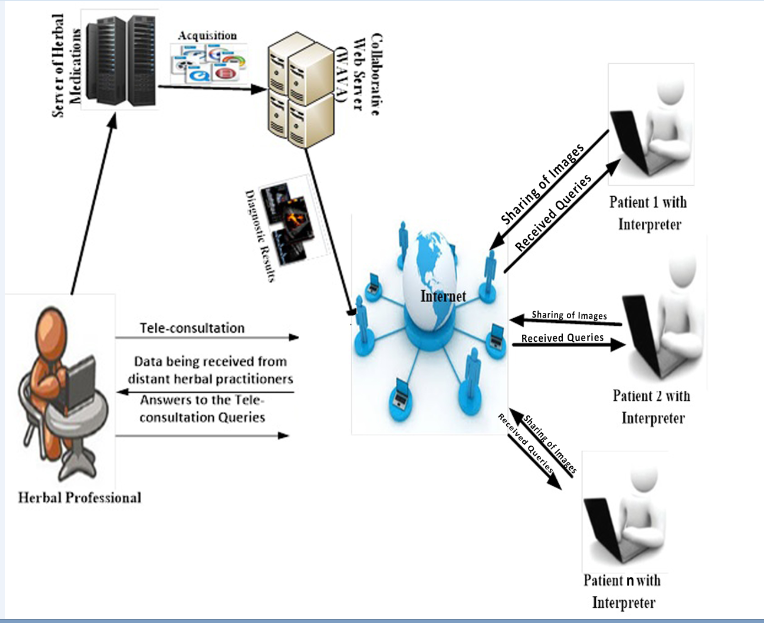
However, it was assumed that the tele-herbal consultants have different types of connections to the e-herbal health service stations either through (internet or Wi-Fi or 3G), and other terminals with different capabilities. For efficient multimedia service delivery over a multi-access network converged, the core IP networks and 3GPPs need to evolved and probes into the packet system, as a result representing a milestone development of standard for mobile broadband industry. Thus, the tele-herbal consultants can receive same data from the adapted result by means of WAVA, that adapt the web service and distribute the recorded video conference to other consultants during telediagnosis (n1, n2, n3…nN) connected to the server.
The sequence diagram, Figure 3 explained how the objects in the analytical framework interact with each other. The objects identified in the framework are the patients and tele-herbal consultants using the designed interface.

3.2. Quality of service Requirements for E-Herbal Services
The quality of service for a given VoIP call needs to be maintained even if the call is being delivered to a wired or wireless endpoint. E-herbal quality of services is expressed and classified in table 1. The quality of service depends on the services received by the patients from the tele-herbal consultants. End-to-end delay and jitter have to be minimized for VoIP packets to provide optimal audio quality and videoconferencing services. In an e-health organization, maintaining a high quality of service is very necessary to establish priority across the WLAN during data transmission.
Table 1: Quality of service requirements for e-herbal services
Application Type | Throughput | Delay | Jitter |
Telediagnosis | Very High | Yes | No |
Teleconsultation | High | Yes | Yes |
Telemonitoring | Very Low | No | No |
Tele-education | High | No | No |
Access to HER | Low | No | No |
3.3. Packet loss during tele-herbal transmission: problems, causes, and solutions
Table 2 shows the lists and other factors that may be considered when practicing tele-herbal services.
Table 2: Requirement for tele-herbal service
Factor | Discussion |
Cost | Direct (hardware equipments, software packages) and Indirect (staffing, storage space) |
Distance | Time zones and downtime (Nearness to site to avoid failure) |
Education | Tele-herbal consultants expectations and acceptable diagnosis |
Network | Firewalls, Bandwidth limitation, and security |
Computers | well-matched hardware equipments with up-to-date OS and antiviral software |
Maintenance | Update support, IT/IS maintenance staffs, and 24 hours availability of herbs |
Images | Pictorial images of patient diseases, test carried out, and storage |
Metadata | Accessing patient information and previous diagnosis |
Workflow | Handling diagnosis for prescription |
Regulations | Validation, , billing and QA measures |
Medico-legal | malpractice coverage, Credentialing, and licensing |
Human | Lack of enthusiasm by tele-herbal consultant, training, and monitoring performance |
3.4. Research Questions
- What causes latency in tele-herbal services?
- What is the maximum average latency in telediagnosis?
- What are the problems associated with packet loss?
- Why do packets go missing?
- What are the solutions to these packet losses?
The solution to the questions above:
- Latency in tele-herbal healthcare service can occur as a result of transmission media, packet size, packet loss and jitter, signal strength, propagation delays, malfunction of computer devices, or storage delays.
- For enhanced network connectivity, the normal latency of the connecting device transmitting data, voice, or video among the tele-herbal consultants should be between 5 and 40 ms when using a cable Modem but if the distance is far then expect the latency to be higher.
- The problems associated with packet loss during tele-herbal consultation are a result of slow loading times, closed connections, loading interruptions, missing information, or out-of-date information in real-time situations.
- The packets that go missing during tele-herbal services as a result of network congestion, hardware capacity, bottlenecks, damaged hardware, network virus (bugs), or wireless networks (Wi-Fi) are open to some unpredictable elements.
- The solutions or remedies to packet losses during tele-herbal services are checking connections, using a cable connection, restarting routers and other hardware, replacing defective and inefficient hardware, and keeping network device software up-to-date.
3.5. Mathematical Model Description
A model was formed to compute the packet loss and total latency. The response time between the tele-herbal healthcare stations and the server can be affected as a result of the physical distance between them. Total latency comprises of communications and network latency. Therefore, service latency is the total time it takes data to travel from one tele-herbal healthcare station to the server and vice versa. Large data were generated during the transmission as a result of traffic and workload can leads to high network latency.
Let assume,
i = {i1, i2 ….ii¢ … .ij¢} consists of nodes that produce a set of data, d = {d1, d2 … …, di¢… dj¢} generate the workload w = {w1, w2… wi¢ … wj¢} on the servers and denoted as f = {f1, f2 … fi¢ … fk¢}
$$L_{i,j’}=\ln\!\ast H_{i,j’} \tag{1}$$
Ln is the unit delay, H (i, j¢) count from Li to Fj¢.
Li, j¢ represents communication or service latency. P (k, j¢) represent computing latency and N(i, j¢) represent network latency that depend on the gateways. The total latency can be defined as
$$L_{i,j’,k}=L_{i,j’}+P(k,j)+N(i,j) \tag{2}$$
The end-to-end video delay was assumed by the users as the sum of the communication delays incurred in the real-time (for video encoding, segmentation, capturing, and transmission). TCES represents (video capturing, encoding, and segmentation) delay at the sender, TN (transmission delay between the sender and receiver), TS represent server processing time, while TD is for segmentation time. Therefore,
$$T=TCES+TN+TS+TD \tag{3}$$
To have the general idea about the latency induced using the analysis with the TCP protocol; realistic tests are performed with aid of the Internet between five working stations behind proxies and firewalls and located in five NODES with high-quality bandwidths capacities.
Packet Loss from Latency Evaluation
The time required to transmit audio or video signal is called latency or media link delay. Preferably, latency can be closed to zero as possible in any transmitting network. Network latency is computed as:
Propagation time = (Frame Serialization Time) + (Link Media delay) + (Queuing Delay) + (Node Processing Delay if known). Latency is the same as link media delay
It will be dangerous if the quality of packet loss is greater than 5.0%. The probing packets are computed as::
$$X_n=
\begin{cases}
1, & \text{packet lost with probability } p, \\
0, & \text{packet received with probability } 1-p
\end{cases}
\tag{4}$$
$$\bar{X}_N=\frac{X_1+X_2+\cdots+X_N}{N} \tag{5}$$
𝑋𝑁 is packet loss rate for the 5 NODES
4. Results and Discussion
Table 3: Packet loss Analysis for NODE1 in 21 days
Day | Packet Sent | Packet Delivered | Lost packet | Loss % | Available % |
1 | 21242 | 20251 | 991 | 4.67 | 95.33 |
2 | 20156 | 19427 | 729 | 3.62 | 96.38 |
3 | 21641 | 21048 | 593 | 2.74 | 97.26 |
4 | 21755 | 21117 | 638 | 2.93 | 97.07 |
5 | 22295 | 21597 | 698 | 3.13 | 96.87 |
6 | 21204 | 20547 | 657 | 3.10 | 96.90 |
7 | 22904 | 22347 | 557 | 2.43 | 97.57 |
8 | 23582 | 22607 | 975 | 4.13 | 95.87 |
9 | 22620 | 21634 | 986 | 4.36 | 95.64 |
10 | 23465 | 22622 | 843 | 3.59 | 96.41 |
11 | 23198 | 22551 | 647 | 2.79 | 97.21 |
12 | 20137 | 19193 | 944 | 4.69 | 95.31 |
13 | 21627 | 20816 | 811 | 3.75 | 96.25 |
14 | 22654 | 21936 | 718 | 3.17 | 96.83 |
15 | 20245 | 19363 | 882 | 4.36 | 95.64 |
16 | 23402 | 22857 | 545 | 2.33 | 97.67 |
17 | 24989 | 24208 | 781 | 3.13 | 96.87 |
18 | 20344 | 19426 | 918 | 4.51 | 95.49 |
19 | 23923 | 23277 | 646 | 2.70 | 97.30 |
20 | 23737 | 22882 | 855 | 3.60 | 96.40 |
21 | 24986 | 24252 | 734 | 2.94 | 97.06 |
Table 4: Packet loss Analysis for NODE2 in 21 days
Day | Packet Sent | Packet Delivered | Lost Packet | Loss % | Available % |
1 | 23006 | 22346 | 660 | 2.87 | 97.13 |
2 | 24486 | 23799 | 687 | 2.81 | 97.19 |
3 | 24454 | 23561 | 893 | 3.65 | 96.35 |
4 | 24095 | 23365 | 730 | 3.03 | 96.97 |
5 | 21632 | 20916 | 716 | 3.31 | 96.69 |
6 | 23285 | 22586 | 699 | 3.00 | 97.00 |
7 | 24093 | 23227 | 866 | 3.59 | 96.41 |
8 | 20497 | 19726 | 771 | 3.76 | 96.24 |
9 | 24050 | 23468 | 582 | 2.42 | 97.58 |
10 | 23556 | 22810 | 746 | 3.17 | 96.83 |
11 | 20766 | 19786 | 980 | 4.72 | 95.28 |
12 | 20294 | 19696 | 598 | 2.95 | 97.05 |
13 | 21024 | 20501 | 523 | 2.49 | 97.51 |
14 | 21026 | 20419 | 607 | 2.89 | 97.11 |
15 | 23759 | 23240 | 519 | 2.18 | 97.82 |
16 | 22713 | 22060 | 653 | 2.88 | 97.12 |
17 | 22553 | 21707 | 846 | 3.75 | 96.25 |
18 | 20349 | 19415 | 934 | 4.59 | 95.41 |
19 | 21388 | 20840 | 548 | 2.56 | 97.44 |
20 | 24853 | 24336 | 517 | 2.08 | 97.92 |
21 | 22912 | 22204 | 708 | 3.09 | 96.91 |
Table 5: Packet loss Analysis for NODE3 in 21 days
Day | Packet Sent | Packet Delivered | Lost Packet | Loss % | Available % |
1 | 22801 | 21952 | 849 | 3.72 | 96.28 |
2 | 21446 | 20792 | 654 | 3.05 | 96.95 |
3 | 23459 | 22869 | 590 | 2.52 | 97.48 |
4 | 21339 | 20520 | 819 | 3.84 | 96.16 |
5 | 21477 | 20940 | 537 | 2.50 | 97.50 |
6 | 23352 | 22646 | 706 | 3.02 | 96.98 |
7 | 23260 | 22452 | 808 | 3.47 | 96.53 |
8 | 23578 | 22639 | 939 | 3.98 | 96.02 |
9- | 22985 | 22017 | 968 | 4.21 | 95.79 |
10 | 20623 | 19815 | 808 | 3.92 | 96.08 |
11 | 23381 | 22844 | 537 | 2.30 | 97.70 |
12 | 23052 | 22209 | 843 | 3.66 | 96.34 |
13 | 23557 | 22759 | 798 | 3.39 | 96.61 |
14 | 24277 | 23593 | 684 | 2.82 | 97.18 |
15 | 21434 | 20435 | 999 | 4.66 | 95.34 |
16 | 22367 | 21739 | 628 | 2.81 | 97.19 |
17 | 22020 | 21031 | 989 | 4.49 | 95.51 |
18 | 22786 | 22162 | 624 | 2.74 | 97.26 |
19 | 23519 | 22570 | 949 | 4.04 | 95.96 |
20 | 22799 | 22010 | 789 | 3.46 | 96.54 |
21 | 23216 | 22485 | 731 | 3.15 | 96.85 |
Table 6: Packet loss Analysis for NODE4 in 21 days
Day | Packet Sent | Packet Delivered | Lost Packet | Loss % | Available % |
1 | 20883 | 20122 | 761 | 3.64 | 96.36 |
2 | 20565 | 19621 | 944 | 4.59 | 95.41 |
3 | 21769 | 20793 | 976 | 4.48 | 95.52 |
4 | 23987 | 23425 | 562 | 2.34 | 97.66 |
5 | 23635 | 22836 | 799 | 3.38 | 96.62 |
6 | 23456 | 22730 | 726 | 3.10 | 96.90 |
7 | 20893 | 20204 | 689 | 3.30 | 96.70 |
8 | 23847 | 22901 | 946 | 3.97 | 96.03 |
9 | 22757 | 21773 | 984 | 4.32 | 95.68 |
10 | 23914 | 23163 | 751 | 3.14 | 96.86 |
11 | 20116 | 19293 | 823 | 4.09 | 95.91 |
12 | 20005 | 19087 | 918 | 4.59 | 95.41 |
13 | 22337 | 21620 | 717 | 3.21 | 96.79 |
14 | 24451 | 23667 | 784 | 3.21 | 96.79 |
15 | 24266 | 23709 | 557 | 2.30 | 97.70 |
16 | 22243 | 21668 | 575 | 2.59 | 97.41 |
17 | 21248 | 20322 | 926 | 4.36 | 95.64 |
18 | 24907 | 24025 | 882 | 3.54 | 96.46 |
19 | 20521 | 19717 | 804 | 3.92 | 96.08 |
20 | 21733 | 20785 | 948 | 4.36 | 95.64 |
21 | 24027 | 23209 | 818 | 3.40 | 96.60 |
Table 7: Packet loss Analysis for NODE5 in 21 days
Day | Packet Sent | Packet Delivered | Lost Packet | Loss % | Available % |
1 | 24622 | 24006 | 616 | 2.50 | 97.50 |
2 | 23208 | 22649 | 559 | 2.41 | 97.59 |
3 | 23951 | 23258 | 693 | 2.89 | 97.11 |
4 | 22135 | 21525 | 610 | 2.76 | 97.24 |
5 | 23222 | 22468 | 754 | 3.25 | 96.75 |
6 | 20127 | 19501 | 626 | 3.11 | 96.89 |
7 | 20234 | 19717 | 517 | 2.56 | 97.44 |
8 | 22838 | 22072 | 766 | 3.35 | 96.65 |
9 | 21181 | 20183 | 998 | 4.71 | 95.29 |
10 | 24282 | 23354 | 928 | 3.82 | 96.18 |
11 | 24497 | 23656 | 841 | 3.43 | 96.57 |
12 | 24415 | 23524 | 891 | 3.65 | 96.35 |
13 | 22698 | 21947 | 751 | 3.31 | 96.69 |
14 | 22610 | 21807 | 803 | 3.55 | 96.45 |
15 | 20567 | 19687 | 880 | 4.28 | 95.72 |
16 | 20448 | 19750 | 698 | 3.41 | 96.59 |
17 | 23066 | 22166 | 900 | 3.90 | 96.10 |
18 | 24295 | 23565 | 730 | 3.00 | 97.00 |
19 | 21011 | 20076 | 935 | 4.45 | 95.55 |
20 | 23632 | 22664 | 968 | 4.10 | 95.90 |
21 | 24910 | 24375 | 535 | 2.15 | 97.85 |
Table 8: Packet Loss Rate Analysis for the 5 NODES in 21 days
Days | NODE1 % | NODE2 % | NODE3 % | NODE4 % | NODE5 % |
1 | 4.67 | 2.87 | 3.72 | 3.64 | 2.50 |
2 | 3.62 | 2.81 | 3.05 | 4.59 | 2.41 |
3 | 2.74 | 3.65 | 2.52 | 4.48 | 2.89 |
4 | 2.93 | 3.03 | 3.84 | 2.34 | 2.76 |
5 | 3.13 | 3.31 | 2.5 | 3.38 | 3.25 |
6 | 3.1 | 3 | 3.02 | 3.1 | 3.11 |
7 | 2.43 | 3.59 | 3.47 | 3.3 | 2.56 |
8 | 4.13 | 3.76 | 3.98 | 3.97 | 3.35 |
9 | 4.36 | 2.42 | 4.21 | 4.32 | 4.71 |
10 | 3.59 | 3.17 | 3.92 | 3.14 | 3.82 |
11 | 2.79 | 4.72 | 2.3 | 4.09 | 3.43 |
12 | 4.69 | 2.95 | 3.66 | 4.59 | 3.65 |
13 | 3.75 | 2.49 | 3.39 | 3.21 | 3.31 |
14 | 3.17 | 2.89 | 2.82 | 3.21 | 3.55 |
15 | 4.36 | 2.18 | 4.66 | 2.3 | 4.28 |
16 | 2.33 | 2.88 | 2.81 | 2.59 | 3.41 |
17 | 3.13 | 3.75 | 4.49 | 4.36 | 3.9 |
18 | 4.51 | 4.59 | 2.74 | 3.54 | 3 |
19 | 2.7 | 2.56 | 4.04 | 3.92 | 4.45 |
20 | 3.6 | 2.08 | 3.46 | 4.36 | 4.1 |
21 | 2.94 | 3.09 | 3.15 | 3.4 | 2.15 |
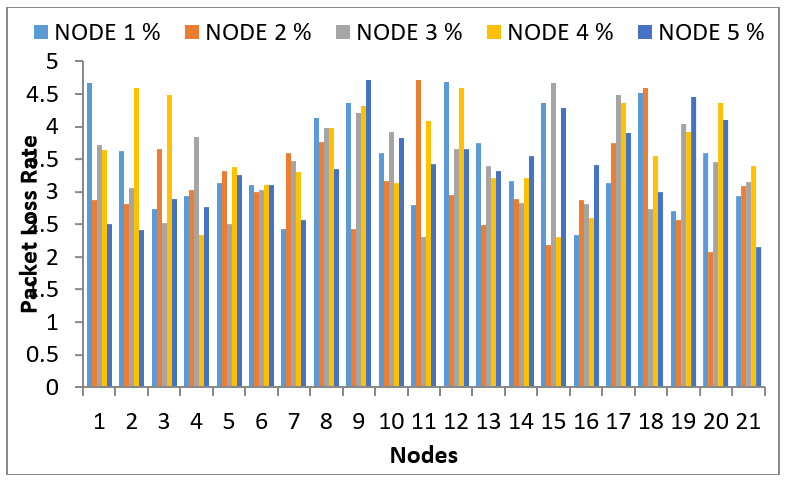
Table 9: Packet Loss at each NODE
Nodes | Loss rate % |
NODE1 | 3.461 |
NODE2 | 3.133 |
NODE3 | 3.417 |
NODE4 | 3.611 |
NODE5 | 3.362 |
XN is the actual packet loss rate for N = 5 ( as in table 8 above)
\(\frac{3.461+3.133+3.417+3.611+3.362}{5}\)= 3.397% average packet loss.
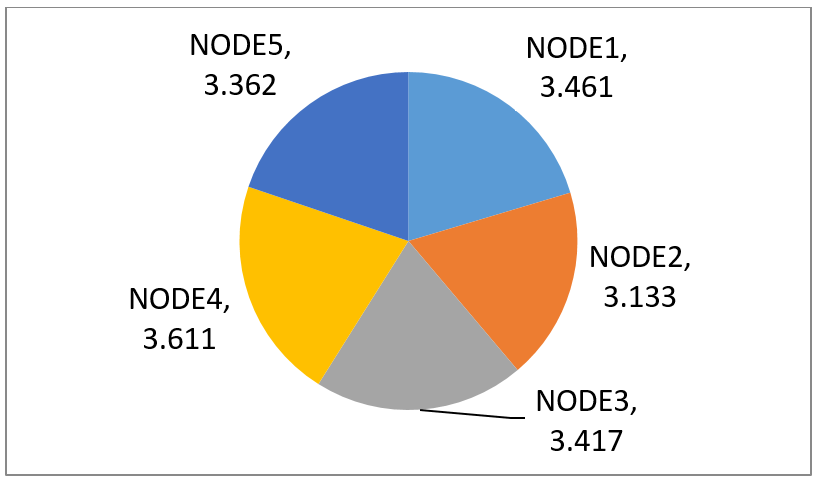
Table 10: Packet Transmitted at each Node
No | NODE1 | NODE2 | NODE3 | NODE4 | NODE5 |
1 | 5120 | 4096 | 4096 | 1024 | 5120 |
2 | 3072 | 1024 | 2048 | 6144 | 2048 |
3 | 5120 | 3072 | 3072 | 2048 | 3072 |
4 | 1024 | 7168 | 6144 | 5120 | 4096 |
5 | 1024 | 6144 | 8192 | 3072 | 3072 |
6 | 2048 | 9216 | 5120 | 6144 | 1024 |
7 | 5120 | 4096 | 3072 | 5120 | 1024 |
8 | 3072 | 8192 | 6144 | 4096 | 4096 |
9 | 4096 | 2048 | 9216 | 7168 | 5120 |
10 | 5120 | 2048 | 7168 | 7168 | 3072 |
11 | 5120 | 8192 | 1024 | 3072 | 3072 |
12 | 2048 | 7168 | 7168 | 6144 | 4096 |
13 | 3072 | 8192 | 8192 | 3072 | 7168 |
14 | 1024 | 6144 | 5120 | 5120 | 7168 |
15 | 2048 | 2048 | 6144 | 4096 | 3072 |
16 | 3072 | 5120 | 1024 | 3072 | 7168 |
17 | 3072 | 4096 | 5120 | 3072 | 5120 |
18 | 2048 | 6144 | 8192 | 6144 | 6144 |
19 | 4096 | 3072 | 1024 | 5120 | 3072 |
20 | 2048 | 3072 | 7168 | 3072 | 7168 |
Table 11: Average Packet transmitted at each node
Node | Packet |
NODE1 | 3123.2 |
NODE2 | 5017.6 |
NODE3 | 5683.2 |
NODE4 | 4454.4 |
NODE5 | 4249.6 |
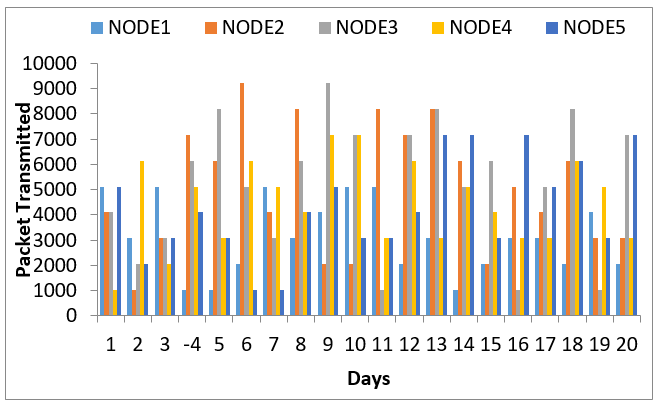
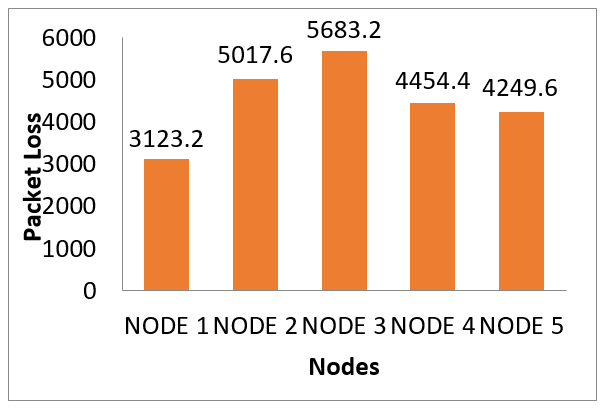
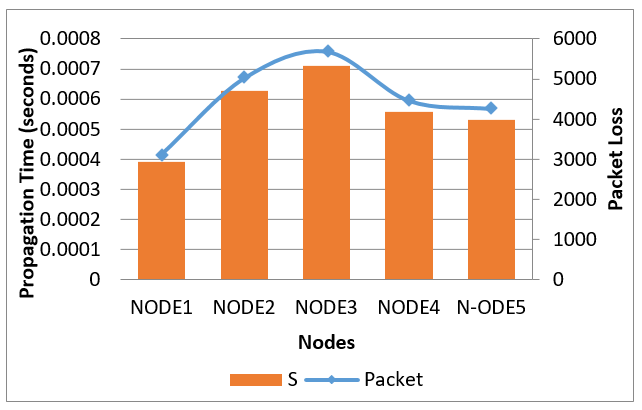
Table 12: Frame Serialization Time
Node | Packet | S |
NODE1 | 3123.2 | 0.0003904 |
NODE2 | 5017.6 | 0.0006272 |
NODE3 | 5683.2 | 0.0007104 |
NODE4 | 4454.4 | 0.0005568 |
N-ODE5 | 4249.6 | 0.0005312 |
Propagation Time at NODE1
Link Media Delay = 0.04 second
Queuing Delay = 0.0 [assume no congestion]
Node Processing Delay = 0.0 [No delay]
———————————————————————–
Propagation Time at NODE1 = 0.0003904+ 0.0400000 + 0.0 + 0.0
= 0.0403904 seconds for 3123 1KB packets pass through network
NODE1 through Connection Channel 1
Propagation Time at NODE2
Link Media Delay = 0.04 seconds]
Queuing Delay = 0.0 [assume no congestion]
Node Processing Delay = 0.0 [No delay]
———————————————————————–
Propagation Time at NODE2 = 0.0006272 + 0.0400000 + 0.0 + 0.0
= 0.04006272 seconds
= 40.6 milliseconds for 5017 1KB packets pass through network
NODE2 through Connection Channel 2
Propagation Time at NODE3
Link Media Delay = 0.04 seconds
Queuing Delay = 0.0 [No congestion]
Node Processing Delay = 0.0 [No delay]
———————————————————————–
Propagation Time at NODE3 = 0.0007104+ 0.04 + 0.0 + 0.0
= 0.0407104 seconds
= 40.7milliseconds for 5683 1KB packets pass through network
NODE3 through Connection Channel 3
Propagation Time at NODE4
Link Media Delay = 0.04 seconds
Queuing Delay = 0.0 [No congestion]
Node Processing Delay = 0.0 [No delay]
———————————————————————–
Propagation Time at NODE4 = 0.0005568+ 0.0400000 + 0.0 + 0.0
= 0.0405568 seconds
= 40.6 milliseconds for 4454 1KB packets pass through network
NODE4 through Connection Channel 4
Propagation Time at NODE5
Link Media Delay = 0.04 seconds
Queuing Delay = 0.0 [No congestion]
Node Processing Delay = 0.0 [No delay]
———————————————————————–
Propagation Time at NODE5 = 0.0005312+ 0.0400000 + 0.0 + 0.0
= 0.0405312 seconds
= 40.5 milliseconds for 4249 1KB packets to pass through network
NODE5 to go through Connection Channel 5
Table 3 through 7 shows the analysis of packet loss from the five NODES in 21 days. Table 8 shows the detailed packet loss rate analysis from the five nodes in 21 days. Table 9 show the packet loss rate in conformity with the claims of [10] Precisions quality of images loss during transmission and this confirms [9] collaborative applications which allow tele-herbal consultants to share data among others as shown in table 10. The analysis in table 11 show average packets transmitted at each node is at minimal in conformity with the international communication rules and regulation that says that packet loss rate should not exceed 5% table 9. Table 12 shows the computational propagation time at each node that ranges from 3123 1KB to 5683 1KB packets among the five NODES with a maximum of 40.6 milliseconds during the transmission of packets. Figures 4 through 8shows the graphical representation of tables 8 though 12 that shows the major analysis of the packet losses in the 5 nodes and serial propagation time.
5. Conclusion
The analytical framework is an innovative model in which the tele-herbal centers will handle videoconferencing data exchange in heterogeneous systems involving multiple NODES with different bandwidths and computation capacities. The framework was designed as a model for the application of telediagnosis for the tele-herbal to provide alternative healthcare services to the patient at a remote distance. To avoid packet loss, an analysis was conducted among the sites (nodes) for 21 days. This is done by comparing the total packet sent and the packet delivered during the transmission which is the difference between percentage packet loss and available bits after the transmission. The devices used by herbal healthcare generate a large volume of data. Therefore, the processing can lead to delay in services provided to other teleconsultants in this telediagnosis environment. To minimize the high latency between tele-herbal consultants and servers, a framework was designed to reduce packet loss during data transmission. This framework’s main goal is to help tele-herbal consultants in their medical diagnosis of patients using the analytical framework to minimize the latency in telediagnosis. To have low-latency networks during transmission, it is very important to determine how and where latency occurs and what methods can apply to reduce it. This paper investigated how the delay accumulates from the transmission of patents data among tele-consultants and sending packets, the trade-off between latency and other network performance indexes tele-herbal consultants with an enhanced hardwire and smart devices to reduce traffic offloading to the receivers. Therefore, for quality communication necessary network resources must be available shorten latency time.
Abbreviations
3GPP Third Generation Partnership Project
EHR Electronic Health Record
GEO Geostationary Earth Orbit
ICT Information Communication Technology
IP Internet Protocol
ISDN Integrated Services Digital Network
IT Information Technology
ITU International Telecommunication Union
LIS Laboratory Information System
NASRDA National Airspace Research and Development Agency
NGNs Next Generation Networks
OS Operating System
RTO Retransmission Timeout
RTP Real-Time Protocol
RTT Round Trip Time
TCP Transmission Control Protocol
UPS Uninterrupted Power Supply
VAGABOND Video Adaptation GAteways, Based ON transcoDing
WAVA Web Services Automatic Video Adaptation
WHA World Health Assembly
WHO World Health Organisation
WLAN Wireless Local Area Network
Conflict of Interest
The authors declare no conflict of interest.
Acknowledgment
The Authors would like to thank the staffs of ODL and ICT of Ladoke Akintola University of Technology, Ogbomoso, Nigeria for the telediagnosis data transmission during testing of the research work.
- Lea Skorin-Kapov and MajaMatijasevic (2010). Analysis of QoS Requirements for e-Health Services and Mapping to Evolved Packet System QoS Classes. International Journal of Telemedicine and Applications Volume 2010. doi:10.1155/2010/628086
- United Nations (2017). ”World Population Prospects: Key Findings and Advance Tables”. The 2017 Revision, Department of Economic and Social Affairs, Population Division, Working Paper No. ESA/P/WP/248, 2017.
- Ogirima, S.A.O, Arulogun, O.T. Baale, A.A. and Oyeleye, C. A. (2021b). Perception of herbal practitioners on the application of modern technology to healthcare delivery in Nigeria. Informatics in Medicine Unlocked. http://www.elsevier.com/locate/imu
- AdlenKsentini, Pantelis A. Frangoudis, Amogh PC, and NavidNikaei (2018). Providing low latency guarantees for slicing-ready 5G systems via two-level MAC scheduling. EURECOM Sophia Antipolis
- Anas A. Bisu, Andrew Gallant, Hongjian Sun, Katharine Brigham, and Alan Purvis (2018). Telemedicine via Satellite: Improving Access to Healthcare for Remote Rural Communities in Africa978-1-5386-5051-6/18/$31.00 c 2018 IEEE
- James, K. G., Odimayomi, P. K., and Shaba, A. H. (2011). Telemedicine Development in Nigeria”. National Space Research and Development Agency, Abuja, Nigeria.
- Ogirima, S. A. O. (2018). Collaborative and Adaptive Framework for Telediagnosis and Prescription in Herbal Medicine.”, A Ph.D. Thesis in Partial fulfillment of the requirement for the award of Doctor of Philosophy (Ph.D.) Degree in Computer Science, Department of Computer Science and Engineering, Ladoke Akintola University of Technology, Ogbomoso, Nigeria 1-227, 2018.
- Claudio, M. A. de Ol. L., Alexandra, M. V. M., Érica, B. R., Silvia, M. P., Leandro, S. X. da S., and Mário, J. J. (2007). Videoconferences. Systematization and Experiments in Telemedicine. Radiol Bras 2007; 40(5):pp341–344.
- Kassab, K., Jean-Christophe, L., Jean-Baptiste, A., Franck, M. and Christian, P. (2012). Scars collaborative telediagnosis platform using adaptive image flow. https://hal.archives-ouvertes.fr/hal-00790426 pp 1-12
- Sanchez-Santana, M., Jean-Baptiste, A., Betbeder, M. and Lapayre J. (2013). A tool for telediagnosis of cardiovascular Diseaese in a Collaborative and Adaptive Approach. Journal of Universal Computer Science, 19: 1275-1294
- Lai, J. C. K., Woo J., Hui, E., and Chan, W. M. (2004). Telerehabilitation — a new model for community-based stroke rehabilitation. Journal of Telemedicine and Telecare, 10: 199- 205.
- Wiborg, A.M.D. and Widder, B.M.D.P. for the TSG. (2003). Teleneurology to provide Stroke Care in Rural areas. The Telemedicine in Stroke in Swabia (TESS) Project. Stroke; 34: 2951-2956.
- Reinhard-Langmann, H. H., Harald, J., Sergio, D. C. O., Zoe, G. V., Amilcar, B. G., Maria, T. and Mijares, P.2011). TeleMedSys – Web-based Telemedical System for rural Areas”, REV 2011 – www.rev-conference.org 4: 1-4
- Ronnie, M. P., Jean-Christophe L., and Eric G. (2017). Development of an Adaptive Videoconferencing Framework for Collaborative Telemedicine. International Conference On Computer Supported Cooperative Work in Design, Apr 2017, Wellington, New Zealand. Hal-02991559.
- Moon Y, Hyun J, Oh J, Lee K, Lee YS, Kim JK A (2021). Wi-Fi–Based Mask-Type Laryngoscope for Telediagnosis during the COVID-19 Pandemic: Instrument Validation Study. Journal of Medical Internet Research 23(10):e31224 doi: 10.2196/31224 https://www.jmir.org/2021/10/e31224 PMID: 34518154.
- Chowdhury, A., Chien, H-K., Khire, S., Fan, S-H., Jayant, N., and Chang, G-K. (2010). Converged Broadband Optical and Wireless Communication Infrastructure for Next-Generation Telehealth. 978-1-4244-6376-3/10/$26.00 ©2010 IEEE.
- International Telecommunication Union (2016) ITU: committed to connecting the world. Available at: http://www.itu.int/en/ Pages/default.aspx (accessed 2 July 2016)