Harmonic and Sequence Component Estimation by a Novel Method

(This article belongs to the Special Issue on SP1 (Special Issue on Multidisciplinary Sciences and Advanced Technology 2022) and the Section Electrical Engineering (ELE))
Export Citations
Cite
Rath, A. and Saha, R. (2022). Harmonic and Sequence Component Estimation by a Novel Method. Journal of Engineering Research and Sciences, 1(2), 01–09. https://doi.org/10.55708/js0102001
Abinash Rath and Rumpa Saha. "Harmonic and Sequence Component Estimation by a Novel Method." Journal of Engineering Research and Sciences 1, no. 2 (March 2022): 01–09. https://doi.org/10.55708/js0102001
A. Rath and R. Saha, "Harmonic and Sequence Component Estimation by a Novel Method," Journal of Engineering Research and Sciences, vol. 1, no. 2, pp. 01–09, Mar. 2022, doi: 10.55708/js0102001.
Power quality monitoring is one of the most important aspects of designing of compensators and other FACTS devices used in the power system. This paper aims at finding the power quality indices from the voltage and current samples of a harmonic polluted grid, by using a newly proposed sample manipulating technique. Here, all the harmonic components of voltage, current, active and reactive powers are estimated along with the total harmonic distortion (THD) of the grid voltage and current waveforms. All the estimations are done using the sample values of the grid voltage and current signals along with only one standard sinusoidal signal of the fundamental frequency where conventional methods require standard signals of all the harmonic frequencies. Hence, the requisite memory space for the proposed scheme is reduced. In addition to that, the rms values of the sequence components in an unbalanced grid is estimated using the sample shifting technique. The proposed techniques are been verified with MATLAB simulation results and a comparative analysis is presented. The proposed method is also verified upon the real-time data extracted from a digital storage oscilloscope (DSO).
1. Introduction
This Injection of other frequency components (harmonics) is getting proliferated with the increase in various non-linear loads, power electronic drives, [1] unbalanced load distribution, and introduction of renewable energy sources [2] in the existing power system which distorts the quality of power. Large power converters which can be modelled as a non-linear load also form a large source of harmonics. Hence researchers have been trying to improve system performance by improving the converter control algorithms as described in [3], [4]. Estimation of the harmonic components in a power system have great contribution in the filter designing aspect.
With poor power quality customer’s sensitive devices are affected leading to data loss, corruption or damage of data, physical damage of sensitive devices [5]. There can be effects in terms of mal-operation in microprocessor-based technology which includes programmable logic controllers (PLC), Variable Speed Drives (VSD) etc. In other process control equipments, [6] flickering of computer screens, or complete loss of the power supply can also occur. Hence, the determination of the harmonic components or identifying the power quality problem becomes the step towards solving the power quality problem. Many researchers have been therefore interested in finding the characteristics of the load by observing the patterns of its current waveforms [7], [8].
The literature shows many methods of estimating the harmonic components from the voltage and current samples of a non-ideal grid [9]. The Fourier series method is widely used for simplicity [9]. The Fourier series method requires samples of sine and cosine waves of each harmonic frequency. This requires large memory space which is not always available in the RAM of a low-cost microcontroller. Introduction of the sample shifting technique has reduced much of the memory space requirement in which the standard signal waveform is shifted through different phase angles to achieve the power estimations for different orders of the harmonics [10]. This method becomes complex as the shifting of the waveform has to be done by different angles. The Sample Shifting Technique (SST) in [10] is modified such that the all the parameter estimation can be done only by shifting the waveform by an angle 900 avoiding the multiple shifting of the standard signal waveform [11].
This paper proposes a noble Sample Manipulating Technique (SMT) which determines all the harmonic components of voltage, current, active power, reactive power, and the power quality indices of the grid from its voltage and current samples using only a single standard signal. This reduces the memory requirement. This method avoids the measurement of the phase angle for calculating both active and reactive power thus, the error associated with it is eliminated. The accuracy and effectiveness of the proposed method are verified by MATLAB simulation results and a comparative analysis is presented by comparing the obtained results with the existing methods in the literature.
2. Materials and Methods
2.1. Rms value of voltage and current signal
Let the voltage and current in a harmonically polluted grid be as given in (1) and (2).
$$v(t)=\sum_{n=1}^{h} v_n \sin(n\omega t+\varphi_n) \tag{1}$$
$$i(t)=\sum_{n=1}^{h} i_n \sin(n\omega t+\alpha_n) \tag{2}$$
According to the IEEE standard, 1459-2010, [12] the voltage and current rms values are estimated from their respective sample values of voltage signals using (3). [13]
$$\left\{
\begin{aligned}
V_{\mathrm{rms}}
&=\sqrt{\frac{1}{2\pi}\int_{0}^{2\pi} v^2\,d(\omega t)}
=\sqrt{\frac{1}{N}\sum_{j=1}^{N} v_j^{2}} \\
i_{\mathrm{rms}}
&=\sqrt{\frac{1}{2\pi}\int_{0}^{2\pi} i^2\,d(\omega t)}
=\sqrt{\frac{1}{N}\sum_{j=1}^{N} i_j^{2}}
\end{aligned}
\right.
\tag{3}$$
The individual harmonic components of active and reactive powers can be defined by (4-5) [14], [13].
$$P_n=V_{\mathrm{rms}} I_{\mathrm{rms}} \cos\phi_n\tag{4}$$
$$P_n=V_{\mathrm{rms}} I_{\mathrm{rms}} \cos\phi_n \tag{5}$$
Pn and Qn represent the active and reactive power consumed by ‘nth’ harmonic. Vnrms, and Inrms represent the rms values of ‘nth’ harmonics of voltage and current respectively.‘ ’ is defined as
$$\phi_n=\varphi_n-\alpha_n \tag{6}$$
According to Fortescue’s theorem, the three unbalanced phasors of a three-phase system can be resolved into three balanced systems of phasors. The balanced sets of components are positive sequence component (Va1), negative sequence component (Va2), and zero sequence component(Va0).
$$\left\{
\begin{aligned}
V_{a1} &= \frac{1}{3}\left(V_a + aV_b + a^2 V_c\right) \\
V_{a2} &= \frac{1}{3}\left(V_a + a^2 V_b + a V_c\right) \\
V_{a0} &= \frac{1}{3}\left(V_a + V_b + V_c\right)
\end{aligned}
\right.
\tag{7}$$
where ‘a’ is an operator which shift the operand waveform by 1200.
$$a=1\angle120^\circ$$
3. Fourier Series Method
Any periodic non-sinusoidal signal can be represented by the Fourier series. The phase and ma–gnitude of the individual harmonic components of the signal can be determined by using the Fourier series technique [15].
If f(t) is a periodic function, we can represent it by the following way as shown in (8) and (9) [15].
$$f(t)=a_0+\sum_{n=1}^{n}\left(a_n\cos n\omega t+b_n\sin n\omega t\right) \tag{8}$$
$$f(t)=a_0+\sum_{n=1}^{n} c_n\cos(n\omega t-\varphi) \tag{9}$$
To calculate an, bn in the digital domain, the following expression is used. Where samples of sin nωt and cos nωt are created. They are multiplied with the samples of f(t) to produce the Fourier coefficients [16].
$$a_n=\frac{1}{N}\sum_{k=1}^{N} v_k\cos(n\omega t)_k \tag{10}$$
$$b_n=\frac{1}{N}\sum_{k=1}^{N} v_k\sin(n\omega t)_k \tag{11}$$
$$c_n=\sqrt{a_n^2+b_n^2} \tag{12}$$
$$\varphi_n=\tan^{-1}\!\left(\frac{b_n}{a_n}\right) \tag{13}$$
where ‘N’ is the number of samples per cycle and cos(nωt)k sin (nωt)k represent the ‘kth’ sample of cos nωt and sin (nωt) respectively. By using (4-5), the active and reactive power components are calculated.
4. Sample Manipulating Technique
The basic idea of the proposed technique is to estimate the active power (P) and reactive power (Q) along with total harmonic distortion (THD) with this digital measurement process. In the Fourier method, the phase angle between the voltage and current phasor along with standard signals of each harmonic frequency is required for the power calculations. But, the proposed Sample Manipulating Technique (SMT) calculates the active and reactive power of each harmonic component without the phase angle information. It also uses only one standard signal of a single frequency that is the fundamental. Thus, the error in active and reactive power calculation due to the phase angles standard signal only.
4.1. Measurement of the voltage in ideal grid condition
Let us assume, v(t) is the voltage samples which is given as (14).
$$v(t)=v_m\sin(\omega t+\varphi) \tag{14}$$
when v(t) is multiplied with a standard signal and averaged over one cycle, the result is given in (15).
$$\frac{1}{2\pi}\int_{0}^{2\pi} v(t)\,S(t)\,d\omega t=V_{\mathrm{rms}}\cos\phi \tag{15}$$
where the standard signal is taken as (16)
$$S=\sqrt{2}\sin\omega t \tag{16}$$
Similarly, if \(\sqrt{2}\cos\omega t\) is multiplied with v(t) and integrated from zero to 2π, the following results.
$$\frac{1}{2\pi}\int_{0}^{2\pi} v(t)\,S(t-90^\circ)\,d\omega t=V_{\mathrm{rms}}\sin\varphi \tag{17}$$
In the discrete domain, (16) and (17) can be represented in the following way as (18) and (19) respectively.
$$V_{1\cos}=V_{\mathrm{rms}}\cos\varphi=\frac{1}{N}\sum_{n=1}^{N} v_n S_n \tag{18}$$
$$V_{1\sin}=V_{\mathrm{rms}}\sin\varphi=\frac{1}{N}\sum_{n=1}^{N} v_n S_{-90^\circ n} \tag{19}$$
where ‘vn’ the voltage samples and Sn is the samples taken of the standard signal, S-900n is the Sn samples shifted by angle 900. S-900n is produced using the sample shifting technique. [11] From (18) and (19) the rms value of the measuring voltage signal can be calculated.
$$V_{\mathrm{rms}}=\sqrt{(V_{1\cos})^2+(V_{1\sin})^2} \tag{20}$$
4.2. Measurement of voltage harmonic components in non-ideal condition
But the input voltage will not be pure sine wave always. Suppose the voltage equation is given as
$$v(t)=v_1+v_2+\cdots+v_n \tag{21}$$
where v1,v2,vn are mathematically given by
$$v_1=v_{m1}\sin(\omega t+\varphi_1)$$
$$v_2=v_{m2}\sin(2\omega t+\varphi_2)$$
$$v_n=v_{mn}\sin(n\omega t+\varphi_n)$$
4.2.1. Calculation of the fundamental component of v(t)
If v(t) is multiplied with the standard signal, the has resulted expression is given in (22a).
$$\begin{aligned}
V_{1\cos}
&=\frac{1}{2\pi}\int_{0}^{2\pi} v(t)\,S(t)\,d(\omega t) \\
&=\frac{1}{2\pi}\int_{0}^{2\pi} v_{m1}\sin(\omega t+\varphi_1)\sqrt{2}\sin(\omega t)\,d(\omega t) \\
&\quad+\frac{1}{2\pi}\int_{0}^{2\pi} v_{m3}\sin(3\omega t+\varphi_3)\sqrt{2}\sin(\omega t)\,d(\omega t) \\
&\quad+\frac{1}{2\pi}\int_{0}^{2\pi} v_{m7}\sin(7\omega t+\varphi_7)\sqrt{2}\sin(\omega t)\,d(\omega t)
\end{aligned}
\tag{22a}$$
The 2nd and 3rd integrals in the above expression are evaluated to be zero. Hence, the final result is given in (22b).
$$\frac{V_{m1}}{\sqrt{2}}\cos\varphi_1=V_{1\mathrm{rms}}\cos\varphi_1 \tag{22b}$$
Similarly, if \(\sqrt{2}\cos\omega t\) is multiplied with the voltage sample and integrated, the result comes as presented in (23a).
$$\begin{aligned}
V_{1\sin}
&=\frac{1}{2\pi}\int_{0}^{2\pi} v(t)\,S(t-90^\circ)\,d(\omega t) \\
&=\frac{1}{2\pi}\int_{0}^{2\pi} v_{m1}\sin(\omega t+\varphi_1)\sqrt{2}\cos(\omega t)\,d(\omega t) \\
&\quad+\frac{1}{2\pi}\int_{0}^{2\pi} v_{m3}\sin(3\omega t+\varphi_3)\sqrt{2}\cos(\omega t)\,d(\omega t) \\
&\quad+\frac{1}{2\pi}\int_{0}^{2\pi} v_{m7}\sin(7\omega t+\varphi_7)\sqrt{2}\cos(\omega t)\,d(\omega t)
\end{aligned}
\tag{23a}$$
$$\frac{V_{m1}}{\sqrt{2}}\sin\varphi_1=V_{1\mathrm{rms}}\sin\varphi_1 \tag{23b}$$
From (22b) and (23b), the rms value of the voltage signal can be calculated as shown in (24).
$$V_{\mathrm{rms}}=\sqrt{(V_{1\cos})^2+(V_{1\sin})^2} \tag{24}$$
In the discrete domain (22) and (23) can be evaluated as presented in (25-26).
$$V_{1\cos}=V_{\mathrm{rms}}\cos\varphi=\frac{1}{N}\sum_{n=1}^{N} v_n S_n \tag{25}$$
$$V_{1\sin}=V_{\mathrm{rms}}\sin\varphi=\frac{1}{N}\sum_{n=1}^{N} v_n S_{-90^\circ n} \tag{26}$$
4.2.2. Evaluation of ‘nth’ order harmonic
To evaluate the ‘nth’ order harmonic, it’s required to multiply a signal having its frequency raised n times as the frequency of the standard signal with the voltage and current sample and then integrate.
$$V_{n\cos}=\frac{1}{2\pi}\int_{0}^{2\pi} v(\omega t)\,S(n\omega t)\,d(\omega t) \tag{27}$$
$$V_{n\sin}=\frac{1}{2\pi}\int_{0}^{2\pi} v(\omega t)\,S(n\omega t-90^\circ)\,d(\omega t) \tag{28}$$
But in this paper, only one standard signal is used which has a frequency equal to the fundamental frequency present in the voltage sample. So in a discrete domain, (27) and (28) are realized as (29) and (30).
$$V_{n\cos}=\frac{1}{N}\sum_{k=0}^{N} V_{k+1} S_{nk+1} \tag{29}$$
$$V_{n\sin}=\frac{1}{N}\sum_{k=0}^{N} V_{k+1} S_{-90^\circ nk+1} \tag{30}$$
During the calculation of the summation series replace (nk+1) with (nk+1-N) when (nk+1) goes beyond ‘N’. The rms value of the ‘nth’ harmonic component of the voltage waveform can the calculated using (29) and (30) as presented in (31).
$$V_{n\mathrm{rms}}=\sqrt{(V_{n\cos})^2+(V_{n\sin})^2} \tag{31}$$
Table 1: Illustration of SMT
For Fundamental | For 3rd Harmonic | For 5th Harmonic | For 7th Harmonic |
v(1).S(1) | v(1).S(1) | v(1).S(1) | v(1).S(1) |
v(2).S(2) | v(2).S(4) | v(2).S(6) | v(2).S(8) |
v(3).S(3) | v(3).S(7) | v(3).S(11) | v(3).S(15) |
v(4).S(4) | v(4).S(10) | v(4).S(16) | v(4).S(2) |
v(5).S(5) | v(5).S(13) | v(5).S(1) | v(5).S(9) |
v(6).S(6) | v(6).S(16) | v(6).S(6) | v(6).S(16) |
v(7).S(7) | v(7).S(19) | v(7).S(11) | v(7).S(3) |
v(8).S(8) | v(8).S(1) | v(1).S(16) | v(1).S(10) |
…. | …. | …. | …. |
…. | …. | …. | …. |
v(16).S(16) | v(16).S(6) | v(16).S(16) | v(16).S(6) |
v(17) .S(17) | v(17) .S(9) | v(17) .S(1) | v(17) S(13) |
v(18) .S(18) | v(18) S(12) | v(18) .S(6) | v(18) S(20) |
v(19) .S(19) | v(19) S(15) | v(19) .S(11) | v(19)S(7) |
v(20) .S(20) | v(20) S(18) | v(20) .S(16) | v(20) S(14) |
4.3. Measurement of current in ideal condition
Suppose i(t) is the current signal which is mathematically represented by (32).
$$i(t)=i_m\sin(\omega t+\alpha) \tag{32}$$
irms. cos α and irms. sin αcan be calculated as (13) and (14) in the discrete domain
$$I_{1\cos}=I_{\mathrm{rms}}\cos\alpha=\frac{1}{N}\sum_{n=1}^{N} i_n S_n \tag{33}$$
$$I_{1\sin}=I_{\mathrm{rms}}\sin\alpha=\frac{1}{N}\sum_{n=1}^{N} i_n S_{-90^\circ n} \tag{34}$$
$$I_{\mathrm{rms}}=\sqrt{(I_{1\cos})^2+(I_{1\sin})^2} \tag{35}$$
4.4. Measurement of current harmonics in non-ideal condition
Suppose the current is not pure sinusoidal and given by the following
$$i(t)=i_1+i_2+\cdots+i_n$$
where i1, i2,…,in are mathematically represented as the following
$$i_1=i_{m1}\sin(\omega t+\alpha_1)$$
$$i_2=i_{m2}\sin(\omega t+\alpha_2)$$
$$i_n=i_{mn}\sin(n\omega t+\alpha_n)$$
4.4.1. Calculation of the fundamental components of i(t)
The current sample is multiplied with the standard signal to produce the following result.
$$I_{1\cos}=\frac{1}{2\pi}\int_{0}^{2\pi} i(t)S(t)\,d(\omega t)=\frac{i_{m1}}{\sqrt{2}}\cos\alpha_1=I_{\mathrm{rms}1}\cos\alpha_1$$
To evaluate I1sin, S(t-900) that is \(\sqrt{2}\cos\omega t\)is multiplied with the current samples and then integrated.
$$I_{1\sin}=\frac{1}{2\pi}\int_{0}^{2\pi} i(t)S(t-90^\circ)\,d(\omega t)=\frac{i_{m1}}{\sqrt{2}}\sin\alpha_1=I_{\mathrm{rms}1}\sin\alpha_1$$
4.4.2. Evaluation of ‘nth’ order harmonic
The ‘nth’ order harmonic of current can be calculated just by replacing the voltage samples with current samples in (29-30).
$$i_{n\cos}=\frac{1}{N}\sum_{k=0}^{N} i_{k+1} S_{nk+1} \tag{36}$$
$$i_{n\sin}=\frac{1}{N}\sum_{k=0}^{N} i_{k+1} S_{-90^\circ nk+1} \tag{37}$$
4.5. Measurement of Active and Reactive power
As per (3) and (4), the individual harmonic components of real power (P), and reactive power (Q) for the nth order harmonic are given by (38) and (39) respectively.
$$P_n=V_{\mathrm{rms}}I_{\mathrm{rms}}\cos(\varphi_n-\alpha_n)
=(V_{\mathrm{rms}}\cos\varphi_n)(I_{\mathrm{rms}}\cos\alpha_n)
+(V_{\mathrm{rms}}\sin\varphi_n)(I_{\mathrm{rms}}\sin\alpha_n)
=V_{n\cos}I_{n\cos}+V_{n\sin}I_{n\sin} \tag{38}$$
$$Q_n=V_{\mathrm{rms}}I_{\mathrm{rms}}\sin(\varphi_n-\alpha_n)
=(V_{\mathrm{rms}}\sin\varphi_n)(I_{\mathrm{rms}}\cos\alpha_n)
-(V_{\mathrm{rms}}\cos\varphi_n)(I_{\mathrm{rms}}\sin\alpha_n)
=V_{n\sin}I_{n\cos}-V_{n\cos}I_{n\sin} \tag{39}$$
In (38) and (39) the pre-calculated values of Vncos , Incos,Vnsin , Insin are used from (30), (36), (31) and (37) respectively. For the fundamental ‘n’ is replaced by 1. That is V1cos , I1cos,V1sin, I1sin are used from (25), (33), (26), and (34) respectively.
4.6. Measurement of Total Harmonic Distortion (THD)
The overall deviation of a distorted wave from its fundamental can be estimated with the help of the total harmonic distortion. The total harmonic distortion of the voltage and current waveforms are estimated as (40) and (41) respectively. [12] [11]
$$\mathrm{THD}_v=\frac{\sqrt{\sum V_{\mathrm{rms}}^{2}}}{V_{1\mathrm{rms}}} \tag{40}$$
$$\mathrm{THD}_i=\frac{\sqrt{\sum I_{\mathrm{rms}}^{2}}}{I_{1\mathrm{rms}}} \tag{41}$$
5. Sample Shifting Technique (SST) and Sequence component estimation
The sample shifting technique (SST) produces a cosine wave from sine wave just by shifting the sample values by an angle 900. The shifting of the wave is illustrated in Figure. 1.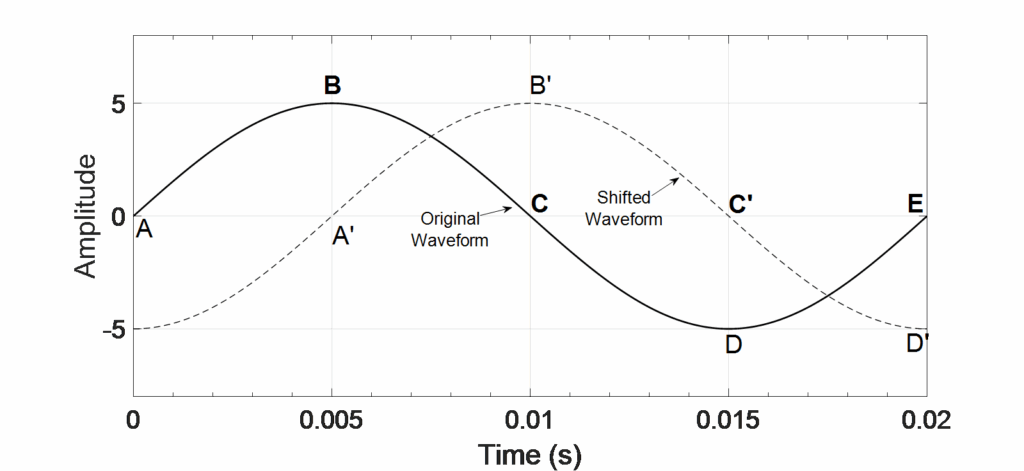
Figure 1: Illustration of the Sample Shifting Technique (SST)
Here A-B-C-D-E is the original wave. Suppose the whole cycle of the sine wave contains an ‘N’ number of samples.
To generate a waveform that is shifted by 900, the N/4th Sample value of the original wave is taken as the 1st sample of the shifted wave and this process continues till the Nth sample of the original wave is put into the ‘3N/4th’ sample of the shifted wave. Then from the 3N/4th sample to the Nth sample of the shifted wave carries the sample values of 1st to (N/4-1)th sample of the shifted wave.
6. Results
6.1. Implementation on a Theoretical System
The numerical example given in the IEEE 1459-2010 [12] standards is taken for producing composite signals for voltage and current waves. The magnitude of voltage, the magnitude of current, active power, reactive power, and THD are estimated using both the techniques, and the comparative results are presented in Table 2-6. For all the methods, the sampling frequency is taken as 10 kHz.
$$v(t)=100\sqrt{2}\sin(\omega t-0^\circ)
+8\sqrt{2}\sin(3\omega t-70^\circ)
+15\sqrt{2}\sin(5\omega t+140^\circ)
+5\sqrt{2}\sin(7\omega t+20^\circ)$$
$$i(t)=100\sqrt{2}\sin(\omega t-30^\circ)
+20\sqrt{2}\sin(3\omega t-165^\circ)
+15\sqrt{2}\sin(5\omega t-127^\circ)
+10\sqrt{2}\sin(7\omega t+288^\circ)$$
Table 2: Comparative Magnitude of Individual Voltage Harmonic Components
Order of Harmonics | Rms Value of Voltage (in Volt) | % Difference | |||
Theoretical | Fourier | SMT | Fourier | SMT | |
1 | 100 | 99.995 | 100.00 | 0.000 | 0 |
3 | 8 | 8.004 | 7.999 | 0.000 | 0.000 |
5 | 15 | 14.995 | 15.006 | 0.000 | 0.000 |
7 | 5 | 5.000 | 5.000 | 0.000 | 0 |
Table 3: Comparative Magnitude of Individual Current Harmonic Components
Order of Harmonics | Rms Value of Current (in Amp) | % Difference | |||
Theoretical | Fourier | SMT | Fourier | SMT | |
1 | 100 | 99.998 | 100.00 | 0.000 | 0 |
3 | 20 | 19.994 | 20.002 | 0.000 | 0.000 |
5 | 15 | 15.008 | 15.006 | 0.000 | 0.000 |
7 | 10 | 10.0153 | 10.007 | 0.0015 | 0.000 |
Table 4: Comparative Magnitude of Individual Active Power Components
Order of Harmonics | Active Power (in Watt) | %Difference | |||
Theoretical | SMT | Fourier | Fourier | SMT | |
1 | 8660 | 8660.3 | 8659.6 | 0.000 | 0.000 |
3 | -13.94 | -13.94 | -14.0 | -0.004 | 0 |
5 | -11.78 | -11.9 | -11.9 | -0.01 | -0.01 |
7 | –1.74 | -1.8 | -1.8 | -0.0227 | -0.022 |
Table 5: Comparative Magnitude of Individual Reactive Power Components
Order of Harmonics | Reactive Power (in Var) | % Difference | |||
Theoretical | SMT | Fourier | Fourier | SMT | |
1 | 5000 | 5000 | 5000 | 0 | 0 |
3 | 159.4 | 159.4 | 159.4 | 0 | 0 |
5 | -224.69 | -224.8 | -224.8 | -0.004 | -0.004 |
7 | 49.97 | 50.0 | 50.0 | 0.000 | 0.000 |
Table 6: Comparative Result of THD
Parameters | Theoretical | THDv | THDi | % Difference |
THDv | 0.177 | 0.177 | 0.177 | 0 |
THDI | 0.269 | 0.269 | 0.269 | 0 |
In Table 2, the theoretical and estimated value values of the given harmonics from the conventional as well as the proposed method are presented. It can be observed that both methods are able to correctly estimate each of the harmonics present in the voltage signal. Similar observations can be derived for the current estimations which are presented in Table 3. Estimations of active power (P), reactive power (Q) presented in Table 4 and 5 are observed to give correct estimations with the proposed method and the conventional method. Voltage and line current THD values presented in Table 6 shows that the SMT is able to replicate the exact theoretical values of THDv and THDI.
6.2. Implementation into a Practical System
To implement the proposed methods on practical system data, the load voltage and load current sample values are collected from a DSO. The load used here is a household stand-fan. The waveform of the load voltage and current is presented in Figure. 2.

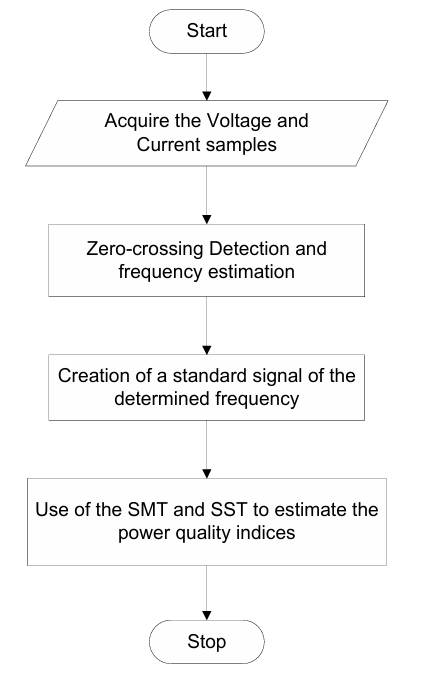
The knowledge of the frequency of the sampled signal is very important to produce the standard signal. So at first the frequency of the sampled signal is determined by zero-crossing detection (ZCD) [17]. Then the standard signal is generated of this frequency. Now, this standard signal is used to calculate the magnitude of individual harmonic components of voltage, current, active power, and reactive power and compared with values obtained by the conventional method. The comparative results are given in Table 7 to Table 11 which present the individual harmonic components of the supply voltage, source current drawn by the load, the consumed active power, the consumed reactive power and the THD in the voltage and current waveforms in the respective order. The Fourier method is considered to be bench mark for the computation of the above mentioned parameters. The values of the above mentioned parameters obtained using the proposed method of SMT is also very close to the values obtained in the classical method. To quantify the accuracy of the proposed estimation process, percentage difference for each of the obtained with reference to the value obtained in classical method is presented in Table 7 to Table 11. It can be observed that the percentage difference in each case is found to be very low. This signifies the proposed estimation process is fairly accurate.
Table 7: Comparative Result of Magnitude of Individual Voltage Harmonic Components
Order of Harmonics | Rms Value of Voltage (in Volt) | Difference (in %) | |
SMT | Fourier | ||
1 | 245.0711 | 244.7811 | 0.001 |
3 | 2.2120 | 1.9659 | 0.111 |
5 | 1.3827 | 1.5252 | 0.103 |
7 | 2.8074 | 2.6893 | 0.042 |
Table 8: Comparative Result of Magnitude of Individual Current Harmonic Components
Order of Harmonics | Rms Value of Current (in Amp) | Difference (in %) | |
SMT | Fourier | ||
1 | 0.5606 | 0.5597 | 0.001 |
3 | 0.1101 | 0.1107 | 0.000 |
5 | 0.0737 | 0.0737 | 0 |
7 | 0.0352 | 0.0350 | 0.000 |
Table 9: Comparative Result of Magnitude of Individual Harmonic Components of Active Power
Order of Harmonics | Active Power (in Watt) | Difference (in %) | |
SMT | Fourier | ||
1 | 134.8939 | 134.5448 | 0.002 |
3 | -0.1886 | -0.1567 | 0.169 |
5 | -0.0281 | -0.0261 | 0.028 |
7 | 0.0980 | 0.0937 | 0.043 |
Table 10: Comparative Result of Magnitude of Individual Harmonic Components of Reactive Power
Order of Harmonics | Reactive Power (in Var) | Difference (in %) | |
SMT | Fourier | ||
1 | 26.0049 | 25.8936 | 0.004 |
3 | -0.1540 | -0.1510 | 0.019 |
5 | 0.0980 | 0.1094 | -0.116 |
7 | -0.0120 | -0.0099 | -.0175 |
Table 11: Comparative Result of THD
Parameters | SMT | Fourier | % Difference |
THDv (in %) | 0.0161 | 0.0152 | 0.055 |
THDi (in %) | 0.2446 | 0.2457 | -0.004 |
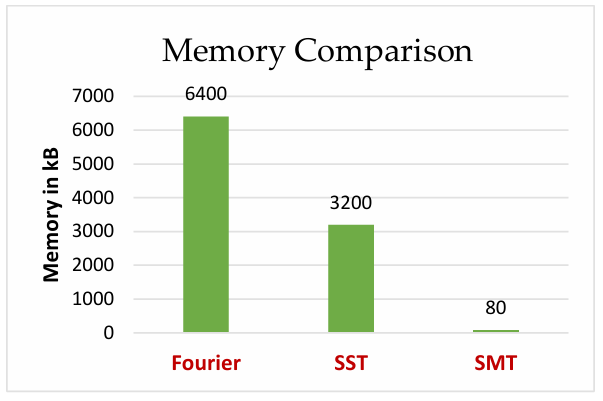
Figure 3 shows a comparative investigation of the memory requirement to store all the sample values of the standard signals used for different techniques for estimation of harmonics up to the 40th order. Here the memory requirement is compared with the Fourier method and the Sample Shifting Technique. The proposed technique requires only 80 kB memory to store the required standard signal where the Fourier method requires 6400 kB and SST requires 3200 kB which are 80 and 40 times more it.
The whole process of this implementation is represented in a flowchart which is presented in Figure 4.

6.3. Sequence Component Estimation by SST
A numerical example from [18] is taken up for implementation of the method which describes the unbalanced condition as the following.
$$\begin{aligned}
V_a &= 100\angle 0^\circ \\
V_b &= 33\angle -100^\circ \\
V_c &= 38\angle 176.5^\circ
\end{aligned}$$
The symmetrical components are determined using SST and the comparative result is shown in Table 12 with analytically determined value of the same parameters in the book.
Table 12: The Symmetrical Components for Unbalanced Condition
Sequence Components | Analytical | SST | % Difference |
Va1 | 52.6474 | 52.6539 | -0.0001 |
Va2 | 30.8549 | 30.8559 | -0.0000 |
Va0 | 21.3047 | 21.3047 | 0.0000 |
A three-phase, 60Hz, 735 kV power system transmitting power from a power plant consisting of six 350 MVA generators to an equivalent network through a 600 km transmission line is modelled in Simulink as shown in Figure 5. The transmission line is split into two 300 km lines connected between buses B1, B2, and B3. The generators are simulated with a simplified synchronous machine block. Voltages and currents are measured in B2 blocks. After the fault is introduced the voltage and current samples are imported from the bus bar for SLG, LL, LLG, fault conditions. The SST is used as the tool to find all the sequence components which are tabulated in Table 13. For the SLG, all the sequence components of the current have the same value up to two decimal places i.e. 27.39 A. For LL fault the magnitude of positive and negative sequence components of voltage and current are identical i.e. 0.35 pu and 17.13 A respectively confirming its theoretical correctness. For LLG fault, all their voltage sequence components have identical values of 0.19 pu. This again shows its theoretical truthfulness.
Table 13: Estimated sequence components for different faults
Type of Fault | Sequence Components of the three-phase voltage | Sequence Components of the three-phase Current | ||||
(Va1) | (Va2) | (Va0) | (Ia1) | (Ia2) | (Ia0) | |
SLG | 0.4331 | 0.2730 | 0.1634 | 27.3954 | 27.3909 | 27.3902 |
LL | 0.3543 | 0.3500 | 6.8547e-06 | 17.1318 | -17.1383 | 6.04e-04 |
LLG | 0.0260 | 0.0260 | 0.1920 | 36.5989 | 27.9187 | 36.6365 |
7. Conclusions
In this paper, a noble SMT is proposed for the estimation of power quality indices in a non-ideal grid. In addition to that, and the sequence component estimation by SST are proposed. The results obtained by the proposed SMT is compared with the classical Fourier series method. The comparative analysis shows that the proposed method produces reliable results. Furthermore, SMT does not need the measuring of the phase angle between the voltage and current signal. The comparative analysis of the memory space requirement proves that the use of SMT reduces the memory requirement considerably which gives the user the flexibility to use a low-cost microcontroller having less memory. On the other hand, it can be understood that the accuracy level for higher-order harmonics goes on decreasing as the standard signal has less number of samples per each cycle at the higher-order harmonics.
Conflict of Interest
The authors declare no conflict of interest.
Acknowledgment
The authors acknowledge National Institute of Technology, Rourkela for the necessary support.
- D. W. Petro, R. L. Wood, “Power quality issues regarding adjustable speed drives in petroleum terminals,” pp. 227–234, 2002, doi:10.1109/pcicon.1994.347611.
- T. Ise, Y. Hayashi, K. Tsuji, “Definitions of power quality levels and the simplest approach for unbundled power quality services,” Proceedings of International Conference on Harmonics and Quality of Power, ICHQP, vol. 2, pp. 385–390, 2000, doi:10.1109/ICHQP.2000.897711.
- A. Rath et al., “Power quality improvement using 18 sector algorithm based direct power control,” International Transactions on Electrical Energy Systems, no. April 2020, pp. 1–17, 2021, doi:10.1002/2050-7038.12784.
- A. Rath, G. Srungavarapu, M. Pattnaik, “ An advanced virtual flux integrated multifold table‐based direct power control with delay compensation for active front‐end rectifiers ,” International Transactions on Electrical Energy Systems, no. October, pp. 1–22, 2021, doi:10.1002/2050-7038.13174.
- S. Bhattacharyya, J. M. A. Myrzik, W. L. Kling, “Consequences of poor power quality – An overview,” Proceedings of the Universities Power Engineering Conference, no. 1, pp. 651–656, 2007, doi:10.1109/UPEC.2007.4469025.
- K. Schipman, F. Delincé, “The importance of good power quality,” –, pp. 1–20, 2010.
- R. Saha, J. N. Bera, G. Sarkar, “An Improved Method for Load Taxonomy Using Sample Shifting Technique and Signature Analysis,” Electric Power Components and Systems, vol. 47, no. 1–2, pp. 113–127, 2019, doi:10.1080/15325008.2019.1577928.
- A. S. Kulkarni, C. K. Harnett, K. C. Welch, “EMF signature for appliance classification,” IEEE Sensors Journal, vol. 15, no. 6, pp. 3573–3581, 2015, doi:10.1109/JSEN.2014.2379113.
- Y. C. Chen, J. K. Lan, “Implementation of power measurement system with fourier series and zero-crossing algorithm,” Proceedings – 2014 International Symposium on Computer, Consumer and Control, IS3C 2014, pp. 601–604, 2014, doi:10.1109/IS3C.2014.163.
- R. Saha et al., “Sample shifting technique (SST) for estimation of harmonic power in polluted environment,” Proceedings of IEEE International Conference on Circuit, Power and Computing Technologies, ICCPCT 2013, pp. 535–539, 2013, doi:10.1109/ICCPCT.2013.6528921.
- R. Saha et al., “A simplified state-of-the-art sample shifting technique for microcontroller based single phase power measurement,” Measurement: Journal of the International Measurement Confederation, vol. 58, pp. 459–467, 2014, doi:10.1016/j.measurement.2014.08.016.
- “IEEE Xplore Search Results.” https://ieeexplore.ieee.org/search/searchresult.jsp?newsearch=true&queryText=1459-2010 . (accessed: 17-Dec-2020).
- A. Cataliotti, V. Cosentino, S. Nuccio, “The measurement of reactive energy in polluted distribution power systems: An analysis of the performance of commercial static meters,” IEEE Transactions on Power Delivery, vol. 23, no. 3, pp. 1296–1301, 2008, doi:10.1109/TPWRD.2008.919239.
- M. Gray, W. G. Morsi, “New power quantities definition for low and high order harmonic distortion,” Electric Power Systems Research, vol. 119, pp. 11–18, 2015, doi:10.1016/j.epsr.2014.09.004.
- ananta kankale, “Network theory by alaxander and sadiku.” .
- T. Tarasiuk, “Method, algorithm and device for estimation of components above the harmonic frequency range up to 9 kHz,” Measurement: Journal of the International Measurement Confederation, vol. 44, no. 1, pp. 219–229, 2011, doi:10.1016/j.measurement.2010.09.046.
- S. Väliviita, “Zerocrossing detection of distorted line voltages using 1b measurements,” IEEE Transactions on Industrial Electronics, vol. 46, no. 5, pp. 917922, 1999, doi:10.1109/41.793339.
- C. L. Wadhwa Electrical Power Systems, 6th edition, New Age International, 2006