Ways to Increase the Efficiency of Sucker Rod Pump Units in Oil Production
(This article belongs to the Section Energy and Fuels (ENF))
Export Citations
Cite
Abbas, A. T. , Agaverdi, G. G. , Haji, R. A. , Gabil, A. Y. , Huseyn, R. M. , Nikolaevich, Y. A. and Ilgizovich, K. M. (2022). Ways to Increase the Efficiency of Sucker Rod Pump Units in Oil Production. Journal of Engineering Research and Sciences, 1(3), 01–08. https://doi.org/10.55708/js0103001
Aliev Telman Abbas, Guluyev Gambar Agaverdi, Rzayev Asif Haji, Aliyev Yaver Gabil, Rezvan Mahammad Huseyn, Yashin Anton Nikolaevich and Khakimyanov Marat Ilgizovich. "Ways to Increase the Efficiency of Sucker Rod Pump Units in Oil Production." Journal of Engineering Research and Sciences 1, no. 3 (March 2022): 01–08. https://doi.org/10.55708/js0103001
A.T. Abbas, G.G. Agaverdi, R.A. Haji, A.Y. Gabil, R.M. Huseyn, Y.A. Nikolaevich and K.M. Ilgizovich, "Ways to Increase the Efficiency of Sucker Rod Pump Units in Oil Production," Journal of Engineering Research and Sciences, vol. 1, no. 3, pp. 01–08, Mar. 2022, doi: 10.55708/js0103001.
The article shows that in the middle and late stages of oil field development, of all mechanized methods, the most common is oil extraction by sucker rod pump units (SRPU). However, due to inefficient management of them, their operating costs are increasing. The article presents the results of improving the efficiency of SRPU due to the use of NOISE technology for early diagnosis of the technical condition of equipment and frequency converters for controlling its induction motor. The results of the implementation of the "NOISE Control, Diagnostics and Management Complex for oil wells operated by SRPU" created at the Institute of Management Systems of the National Academy of Sciences of Azerbaijan are presented. A method for calculating the saving of electrical energy in the control of SRPU frequency converters has been developed. The results of calculation of electric energy savings for the oil and gas production facility Bibi-Heybat Oil of the Republic of Azerbaijan are also presented.
1. Introduction
Currently, most oil fields are in the middle and late stages of development, where the reservoir pressure is not sufficient to lift the liquid to the surface of the earth. At the same time, the reservoir pressure is maintained by pumping water into the reservoir, which contributes to an increase in the water content in the total liquid. According to published data, the water content in the liquid extracted from an oil well in the USA is about 90% [1], and in the Russian Federation it is about 86% [2]. At the same time, they are forced to use mechanized methods of oil production. Currently, the main methods of mechanized mining are the use of sucker rod pump units (SRPU) and installations of electric submersible pumps (ESP). The published data indicate that in the Russian Federation 41% of wells are operated by SRPU and 54% by ESP [3], and in the USA more than 85% of wells with mechanized production are equipped with SRPU [4]. They are the main pumping system that provides mechanical energy for oil production [5]. Advantages of SPRU are simplicity, reliability and the possibility of application in a wide range of operating conditions [6].
However, with the use of mechanized mining, due to inefficient management of them, the operating costs of production increase dramatically [7] and, consequently, the production benefits become lower [8]. Thus, at the same time, one of the important issues is to increase the efficiency of SPRU. Research conducted at the Institute of Control Systems of ANAS of Azerbaijan for many years, as well as experience in oil and gas production fields, have shown that the main sources of operating costs are:
- the costs of repairing ground and underground equipment of wells operated with SPRU due to untimely diagnostics and inadequate identification of technical conditions that lead to unnecessary downtime and material costs;
- electricity supply costs.
2. Problem Statement
Thus, one of the possible ways to increase the efficiency of SPRU by reducing the cost of repairing ground and underground equipment of wells using NOISE technology for diagnostics and adequate identification of technical conditions and power supply costs using frequency converters to control an induction motor is given. The task is also set to develop a methodology for calculating the savings of electrical energy when using a frequency-controlled drive of the SPRU.
3. Solving the problem. NOISE technology for early diagnosis and adequate identification of the technical condition of rod deep-pumping units
In the paper robust technology and control system of oil wells SPRU [9], a sequence of calculations is proposed, the totality of which constitutes the procedure for normalizing correlation functions:
1) According to the expression
$$R_{gg}(\mu)=\frac{1}{N}\sum_{i=1}^{N} g(i\Delta t)\,g\!\big((i+\mu)\Delta t\big)$$
estimates of the correlation function of the noisy signal are calculated for μ = 1, 2, 3, 4, …
2) According to the expression
$$D_g=\frac{1}{N}\sum_{i=1}^{N} g(i\Delta t)\,g(i\Delta t)$$
the estimate of the variance of the noisy signal is calculated.
3) According to the expression
$$D_{\varepsilon}
=\frac{1}{N}\sum_{i=1}^{N}
\left[
g^2(i\Delta t)
+ g(i\Delta t)\,g\!\big((i+2)\Delta t\big)
– 2\,g(i\Delta t)\,g\!\big((i+1)\Delta t\big)
\right]$$
an estimate of the interference variance Dε is calculated.
4) According to the expression
$$R_{UU}(\mu=0)=D_g-D_{\varepsilon}$$
the variance value RUU(μ=0) of the useful signal Up(i∆t) is calculated.
5) According to the expression
$$r_{gg}^{R}(\mu)=
\begin{cases}
\frac{R_{gg}(\mu=0)}{D_g}=1, & \text{by } \mu=0, \\
\frac{R_{gg}(\mu)}{D_g-D_{\varepsilon}}=1, & \text{by } \mu\neq 0
\end{cases}$$
estimates of the normalized correlation function rRgg(μ) of the noisy signal g(iΔt) are calculated at μ = 0, 1, 2, 3, …
The proposed procedure makes it possible to calculate robust estimates (free from errors caused by interference in the signal composition) of the normalized autocorrelation function rRgg(μ) of the noisy signal g(iΔt).
The main idea of robust analysis is to develop estimates that are resistant to outliers and at the same time show a result close enough to classical methods on data that do not contain atypical observations.
Applying what has been said to the measured output signal of the force sensor of the column of rods on the suspension of the SPRU, you can make the following procedure for calculating informative signs to identify the technical condition of the SPRU:
- The swing period TST SPRU is divided into 8 equal time intervals ∆TST (For example, if TST = 1024 samples of discrete values of the force signal are taken during the swing period of the SPRU, then ∆TST will be equal to 128 samples);
- The normalized correlation function rRgg(μ) of the noisy force signal g(iΔt) is calculated;
- The estimates of rRgg(μ=0), rRgg(μ=1∆TST), rRgg(μ=2∆TST), …, rRgg(μ=7∆TST) are calculated using the expressions: $$\begin{aligned}
\Delta r_{gg}^{R}(\mu=1\Delta T_{ST})
&= r_{gg}^{R}(\mu=0)-r_{gg}^{R}(\mu=1\Delta T_{ST}), \\
\Delta r_{gg}^{R}(\mu=3\Delta T_{ST})
&= r_{gg}^{R}(\mu=2\Delta T_{ST})-r_{gg}^{R}(\mu=3\Delta T_{ST}), \\
\Delta r_{gg}^{R}(\mu=5\Delta T_{ST})
&= r_{gg}^{R}(\mu=4\Delta T_{ST})-r_{gg}^{R}(\mu=5\Delta T_{ST}), \\
\Delta r_{gg}^{R}(\mu=7\Delta T_{ST})
&= r_{gg}^{R}(\mu=6\Delta T_{ST})-r_{gg}^{R}(\mu=7\Delta T_{ST})
\end{aligned}$$ - The minimum value of the normalized correlation function of the noisy signal rRggmin(μ) and the corresponding value of μmin are calculated.
- Informative features are determined in the form of the following coefficients.
$$K_{N_1}^{R}=\Delta r_{gg}^{R}(\mu=1\Delta T_{ST}); \qquad
K_{N_2}^{R}=\Delta r_{gg}^{R}(\mu=3\Delta T_{ST});$$
$$K_{N_3}^{R}=\Delta r_{gg}^{R}(\mu=5\Delta T_{ST}); \qquad
K_{N_4}^{R}=\Delta r_{gg}^{R}(\mu=7\Delta T_{ST});$$
$$K_{N_5}^{R}
=\frac{\Delta r_{gg}^{R}(\mu=1\Delta T_{ST})}{\Delta r_{gg}^{R}(\mu=3\Delta T_{ST})};
\qquad
K_{N_6}^{R}
=\frac{\Delta r_{gg}^{R}(\mu=1\Delta T_{ST})}{\Delta r_{gg}^{R}(\mu=5\Delta T_{ST})};$$
$$K_{N_7}^{R}
=\frac{\Delta r_{gg}^{R}(\mu=1\Delta T_{ST})}{\Delta r_{gg}^{R}(\mu=7\Delta T_{ST})};
\qquad
K_{N_8}^{R}
=\frac{\Delta r_{gg}^{R}(\mu=3\Delta T_{ST})}{\Delta r_{gg}^{R}(\mu=5\Delta T_{ST})};$$
$$K_{N_9}^{R}
=\frac{\Delta r_{gg}^{R}(\mu=3\Delta T_{ST})}{\Delta r_{gg}^{R}(\mu=7\Delta T_{ST})};
\qquad
K_{N_{10}}^{R}
=\frac{\Delta r_{gg}^{R}(\mu=5\Delta T_{ST})}{\Delta r_{gg}^{R}(\mu=7\Delta T_{ST})};$$
$$K_{N_{11}}^{R}=\Delta r_{gg,\min}^{R}(\mu).$$
Below, the possibility of using the coefficients KRN1–KRN11 as informative signs for identifying the technical condition of the SPRU will be shown.
The obtained informative signs in the form of coefficients KRN1–KRN11 were used in the complex of NOISE control systems as informative signs for identifying the technical condition of the SPRU, for the oil and gas production facility Bibi-Heybat Oil [10].
4. The system of NOISE control, diagnostics and control of SPRU with the use of frequency converters
To ensure the effective operation of the SPRU, it is necessary to carry out continuous monitoring, identification of the technical condition and control (change in the swing number of the SPRU) of the object in real time, which easily implemented based on frequency converters.
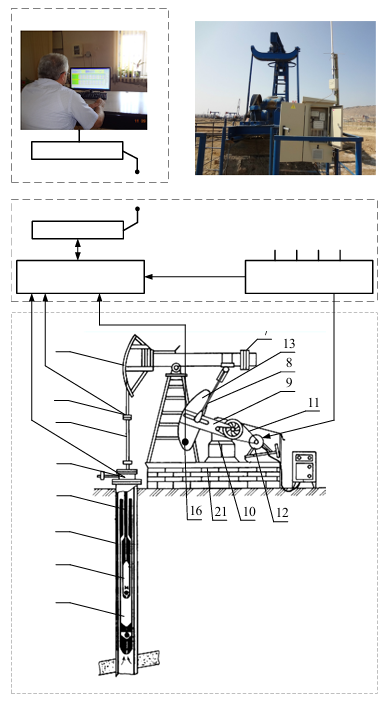
Figure 1 shows a block diagram of the NOISE monitoring, diagnostics and control system of the SPRU using frequency converters and a view of the station on the installation. The block diagram consists of three levels:
- The level of a deep-pumping unit consisting of a plunger deep pump “1”; plunger “2”; pumping pipes “3”; rods “4”; polished rod “5”; balancer head “6”; balancer “7”; connecting rod “8”; crank counterweight “9”; gearbox “10”; V-belt transmission “11”; induction motor “12”; balancing counterweight “13”; force sensor “14”; wellhead pressure sensor “15”; rotation angle sensor “16”.
- The level of the control station, consisting of a SPRU controller according to a dynamogram for collecting information from force sensors “14”, wellhead pressure “15” and rotation angle “16”; a frequency converter for controlling the speed of the electric motor; a radio modem with an antenna for information exchange of the SRPU control system with a centralized control center using the MODBUS-RTU protocol.
- The level of the centralized control center of the oil field consists of an industrial computer and a radio modem with an antenna and serves up to 200 wells [11].
The SPRU control system uses the technology of dynamogram identification based on the estimates of the normalized correlation functions of the force signal Up(i∆t). To implement them, first of all, based on the duration of the interval of the swing period TST, the sampling step of the signal was determined [12]. For most oil wells, the duration of the TST time varies in the range of 5 = 20 seconds. At the same time, we experimentally found that in order to obtain estimates of the robust correlation function rRgg(μ) with the necessary accuracy, it is sufficient to discretize the signal of the effort with a frequency f = 50 – 100 Hz. Experimentally, it was found that during the swing period, any slight change in the technical condition of the SPRU is reflected in the estimates of robust informative signs KRN1–KRN11. As a result of the SPRU operation process, the corresponding reference combinations of these coefficients are formed and stored for its various technical conditions. Identification of the technical condition of the SPRU is reduced to the formation of the current combination of informative features and their comparison with the corresponding combinations of reference informative features KRN1–KRN11. Due to this, there is no need for a visual interpretation of the dynamogram to determine the current technical condition of the SPRU.
The signals from the frequency converter are sent to the induction motor and the SPRU Dynamometry controller. Further, after starting the installation in operating mode, the information is sent from the force sensors, wellhead pressure and rotation angle to the SPRU Dynamometry controller, to which a radio modem with an antenna is connected.
5. Improving the efficiency of SPRU by reducing the cost of power supply using frequency converters
As an electric drive of SPRU, induction motors (IM) with increasing starting torque of 0.4 kV, power from 7.5 to 55 kW, and synchronous rotation speed of 500 …1500 rpm are mainly used. Electric motors (EM) of the 5A, 6A, and AIR series are widely used [13].
Induction motors are widely used in almost of industries (compressor and pumping stations, ventilation systems, conveyors, elevators, cranes, submersible pumps, etc.). The main advantages of induction motors are simplicity of design, high reliability, low cost, etc.
Interest in the use of IM has increased even more due to the appearance of a wide range of affordable and reliable frequency converters for regulating the rotation speed of electric motors in a large range [14]. Various energy-saving control stations (CS) for RDPU with the use of frequency converters began to be created, which provide significant advantages in comparison with conventional CS. Thus, the introduction and operation of CS RDPU in the fields of the Bibi-Heybat oil and gas production department showed its effectiveness. The sources of economic efficiency are the following factors [15,16]:
– saving of consumed electric energy by more than 30%;
– saving costs for the repair of wells and oil production equipment by more 20% due to the reduction of mechanical elements wear;
– reduction of production losses by more 2% due to the reduction of well downtime during repairs;
– a significant indicator of the system’s performance is an increase in the inter-repair period of wells by more than 20%.
However, the calculation of electric energy savings raises doubts among consumers due to the lack of a sound calculating methodology. The article proposes a methodology for calculating the saving of electric energy when using a control station of SPRU with variable frequency drive.
6. The method of calculating the savings of electrical energy in the control of SPRU with a frequency-controlled drive
When calculating the consumed electric energy by oil-production equipment, it is necessary to take into account the active input (P1) and output (P2) powers of the frequency converter according to the following formulas [17], [18]:
$$P_1=\sqrt{3}\,U_1\,I_1\,\cos\varphi_1 \tag{1}$$
$$P_2=\sqrt{3}\,U_2\,I_2\,\cos\varphi_2 \tag{2}$$
where P1, U1, Ι1, cosφ1 – power, voltage, current, and power factor at the inverter input, P2, U2, Ι2, cosφ2 – power, voltage, current and power factor at the inverter output.
It is known that the value of the power factor at the inverter output cosφ2 varies depending on the degree of motor load from 0.17 to 0.85 [17], [18]. The values of the power factor at the inverter output, depending on the load for a common industrial induction motor, are shown in Table 1.
Table 1: Power Factor Dependence at the Inverter Output from the Load for a Common Industrial Induction Motor
Load, % | Power factor cosφ2 | Power factor tgφ2 |
0 | 0.17 | 5.80 |
25 | 0.55 | 1.52 |
50 | 0.73 | 0.94 |
75 | 0.80 | 0.75 |
100 | 0.85 | 0.62 |
The values of the power factor should be taken into account in the calculation of the energy consumed [19], [20], [21]. However, the data in Table 1 are given with great discreteness, which makes it difficult to use them in calculations. For this purpose, using piecewise linear approximation, the values cosφ2 for intermediate values of the IM load were determined (Table 2). The values of the power factor at the inverter output, depending on the load for a common industrial induction motor, are shown in Figure 2.
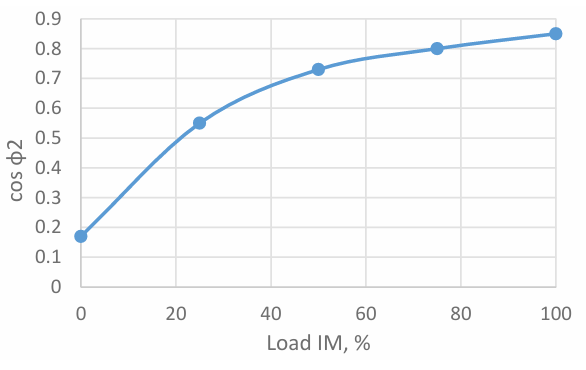
It should be noted that the values of cosφ2 were calculated using different formulas for different intervals:
$$f(x)=
\begin{cases}
0.0152\,x+0.17, & 0\le x<25\%, \\
0.0072\,x+0.37, & 25\%\le x<50\%, \\
0.0028\,x+0.59, & 50\%\le x<75\%, \\
0.0020\,x+0.65, & 75\%\le x<100\%.
\end{cases}$$
Given that the inherent electrical energy consumption of the inverter is much less than the energy transmitted in the load, it can be neglected and taken:
$$P_1=P_2;$$
$$\sqrt{3}\,U_1\,I_1\,\cos\varphi_1
=
\sqrt{3}\,U_2\,I_2\,\cos\varphi_2;$$
consequently
$$I_1=\frac{U_2\,I_2\,\cos\varphi_2}{U_1\,\cos\varphi_1}. \tag{3}$$
Table 2: The Values cosφ2 Obtained Using the Piecewise Linear Approximation
Load IM, % | cosφ2 | Load IM, % | cosφ2 | Load IM, % | cosφ2 |
0 | 0.170 | 25 | 0.550 | 75 | 0.800 |
1 | 0.185 | 26 | 0.557 | 76 | 0.802 |
2 | 0.200 | 27 | 0.564 | 77 | 0.804 |
3 | 0.215 | 28 | 0.571 | 78 | 0.806 |
4 | 0.230 | 29 | 0.578 | 79 | 0.808 |
5 | 0.246 | 30 | 0.586 | 80 | 0.810 |
6 | 0.261 | 31 | 0.593 | 81 | 0.812 |
7 | 0.276 | 32 | 0.600 | 82 | 0.814 |
8 | 0.291 | 33 | 0.607 | 83 | 0.816 |
9 | 0.306 | 34 | 0.614 | 84 | 0.818 |
10 | 0.322 | 35 | 0.622 | 85 | 0.820 |
11 | 0.337 | 36 | 0.629 | 86 | 0.822 |
12 | 0.352 | 37 | 0.636 | 87 | 0.824 |
13 | 0.367 | 38 | 0.643 | 88 | 0.826 |
14 | 0.382 | 39 | 0.650 | 89 | 0.828 |
15 | 0.398 | 40 | 0.658 | 90 | 0.830 |
16 | 0.413 | 41 | 0.665 | 91 | 0.832 |
17 | 0.428 | 42 | 0.672 | 92 | 0.834 |
18 | 0.443 | 43 | 0.679 | 93 | 0.836 |
19 | 0.458 | 44 | 0.686 | 94 | 0.838 |
20 | 0.474 | 45 | 0.694 | 95 | 0.840 |
21 | 0.489 | 46 | 0.701 | 96 | 0.842 |
22 | 0.504 | 47 | 0.708 | 97 | 0.844 |
23 | 0.519 | 48 | 0.715 | 98 | 0.846 |
24 | 0.534 | 49 | 0.722 | 99 | 0.848 |
100 | 0.850 |
It is also known that
1) the power factor at the input of the inverter, taking into account the total harmonic distortion, is taken equal to 0.89, that is, cosφ2 = 0,89;
2) with frequency regulation, the ratio of voltage to frequency is assumed constant. Since the input of the inverter
$$\frac{U_1}{F_1}=\text{const}=k$$
for the value U2 we get:
$$U_2=F_2\,k$$
Then (3) can be rewritten in the form:
$$I_1=\frac{F_2\,k\,I_2\,\cos\varphi_2}{F_1\,k\,0.89}
=\frac{F_2\,I_2\,\cos\varphi_2}{F_1\,0.89}
\tag{4}$$
Electric energy saving will be due to the difference in currents:
$$\Delta I=I_2-I_1 \tag{5}$$
Putting (4) in (5) we get:
$$\Delta I
=I_2\left(1-\frac{F_2\cos\varphi_2}{F_1\cdot 0.89}\right)
\tag{6}$$
Electric energy saving in N hours will be in kWh:
$$EES_N
=\sqrt{3}\,N\,U_1\,\Delta I\cdot 0.89\cdot 10^{-3}
=1.5394\,N\,U_1\,\Delta I\cdot 10^{-3}
\tag{7}$$
For example, when powering the SPRU electrical motor from a network with a voltage U1=380 V and a frequency 50 Hz, we obtain:
$$\Delta I
=I_2\left(1-\frac{F_2\cos\varphi_2}{50\cdot 0.89}\right)
=I_2\left(1-\frac{F_2\cos\varphi_2}{44.5}\right)
\tag{8}$$
$$EES_N=EES\cdot N=0.585\,\Delta I\,N
\tag{9}$$
Using the obtained expressions, the value of the electric energy saving parameters were calculated for the induction motor operation modes (PNOM = 37 kW, cosφNOM = 0,85, ΙNOM = 66 А) with different load, the calculation results are summarized in Table 3 and Figure 3.
The general algorithm for calculating the values of electric energy saving parameters:
1 The inverter output current I2 is measured, i.e. the current consumed by the motor.
2 The motor load value is calculated as the ratio of the actual output current I2 to the nominal current INOM. The value of the motor load from Table II determines the value of the power factor cosφ2.
3 Using (6), the difference between the input and output currents ∆I is determined.
4 Using (7) and using the known input voltage U1, the value of electric energy saving EES per hour is determined.
Table 3: Electric Energy Saving Parameters Depending on the Operation Mode of an Induction Motor
Load IM, % | I2, A | cosφ2 | Current difference, ΔI, A | Annual savings, kWh |
100% rotation speed, F1=50 Hz, U1=380 V, cosφ1=0.89, F2=50 Hz | ||||
100 | 66.0 | 0.85 | 2.97 | 15220 |
75 | 49.5 | 0.80 | 5.01 | 25685 |
50 | 33.0 | 0.73 | 5.93 | 30441 |
25 | 16.5 | 0.55 | 6.30 | 32344 |
100% rotation speed, F1=50 Hz, U1=380 V, cosφ1=0.89, F2=25 Hz | ||||
100 | 66.0 | 0.85 | 34.5 | 176942 |
75 | 49.5 | 0.80 | 27.3 | 139841 |
50 | 33.0 | 0.73 | 19.5 | 99886 |
25 | 16.5 | 0.55 | 11.4 | 58505 |
The particular algorithm for calculating the values of the parameters of saving electrical energy for the SPRU, where the power supply is carried out with a voltage U1=380 V and a frequency of 50Hz. This algorithm differs from the general one in that formulas are used here, respectively (6), (7), (8), (9).
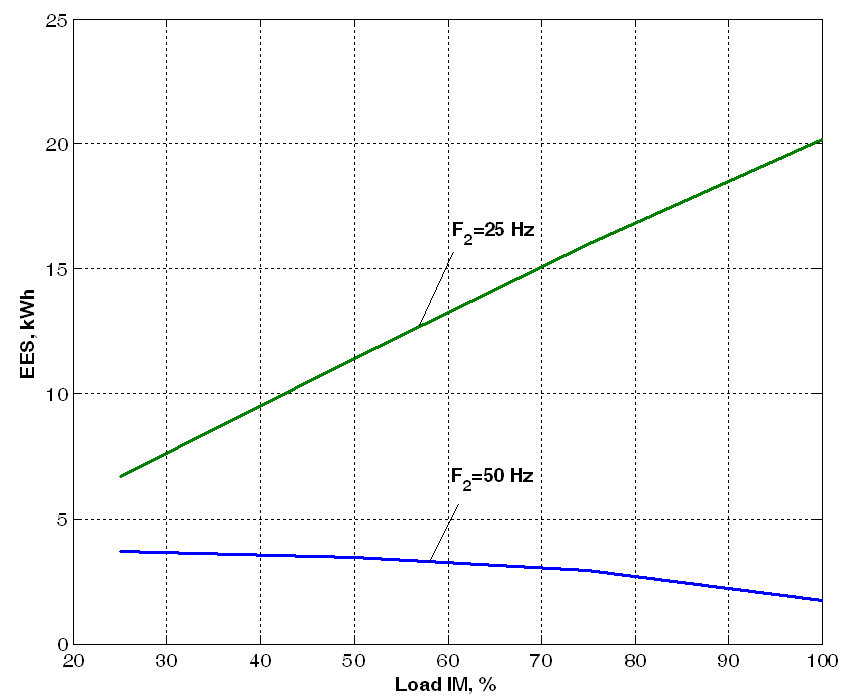
Table 4: Calculation of Energy Savings for 20 Wells of the Bibi-Heybat Oil and Gas Production Unit Equipped with Developed Control Stations with Inverters (August 2015)
Well number | PFC, kW | PIM, kW | I2max, A | F2, Hz | cosφ1 | U1, V | I1, A | Load IM, % | cosφ2 | U2, V | I2, A | ΔI, A | SEE, kWh |
3882 | 22 | 22 | 48.4 | 47 | 0.89 | 380 | 10.77 | 34.2 | 0.614 | 357 | 16.6 | 5.83 | 3.41 |
3097 | 30 | 30 | 66.0 | 49 | 0.89 | 380 | 20.06 | 41.5 | 0.665 | 372 | 27.4 | 7.34 | 4.29 |
3845 | 22 | 22 | 48.4 | 45 | 0.89 | 380 | 15.74 | 45.8 | 0.701 | 342 | 22.2 | 6.46 | 3.78 |
3098 | 30 | 30 | 66 | 50 | 0.89 | 380 | 12.97 | 29.8 | 0.586 | 380 | 19.7 | 6.73 | 3.94 |
3658 | 22 | 22 | 48.4 | 45 | 0.89 | 380 | 9.883 | 33.2 | 0.607 | 342 | 16.1 | 6.22 | 3.64 |
3844 | 22 | 22 | 48.4 | 45 | 0.89 | 380 | 14.0 | 42.5 | 0.672 | 342 | 20.6 | 6.6 | 3.86 |
3814 | 30 | 30 | 66.0 | 45 | 0.89 | 380 | 19.03 | 42.4 | 0.672 | 342 | 28 | 8.97 | 5.25 |
3617 | 30 | 30 | 66.0 | 49 | 0.89 | 380 | 15.14 | 33.9 | 0.614 | 372 | 22.4 | 7.26 | 4.25 |
3841 | 18.5 | 22 | 48.4 | 30 | 0.89 | 380 | 10.11 | 44.6 | 0.694 | 228 | 21.6 | 11.5 | 6.73 |
1245 | 18.5 | 18.5 | 40.7 | 49 | 0.89 | 380 | 9.398 | 34.1 | 0.614 | 372 | 13.9 | 4.5 | 2.63 |
3261 | 18.5 | 15 | 33.0 | 42 | 0.89 | 380 | 14.83 | 62.4 | 0.763 | 319 | 20.6 | 5.77 | 3.37 |
3146 | 18.5 | 22 | 48.4 | 45 | 0.89 | 380 | 19.11 | 52.8 | 0.738 | 342 | 25.6 | 6.49 | 3.80 |
3677 | 30 | 30 | 66.0 | 49 | 0.89 | 380 | 5.707 | 17.7 | 0.443 | 372 | 11.7 | 5.99 | 3.51 |
3826 | 22 | 22 | 48.4 | 48 | 0.89 | 380 | 21.51 | 55.3 | 0.744 | 364 | 26.8 | 5.29 | 3.10 |
811 | 18.5 | 18.5 | 40.7 | 45 | 0.89 | 380 | 9.712 | 37.1 | 0.636 | 342 | 15.1 | 5.39 | 3.15 |
1150 | 18.5 | 18.5 | 40.7 | 45 | 0.89 | 380 | 10.71 | 39.5 | 0.658 | 342 | 16.1 | 5.39 | 3.15 |
1192 | 18.5 | 18.5 | 40.7 | 38 | 0.89 | 380 | 12.72 | 50.1 | 0.73 | 288 | 20.4 | 7.68 | 4.50 |
3279 | 18.5 | 18.5 | 40.7 | 46 | 0.89 | 380 | 16.11 | 52.0 | 0.735 | 349 | 21.2 | 5.09 | 2.98 |
557 | 18.5 | 18.5 | 40.7 | 48 | 0.89 | 380 | 9.594 | 35.1 | 0.622 | 364 | 14.3 | 4.71 | 2.75 |
3929 | 18.5 | 22 | 48.4 | 40 | 0.89 | 380 | 7.326 | 29.1 | 0.578 | 304 | 14.1 | 6.77 | 3.96 |
Total savings of all wells in 1 hour, kWh | 76.1 | ||||||||||||
Total working time in a year (when working 11 months a year), h | 8040 | ||||||||||||
Total annual energy savings, thousand kWh | 612.2 | ||||||||||||
Currently, the Institute of Control Systems of the National Academy of Sciences of Azerbaijan (ANAS) has developed a CS based on frequency converters of the Altivar 71 and 930 type, which is manufactured by the special design bureau “Cybernetics” of ANAS. These SUS are being widely implemented in the oil fields of Azerbaijan. At the moment, more than 400 wells are equipped with frequency converters based control stations as part of a measurement, monitoring, diagnostics and management complex. At the same time, the electric energy savings are calculated according to the proposed methodology. Table 4 shows the results of calculating energy savings for 20 wells of the Bibi-Heybat Oil and Gas Production Unit equipped with the developed CS.
7. Conclusion
- Using the normalized correlation functions, the normalized coefficients KN1, KN2, …, KN11, free from the indicated interferences, are determined.
- In each field for wells with the same depth, the range of change in the values of the same coefficients
KN1 – KN11 under the same technical conditions is insignificant (no more than 5-10%), which allows using them as informative parameters for identifying the technical condition of the SPRU. - A robust remote control system has developed for the SPRU in real-time based on a frequency-controlled driver.
- A methodology for calculating the savings of electrical energy in the control of SPRU frequency converters has compiled. The results of the calculation also reveal the available additional energy saving reserves, such as:
– the need for accurate balancing counterweights of SPRU;
– measures to increase power factor cosφ2;
– the need to maintain the operating mode with motor load within 70…75% of the nominal and the frequency within 80…85% of the nominal.
Conflict of Interest
The authors declare no conflict of interest.
- G.P. Karmakar, Chandrima Chacraborty. “Improved oil recovery using polymer gelants: a review,” Indian Journal of Chemical Technology, 2006, no 13, pp. 162–167.
- V.M. Maksimov. “On the current state of oil production, recovery factor oil and methods of increasing oil recovery,” Drilling and oil, 2011, no 2, pp. 12–16.
- “Marketing research of the sucker rod pumps market. Analytical report,” Research.Techart. 2010.
- A.B. Neely, H.E. Tolbert, “Experience with Pump-Off Control in the Permian Basin,” SPE Technical Conference and Journal of Petroleum Technology, 1988, no 14345, pp.645-648.
- Li, K., Han, Y., Wang, T., 2018. “A novel prediction method for down-hole working conditions of the beam pumping unit based on 8-directions chain codes and online sequential extreme learning machine,” Journal of Petroleum Science and Engineerin, vol. 160, pp. 285-301.
- A.H. Rzayev, M.H. Rezvan, M.I. Khakimyanov, I.N. Shafikov, “State-of-the-art of the automation of artificial lift units in the CIS,” Transaction of Azerbaijan National Academy of Sciences, Series of Physical-Technical and Mathematical Sciences: Informatics and Control Problems, vol. XXXIII, no 6, 2013, pp. 177 – 187.
- Zhang, R., Wang, Z., Wang, X., et al., 2018, “Integrated Diagnostics Method and Application of Ground and Downhole Working Condition in Rod Pumping Well,” Journal of Applied Science and Engineering, vol. 24, no 4, pp. 615-624.
- D. Han, “Discussions on concepts, countermeasures and technical routes for the secondary development of high water-cut oil fields,” PetroleumExplorationandDevelopment, vol. 37, no 5, pp. 583-591, 2010.
- T.A. Aliev, D.A. Iskenderov, G.A. Guluyev, A.H. Rzayev, M.H. Rezvan, “Results of introducing the control, diagnostics and management complex for oil wells operated by sucker rod pumps at “Bibi Heybat Oil” oil and gas producing company,” Azerbaijan Oil Econ, no 6, 2014, pp. 37 – 41.
- T.A. Aliev, A.H. Rzayev, G.A. Guluyev, T.A. Alizada, N.E. Rzayev, “Robust technology and system for management of sucker rod pumping units in oil wells,” in Mechanical Systems and Signal Processing, vol. 99, 2018, pp. 47 – 56.
- F.A. Gizatullin, M.I. Khakimyanov, F.F. Khusainov, “Features of electric drive sucker rod pumps for oil production,” Journal of Physics: Conference Series, vol. 944, 2018, pp. 1–6.
- A.H. Rzayev, M.H. Rezvan, M.I. Khakimyanov, “Automation artificial lift systems in the CIS,” Oil and Gas Business: electronic scientific journal, vol. 5, no 6, pp. 19 – 29. [Online]. Available: http://ogbus.ru/article/view/avtomatizaciya-ustanovok-mexanizirovannoj-dobychi-nefti-na-territorii-sng/22792. Accessed: Jan, 2020.
- T. Neuberger, S.B. Weston, “Variable Frequency Drives: Energy Savings for Pumping Applications,” Eaton Corporation, no. IA04008002E /Z12581, 2012.
- E. Al-Bassam, R. Alasseri, “Measurable energy savings of installing variable frequency drives for cooling towers’ fans, compared to dual speed motors,” Energy and Buildings, vol. 67, 2013, pp. 261-266.
- S. Prachyl, “Variable Frequency Drives and Energy Savings,” Siemens Industry Inc. Drive Technologies, 2010.
- C.M. Burt, X. Piao, F. Gaudi, B. Busch, N.F. Taufik, “Electric motor efficiency under variable frequencies and loads,” Journal of irrigation and drainage engineering, vol. 134, no 2, 2008, pp. 129 – 136.
- W.H. Wolfle, W.G. Hurley, “Power factor correction and harmonic filtering for AC/DC converters,” in IEEE 2002 28th Annual Conference of the Industrial Electronics Society. IECON 02, vol. 4, 2002, pp. 3238-3243.
- A.H.do Nascimento, “Power factor correction and harmonic filtering planning in electrical distribution network,” Journal of Control, Automation and Electrical Systems, vol. 27, no 4, 2016, pp. 441-451.
- C. Liu, Y. He, K. Dai, Y. Kang, “Industrial power distribution system harmonic resonance problem and solution with shunt active power filter,” in IECON 2017- 43rd Annual Conference of the IEEE Industrial Electronics Society, 2017, pp. 1243-1248.
- T. Aliev, O. Nusratov, G.A. Guluev, As.G. Rzaev, F. Pashayev, M.G. Rezvan “Position-Binary Technology for Processing the Signals of a Load for Identification of the Technical State of Deep-Well Sucker-Rod Pumps,” Measurement Techiques, vol. 61(3), 2018, pp. 1–6.
- A.M. Zyuzev, M.V. Bubnov “Sucker-rod pumping unit balance diagnostics by wattmeter card,” Bulletin of the Tomsk Polytechnic University. Geo Аssets Engineering, vol. 330, 2019, pp. 178–187.