Length-Weight Relationships (LWRs) and Condition Factor of Seven Fish Species in River Nyangweta Tributary, Kenya

(This article belongs to the Section Fisheries (FIS))
Export Citations
Cite
Ondemo, F. M. , Getabu, A. , Gichana, Z. and Omweno, J. O. (2022). Length-Weight Relationships (LWRs) and Condition Factor of Seven Fish Species in River Nyangweta Tributary, Kenya. Journal of Engineering Research and Sciences, 1(3), 193–199. https://doi.org/10.55708/js0103020
Fredrick Mang’era Ondemo, Albert Getabu, Zipporah Gichana and Job Ombiro Omweno. "Length-Weight Relationships (LWRs) and Condition Factor of Seven Fish Species in River Nyangweta Tributary, Kenya." Journal of Engineering Research and Sciences 1, no. 3 (March 2022): 193–199. https://doi.org/10.55708/js0103020
F.M. Ondemo, A. Getabu, Z. Gichana and J.O. Omweno, "Length-Weight Relationships (LWRs) and Condition Factor of Seven Fish Species in River Nyangweta Tributary, Kenya," Journal of Engineering Research and Sciences, vol. 1, no. 3, pp. 193–199, Mar. 2022, doi: 10.55708/js0103020.
Length-weight relationships (LWRs) and condition factors are important for effective management of riverine fisheries. This study investigated the LWRs and condition factors of the dominant fish species from Nyangweta tributary of River Kuja, in Lake Victoria Catchment, Kenya. A total of 615 fish of seven dominant species were analyzed: Enteromius altianalis, Enteromius neumeyeri, Clarias theodorae, Labeo victorianus, Labeobarbus altianialis, Chiloglanis species and Amphilias jacksonii. The fish were sampled from five locations from October 2020 to March 2021. The length and weight measurements were taken using a measuring board and an electronic balance respectively and used to determine Fulton's (KF) and allometric (Ka) condition factors. The largest species was E. altianalis (70.74 ± 8.72g), followed by L. altianialis and L. victorianus with mean body weights of 62.14 ± 3.48g and 56.43 ± 11.26g respectively. With exception of E. altianalis and C. theodorae, the Fulton’s condition factors (KF) of all the species were greater than (1) and not significantly different (p = 0.43) among the species. Majority (four) of the species exhibited positive allometry (Ka > 3), while only one species exhibited isometric (Ka = 3) growth, due to different body profiles which may not allow uniform growth of all individuals of the same species, a large percentage of females in adult fish populations and high nutrient influxes. The LWRs were significant and showed strong linear relationships between total and standard lengths and body weight (p < 0.05, R2 > 0.5). These findings suggest that conservation measures need to be taken to improve the fish health and physiological condition in upstream areas of the Nyangweta tributary.
1. Introduction
Fishery researchers use Length-Weight relationships to determine the physiological condition and growth patterns of fish in rivers and other aquatic ecosystems [1]. [2], report that LWR can be used in fisheries biology to estimate body weight from a given length class of fish. This relationship also provides an estimate of fishery potential and variability of individual fish populations by indicating the fishery exploitation rates determined by fishing effort [3], [4]. It is assumed that heavier fish relative to their body length reflect a healthier physiological state than lighter ones because of high energy investments for growth and reproduction which increases the fishery potential to withstand high fishing pressure [5]. However, only few organisms have been reported to grow isometrically because the aquatic ecosystem is subject to a large number of changing environmental and physiological factors [6]. Rivers make crucial contributions towards lacustrine fish populations. Nevertheless, the success of the fish populations depends on various factors such as habitat quality, heterogeneity and water quality that affect the well-being of riverine fishes [7].
Despite a high global interest in riverine fisheries, in Kenya they are largely regarded as commercially inexpressive. However, some potamodromous species such as Labeo victorianus, which form the mainstay of Lake Victoria’s river-mouth fisheries [8]. Besides, rivers provide refugia for survival and breeding of both migratory and endemic populations [9]. It is therefore necessary to evaluate the length-weight relationships (LWRs) and Condition factors of riverine species to provide baseline information for the management of riverine fisheries in rivers found in Lake Victoria Basin.[10–12]. Hence, the main aim of the present study was to investigate the LWRs and condition factors of fish species in the Nyangweta tributary of River Kuja located in the Kenyan sector of Lake Victoria catchment.
2. Materials and Methods
The study was carried out in River Nyangweta a tributary of River Kuja which is located in the eastern part of Lake Victoria Basin and lies between latitude 08°24’N and longitudes 39°01’E (Figure 1).
2.1. The fish condition factor
The monthly length and weight data of all the species in the catch data was used to estimate length- weight relationship of the dominant riverine species. Length-weight relationship was conducted on seven dominant species out of all 13 species sampled with total length and body weight range shown in Table 1. computed using the least squares regression analysis using the Le
Cren (1951) equation, W= a*Lb, where W= body weight of fish, L represents total length of fish and ‘a’ and ‘b’ are the exponents. To solve for exponents, the Le Cren equation was log transformed using natural logarithms in log W = log a + b log L, as recommended by [13]. In this linearized relationship, the value ‘log a’ is the regression intercept which estimates the initial growth and indicates the unit body weight for which the length is zero, while the slope of the regression ‘b’ describes the rate of change in body weight at unit length. The degree of association between the body weight and total length variables was determined by computing the correlation co-efficient (r) and the adjusted coefficient of determination (R2), which exhibit the relationship: r = √ R2 [14]. To arrive at these coeffients, all sampled datasets were subjected to ordinary least squares statistical procedures of fitting the length-weight relationship using the [13] and [15]. The length-weight relationships were separately computed and the linear regression lines were fitted into the same plot using R software graphical techniques [16], [17]. The Fulton’s condition factor (K) was determined as the ratio of body weight to the cube of total length according to [18] equation: Where L represents the total fish length measured in centimeters and W, represents the body weight measured in grams. Bailey’s t – test = (b-3)/ Sb, where b = regression coefficient and Sb = Standard error of ‘b’ [19] was performed to determine whether the slope coefficient ‘b’ value significantly deviated from the expected cube value of 3. Statistically significant of the b value from 3 implies either a positive or negative allometric growth (P ˂0.05). An isometric growth is when b is not significantly different from 3 (P˃0.05) [20]. The coefficient of determination, r2 value, was used to determine whether significant correlation exists between length and weight measurements. All data was analyzed using R software [16] and the significance of observed differences judged at the level of p < 0.05. Shapiro – Wilk normality test was used to determine the normality of b distribution.
3. Results
3.1. Growth parameters
A total of 696 specimens representing 13 species were collected from Nyangweta tributary during the study period. A total of 615 individuals of seven dominant fish species belonging to 4 families (Amphilidae, Machokidae, Clariidae and Cyprinidae) were used for Length-Weight analyses. The number of fish sampled ranged from 4 specimens for A. Jacksonii to 254 specimens for L. altanialis as shown in Table 1
The lowest standard length of fish species was 3.3 cm in Chiloglanis sp while the largest was 26.3 cm in L. altanialis. The smallest specimen had a body weight of 0.8 g while the largest specimen had 371.3 g. The largest species was E. altianalis (70.74 ± 8.72 g), followed by L. altianialis and L. victorianus with mean body weights of 62.14 ± 3.48 g and 56.43 ± 11.26 g respectively. The maximum and minimum total lengths recorded for E. altianalis species in the Nyangweta tributary was 6.0 cm and 26.0 cm respectively, which were comparatively lower than the recorded maximum (32.3 cm) and minimum (6.5 cm) length for L. altianialis species which was second most important in terms of mean total length. Labeo victorianus showed the largest variation in both body weight and total length measurements in all stations during the sampling period (P ˂ 0.05). The total length recorded for the L. victorianus species ranged from 10.1 – 25.3 cm, while body weight ranged from 10.29 g to 172.77 g.
3.2 The Fulton’s condition factor
The values of Fulton’s condition factors (the KF values) showed that all the species were in good condition during the sampling period and comparison among the fish species condition factor is shown in Table 2.
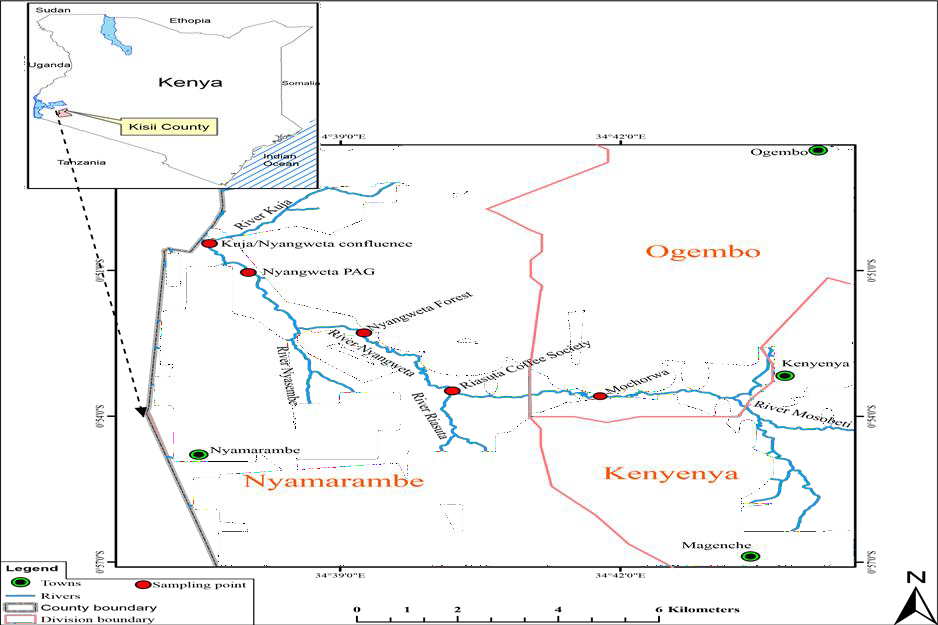
Table 1: Species sampled at each sampling station during the sampling period.
4. Species | Occurrence | Abundance | NKC | PAG | NFO | RCF | MOC |
Amphilias jacksonii | 1 | 4 | 4 | 0 | 0 | 0 | 0 |
Chilogranis sp | 3 | 12 | 8 | 0 | 0 | 3 | 1 |
Clarias theodorae | 6 | 210 | 31 | 29 | 70 | 56 | 24 |
Clarius gariepinus | 1 | 1 | 0 | 1 | 0 | 0 | 0 |
Enteromias cercops | 1 | 1 | 0 | 0 | 1 | 0 | 0 |
Enteromius neumayeri | 5 | 142 | 69 | 15 | 15 | 36 | 7 |
Enteromius nyanzae | 1 | 1 | 1 | 0 | 0 | 0 | 0 |
Entoromius altianalis | 5 | 41 | 13 | 17 | 1 | 4 | 6 |
Entoromius apleogramma | 1 | 2 | 0 | 0 | 0 | 2 | 0 |
Labeobarbus altianialis | 5 | 254 | 53 | 63 | 7 | 73 | 58 |
Labeo victorianus | 2 | 25 | 11 | 14 | 0 | 0 | 0 |
Mastacembelus frenatus | 1 | 2 | 2 | 0 | 0 | 0 | 0 |
P.multicolor | 1 | 1 | 0 | 0 | 0 | 0 | 1 |
Total | = 5 times | ||||||
Mean ± SE | |||||||
No of species | N = 13 species | 9 | 6 | 5 | 6 | 6 |
Note: NKC is Nyangweta Kuja Confluence, PAG – Nyangweta PAG, NFO -Nyangweta forest, RCF – Riasusa Coffee Society, MOC – Mochorwa
Table 2: Mean (± SE) of Body weight, condition factor, total and standard lengths of seven Fish species along Nyangweta Tributary
Species |
n | Body weight (g) |
Total length (cm) | Standard length (cm) | ||||
Mean ± SE | Range | Mean ± SE | Range | KF Mean | KF Range | Mean ± SE | ||
A. jacksonii | 4 | 6.0 ± 1.12 | 3.16 -8.50 | 8.1 ± 0.72 | 6.4 – 9.9 | 1.11 ±0.10 | 0.88 -1.33 | 6.38 ± 0.47 |
Chiloglanis sp | 12 | 1.43 ± 0.13 | 0.8 – 2.3 | 4.73 ±0.10 |
4.2 – 5.4 | 1.32 ±0.07 | 0.94 -1.63 |
4.01 ± 0.12 |
C. theodorae | 211 | 26.73± 1.65 | 2.1 – 163.12 | 13.6 ± 0.3 | 6.2 -28.0 | 0.97 ±0.06 | 0.18 -11.41 |
12.25 ± 0.28 |
E. neumayeri | 142 | 9.13 ± 1.87 | 2.0 – 265.8 | 8.58 ±0.18 | 5.5 -26.0 | 1.06 ±0.02 | 0.58 – 1.51 |
6.80 ± 0.16 |
E. altianalis | 41 | 70.74± 8.72 | 2.7 – 180.80 | 17.62 ±0.84 | 6.0 -26.0 | 0.98 ±0.02 | 0.55 -1.25 |
13.68 ± 0.71 |
L. altanialis | 254 | 62.14± 3.48 | 2.97 – 371.3 | 17.07 ±0.3 | 6.5 -32.3 | 1.02 ±0.02 | 0.29 -5.30 |
13.45 ± 0.24 |
L. victorianus | 24 | 56.43 ± 11.26 | 10.29 – 172.77 | 15.77 ± 0.98 | 10.1-25.3 | 1.09 ±0.02 | 0.77 – 1.29 |
12.75 ± 0.76 |
Table 3: Length-Weight relationships for seven dominant Fish Species along the Nyangweta tributary of Kuja River.
Species | E. altianalis | E. neumeyeri | C. theodorae | L. victorianus | L. altianialis | Chiloglanis Sp | A. jacksonii |
Ka | 0.008 | 0.005 | 0.013 | 0.006 | 0.008 | 0.114 | 0.050 |
B | 3.17 | 3.40 | 2.55 | 3.14 | 2.97 | 3.19 | 2.27 |
Sb | 0.07 | 0.07 | 0.08 | 0.08 | 0.04 | 0.24 | 0.50 |
0.41 | 0.18 | -0.18 | 0.57 | -1.33 | 1.26 | -0.68 | |
r2 | 0.984 | 0.947 | 0.820 | 0.986 | 0.948 | 0.702 | 0.911 |
Adj. R2 | 0.983 | 0.947 | 0.819 | 0.985 | 0.947 | 0.672 | 0.866 |
P | 0.000 | 0.000 | 0.000 | 0.000 | 0.00 | 0.001 | 0.046 |
t-test sig. | 0.5 | 0.5 | 0.5 | 0.5 | 0.5 | 0.5 | 0.5 |
Growth behaviour | Positive allometry | Positive allometry | Negative allometry | Positive allometry | Isometry | Positive Allometry | Negative allometry |
IUCN status | Least Concern | Least Concern | Least Concern | Critically Endangered | Least Concern | Least Concern | Least Concern |
Note: a and b are length – weight relationship parameters; negative allometry, Ka <3, Positive allometry Ka >3, isometry, Ka = 3. Sb is the standard error of b; P is the p value; r2 is the coefficient of determination.
With exception of E. altianalis and C. theodorae, the Fulton’s condition factors (KF) of all the species were greater than (1) and not significantly different (p = 0.43) among the species. The calculated mean condition factor (KF) was the highest in Chilogranis sp (1.32 ± 0.07) and lowest in Clarias theodorae (0.97 ± 0.06) and E. altianalis (0.98 ± 0.02), which had the condition factors of less than (1).
4.1. Length–Weight relationships of seven fish species along Nyangweta tributary
The length-weight relationship parameters and information on the growth behavior (isometric or allometric) for the seven fish species (n = 615) sampled from Nyangweta tributary are shown in Table 3.
E. altianalis, E. neumeyeri, L. victorianus and Chilogranis sp showed a positive allometric growth pattern during this study indicated by the b values (b = 3.17, 3.40, 3.14 and 3.19). The computed ‘b’ values were lowest and less than 3 for C. theodorae and A. jacksonii species which had b values of 2.55 and 2.27 respectively, while L. altianialis (b = 2.97) exhibited isometric growth. The fish total length increased correspondingly with body weight resulting to high correlation coefficients due to a large percentage of body weight explained by total length in the log-transformed regression models (Figure 2).
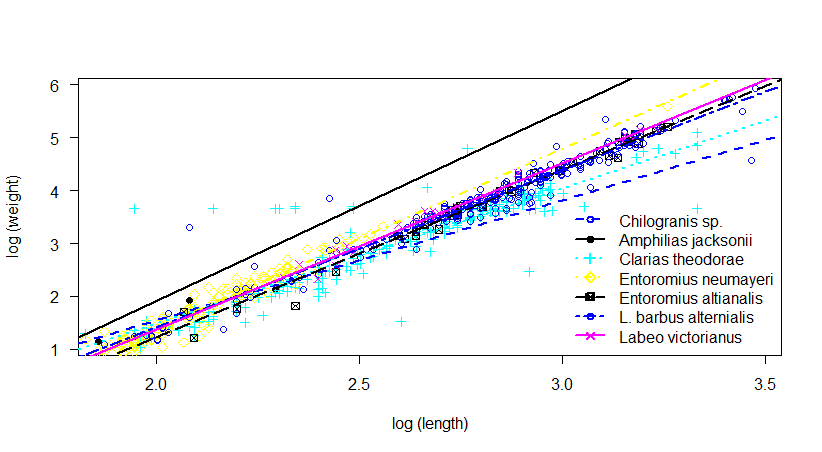
There was a significant positive relationship between body weight and length which was shown by correlation coefficients (r2 > 0.5, P < 0.05). The correlation coefficient was however not found significant in A. jacksonii (R2 = 0.9107, p = 0.046), showing that individual fish in this species did not grow stouter with increase of total length. Further, the adjusted R2 values of E. altianalis, E. neumeyeri and A. jacksonii sampled showed a high correlation between the total length and bodyweight with the R2 values of 0.9835, 0.9474 and 0.9107 respectively. However, Chiloglanis sp species had the lowest coefficient of differentiation (R2 = 0.6721). With exception of Chiloglanis sp and A. jacksonii, the standard error (Sb) of each length-weight coefficient ‘b’ was less than 10 times smaller than the corresponding parameter estimate coefficient.
5. Discussion
The location of the stream in a high agriculturally potential area characterized by regular and frequent flooding might have played a pivotal role in determining the biological condition of the Nyangweta tributary, besides replenishing the available food with overland influxes that provide a cue for spawning and create a food base for fish and other aquatic organisms. With exception of C. theodorae, E. neumayeri, E. altianalis, L. alternialis, other species showed preferred dominating certain areas of the tributary and were completely absent in other sampling stations. The size distribution along the stream gradient was influenced by the variation in river bio-physico- chemical parameters such as nutrient levels, the habitat quality and heterogeneity, stream width, water depth and temperature as well as energy dynamics which contributed to species succession.
There were heterogeneous fish habitats in the riverbanks, substrate and slow-moving pools of water among which were reflected in the diverse composition and structure of the biological community. The variations in fish allometric and Fulton ‘s condition values depended on many factors such as the number of specimens examined, health condition of the habitat, even the season during which sampling was conducted [21]. However, the change in b values depends primarily on the individual body profiles of the species, physico-chemical parameters, food availability, sex of the individual as well as maturity stage of the individuals [13], [22], [23]. Some of these factors did not account for the variations in the fish condition factors observed in the present study. Most Ka values were greater than or less than 3 and highly significant showing that the increase in body weight of fish corresponds with an increase in fish total lengths. Consequently, most b-coefficients deviated from isometry (b = 3) observed for most species and ranged between 2.27 and 3.19. This may be because these fishes exhibited changes in shape and density during the sampling period which might have caused the slope coefficients of the weight – length regression to deviate from 3. In addition, the electrofisher sampling equipment had low efficiency with several fish escaping along the sampling transect. Nevertheless, these values lie within the range of 2.5 and 3.5 which has been reported for most species [6], [24]. The low ‘Sb’ to ‘b-3’ ratio in this study indicates low variability of the slope estimate coefficients from isometry, which further implies that the observed data yielded best-fitting regression models which could have a high precision in making predictions outside the observed datasets [17].
Moreover, environmental changes resulting from increased anthropogenic activities, such as land use changes in the riparian zone may have been caused deterioration in water quality, consequently reducing habitats and food availability for the species. This is evidenced by increased riparian activity in which land was cultivated close to the river bank. For instance, L. victorianus and M. frenatus had low abundance in those areas with high riparian activity. C. theodorae showed negative allometric growth because majority of the individuals sampled from areas with high anthropogenic activity were small sized. Fish that occupy stress free aquatic environments are likely to have grown stouter and heavier resulting to ‘b’ values of 3 and greater than 3 [25]. According to [26], isometric growth occurs when the volume of a fish is constant or taken as a surrogate of a linear measure of the size being modeled. A highly significant linear relationship between total and standard lengths and body weight indicates that body weight measurements in these riverine species could be reliably predicted from total length measurements after linearizing the curvilinear to obtain highly significant intercept and slope coefficients of the regression.
The allometric condition factor of fish is also governed by the feeding behaviour of fish. As the fish changes shape or density as it grows, it can become “plumper” with further increases in length assuming allometric growth [18]. Human activities also affect the river condition and influence the biological condition within the fishery ecosystem by altering water quality, flow regime, physical habitat structure and interactions among species [27]. For instance, the replacement of the natural vegetation cover with exotic Eucalyptus spp., may result to siltation, which has been worsened by the planting of annual crops which require frequent cultivation. As a result, large and more stable substrate, such as stones that offer surfaces for the attachment of macrophytes and algae which provide a food source for insects and fish is removed, resulting to loss of fish habitats and food reserves [28].
6. Conclusion and Recommendations
Most species in River Nyangweta Tributary exhibited allometric growth condition (b is greater than or less than 3) and only L. alternialis exhibited isometric growth among the seven dominant species. There were no references on LWRs and condition for most of the species sampled in the present study.
Fish sampled from and those with high abundance in upstream areas (MOC, RCS and NFO), which had high riparian activity exhibited negative allometry (b< 3), which indicated poor physiological condition. Anthropogenic activity, together with other factors such as inefficient sampling gear contributed to small sample size of fish used in calculating the LWRs and condition factors, the information obtained on native fish species in the Nyangweta tributary of River Kuja, which could limit generalizations on the fishery potential, recruitment and the physiological condition of the riverine fish populations with respect to environmental changes and human population growth. These findings suggest that conservation measures need to be taken to improve the fish health and physiological condition in upstream areas of the Nyangweta tributary.
Conflict of Interest
The authors declare no conflict of interest.
Acknowledgment
Special thanks to Kenya Marine and Fisheries Research Institute (KMFRI), Kisumu, Kenya for the technical support during collection and measurements of the fish samples. This study was funded by the Germany Exchange Program (DAAD) Masters Scholarship (Personal ID: 91637034) awarded to Mr. Fredrick Ondemo. The authors would also like to thank Kisii University for the institutional support received to obtain the required research permits.
- J. E. Beyer, “On length-weight relationship. Computing the mean weight of the fish of a given length class.”, Fishbyte, vol. 5, pp. 11–13, 1987.
- I. A. Abdel-Raheam, H. A. E., Abeer-Mohamed, H. M. K., Izeldeen, I. A., Mohammed, A. E. & d Mohammed, “Length-Weight Relationship and Condition Factor of Three Commercial Fish Species of River Nile, Sudan”, EC Oceanography, vol. 1, no. 1, pp. 01–07, 2017, doi:10.13140/RG.2.2.12579.37921.
- P. Marx, K. K., Vaitheeswaran, T., Chidambaram, P., Sankarram, S. and Karthiga, “Length – Weight Relationship of Nile Tilapia Oreochromis niloticus (Linnaeus, 1758) (Family: Cichlidae)”, Ind. J. Vet & Anim. Sci. Res., vol. 43, no. 1, pp. 33–39, 2014.
- P. Brosset, P. Fromentin, J., Van-Beveren, E., Lloret, J. & Marques, V., “Spatio-temporal patterns and environmental controls of small pelagic fish body condition from contrasted Mediterranean areas.”, Progress in Oceanography, Elsevier, vol. 151, pp. 149–162, 2017, doi:10.1016/j.pocean.2016.12.002.
- P. L. C. T. Bolger, “The selection of suitable indices for the measurement and analysis of fish condition”, Journal of Fish Biology, vol. 34, no. 2, pp. 171–182, 1989, doi:10.1111/j.1095-8649.1989.tb03300.x.
- R. Froese, “Cube law, condition factor and weight-length relationships: history, meta- analysis and recommendations.”, Journal of Applied Ichthyology, vol. 22, no. 4, pp. 241–253, 2006, doi:10.1111/j.1439-0426.2006.00805.x.
- Z. Gichana et al., “Effects of human activities on benthic macroinvertebrate community composition and water quality in the upper catchment of the Mara River Basin, Kenya”, Lakes & Reservoirs: Research & Management, vol. 20, no. 2, pp. 128–137, 2015, doi:10.1111/lre.12094.
- S. E. Orina N. E, Getabu A, Omondi R, “Ecosystem integrity of River Kuja based on habitat and fish biotic indices.”, International Journal of Tropical Hydrobiology & Fisheries, vol. 1, no. 1, pp. 7–13, 2018.
- T. Pj, A., Lk, H., Jr, P., Lj, J., Rhodes, T., & Ms, “Spatial patterns in fish biomass and relative trophic level abundance in a waste water enriched river”, Ecology of FRESHWATER FISH, vol. 16, no. 3, pp. 343–353, 2007, doi:10.1111/j.1600-0633.2007.00221.x.
- M. Silva, L. M. A., Oliveira, M. S. B., Florentino, A. C., & Tavares-Dias, “Length‐weight relationship of 11 fish species from a tributary of the Amazon River system in northern Brazil.”, Journal of Applied Ichthyology, vol. 1, no. 4, pp. 816–817, 2015, doi:10.1111/jai.12791.
- M. Oliveira, M. S. B., Silva, L. M. A., Prestes, L., & Tavares-Dias, “Length-weight relationship and condition factor of 11 fish species of the Igarapé Fortaleza basin, a tributary from the Amazon River system in eastern Amazon (Brazil)”, Journal of Applied Ichthyology, vol. 34, no. 4, pp. 1038–1041, 2018, doi:10.1111/jai.13679.
- F. C. Prestes, L., Oliveira, M. S. B., Tavares-Dias, M., Soares, M. G. M., & Cunha, “Length-weight relationship and condition factor of eight fish species from the upper Araguari River, State of Amapá, Brazil.”, Acta Scientiarum Biological Sciences, vol. 41, no. 1, pp. e46666, 2019, doi:10.4025/actascibiolsci.v41i1.46666.
- S. C. Sparre, P. & Venema, Introduction to tropical fish stock assessment. Part 1. ManualRome, Italy, , FAO (Food and Agricultural organisation), 1998.
- D. W. Taylor, P., Blackwell, B. G., Brown, M. L., Willis, “Relative Weight (Wr): Status and current use in fisheries assessment and management”, Reviews in Fisheries Science, vol. 8, no. 1, pp. 37–41, 2010, doi:10.1080/10641260091129161.
- Le Cren E.D., “Length-weight relationship and seasonal cycle in gonad weight and condition in perch (Perca fluviatilis).”, Journal of Animal Ecology, vol. 20, no. 2, pp. 201–219, 1951, doi:10.2307/1540.
- R Core Team, “R: A Language and Environment for Statistical Computing. R Foundation for Statistical Computing, Vienna.” Vienna, 2020.
- P. M. Omweno J. O., Orina P. S., Getabu, A. and Ondieki, “Comparative growth of Jipe tilapia, Oreochromis jipe and Nile tilapia, Oreochromis niloticus using regression modeling”, Int. J. Adv. Res., vol. 8, no. 09, pp. 984–992, 2020.
- D. W. Blackwell, B. G., Brown, M. L. & Willis, “Relative Weight (Wr): Status and current use in fisheries assessment and management.”, Reviews in Fisheries Science, vol. 8, pp. 1-44., 2000, doi:10.1080/10641260091129161.
- W. G. Snedecor, G.W. and Cochran, Statistical methods. Ames, Lowa, the Lowa state University., 6th Editio. Ames, Lowa, , the Lowa state University, 1967.
- N. Yilmaz, S., Yazmaz, S.,, O., Erbas_aran, M., Esen, S., Zengin, M., Polat, “Length weight relationship and relative condition factor of white bream, Blicca bjoerkna (L., 1758), from Lake Ladik, Turkey”, J. Black Sea/Medit. Environ, vol. 18, no. 3, pp. 380–387, 2012.
- S. Karna, S. K., Sahoo, D. & Panda, “Length Weight Relationship (LWR), Growth estimation and Length at maturity of Etroplus suratensis in Chilika Lagoon, Orissa, India.”, International Journal of Environmental Sciences, vol. 2, no. 3, pp. 1257–1267, 2012, doi:0.6088/ijes.00202030012.
- O. Cherif, M., Zarrad, R., Gharbi, H., Missaoui, H. & Jarboui, “Length-weight relationships for 11 fish species from the Gulf of Tunis (SW Mediterranean Sea, Tunisia)”, Pan- American Journal of Aquatic Sciences, vol. 3, no. 1, pp. 1–5, 2008.
- Omweno J. O., “Aquaculture Potential of Jipe tilapia (Oreochromis jipe Lowe, 1955).,” Kisii University, 2021.
- D. M. Britton, J. R. & Harper, “Juvenile growth of two tilapia species in Lakes Naivasha and Baringo, Kenya”, Ecology of FRESHWATER FISH, vol. 17, no. 3, pp. 481–488, 2008, doi:10.1111/j.1600-0633.2008.00298.x.
- Prasad G. and P.H. Anvar Ali, “Length-weight relationship of a cyprinid fish puntius filamentosus from Chalakudy River, Kerala.”, Zoos’ Print Journal, vol. 22, no. 3, pp. 2637-2638., 2007.
- D. Ogle, “fishR Vignette – Length-Weight Relationships.” Winsconsin, 2013.
- USEPA, “A practitioner’s guide to the biological condition gradient: A framework to describe incremental change in aquatic ecosystem.” Washington, DC, 2016.
- J. D. Wersal, R. M., & Madsen, International Plant Protection Convention- Aquatic Plants and Their Uses and Risk:A review of the global status of aquatic plantsRome, Italy, , International Plant Protection Convention (IPPC), 2014.
No related articles were found.