Quantitative Analysis Between Blackboard Learning Management System and Students’ Learning
(This article belongs to the Section Education and Educational Research (EER))
Export Citations
Cite
Darko, C. (2022). Quantitative Analysis Between Blackboard Learning Management System and Students’ Learning. Journal of Engineering Research and Sciences, 1(5), 119–133. https://doi.org/10.55708/js0105013
Charles Darko. "Quantitative Analysis Between Blackboard Learning Management System and Students’ Learning." Journal of Engineering Research and Sciences 1, no. 5 (May 2022): 119–133. https://doi.org/10.55708/js0105013
C. Darko, "Quantitative Analysis Between Blackboard Learning Management System and Students’ Learning," Journal of Engineering Research and Sciences, vol. 1, no. 5, pp. 119–133, May. 2022, doi: 10.55708/js0105013.
Proper use of the Blackboard Learning Management System (LMS) motivates students to engage with their studies but the students within Material Science and Engineering (MSE) often use these LMSs to copy mathematical derivations, scientific information and submit coursework tasks without spending much time interacting with the system. Quantitatively, there is a piece of missing information on how interaction with the Blackboard LMS influences students’ performances. Statistical evaluations were made by using the average times students spent on Blackboard and their final examination grades for their three-year Bachelor's degree period. There was a linear positive correlation between the time students spent on the LMS and their grades. Observations also show that students engage more with LMS at certain periods within a week. It was recognised that the more students engage with the Blackboard, the more they construct information for themselves. This result provides a quantitative analysis that gives evidence of how time spent on LMS supports students’ learning.
1. Introduction
Learning Management Systems (LMS) are normally employed in higher education institutions to engage students [1,2]. The LMSs allow students to visualise lecture slides, interact with students and lecturers and submit their work. The influence of the time students spend online and their performances have not been evaluated quantitatively in a more relaxed and real-world approach [3,4]. Investigations on students’ choice of online tools and the link between their unconscious (i.e. in a real-world environment) online hours and their final grades were made.
Previously, some studies discussed the interactions in terms of the time students spent online and their final performances were done [5,6]. Studies were made on asynchronous learning processes via an Educational Data Mining approach while using data extracted from the Moodle logs of students [5]. In that study, conclusions were made that clusters that are Task-oriented are efficient because they invested a high quantity of time in their tasks and they become high achievers than the Non-Task-Oriented Group that spent a small amount of time working on the practical task. Another investigation [6] revealed that Consistent use students and Slide intensive use students clusters who spend more time had better homework and examination grades than the Less use students group who spent less time. After analyzing LMS system logs in 59 computer science students during the blended learning approach [6], it was also generally confirmed that those who spent more time had better grades.
1.1. LMS and their functions
The motivation for students to access a particular LMS tool varies and links to their learning performances [7]. In that study, varied reasons for students’ satisfaction were predicted based on their usage frequencies after a model of the information system was developed to evaluate students’ satisfaction in terms of the quality, service and, pedagogical.
Table 1 shows a summary of the most available LMS tools with their functionality, affordability, suitability and limitations [8-13]. From table 1, it can be observed that Blackboard LMS promotes online discussions, permits the visualization of other internet platforms (e.g. web pages, wikis, blogs, email ,etc), and analytical monitoring tools [12]. The Massive Open Online Course (MOOCs) LMS supports students’ discussions, allows quizzes, and uploading of lectures materials [8]. The MOOCs LMS platforms allow forum use, lecture podcast viewing, quizzes, material downloads and assignment submissions [11, 14].
The Canvas LMS also enables students to participate in discussion forums [15] while the Accord LMS allows free accessibility and customized multicultural training for school professionals [13], It was also observed that Schoology provide teachers and students with the opportunity to set up groups, courses, administer and integrate resources, and create statistical data on students’ progression [10].
Most high educational institutions universities use Blackboard LMS to engage with their students [16-18]. Previous reports on Blackboard suggest that students improve their performances when they engage more with the LMS [19-22]. While students engaged well with their peers, the staff viewed face-to-face interactions as a valuable learning experience in one of those studies [22]. The Blackboard LMS was also noticed to improve positively both students and staff interactions in a computer literacy program [21].
When Blackboard is compared with other LMSs [23-25], it was observed that Moodle was being preferred because of the ease of its [23] but Schoology was adjudged to improve communication skills, collaborations and connect with stakeholders on the same platform [25]. However, the Blackboard LMS was found to be superior e-learning LMS for course curriculums and students’ engagement.
1.2. Purpose of the study
This work looks to improve the work done in the past that looks to find a relationship between the time students spent online and their performances [5,6,26,27] but with a real-world teaching environment. The real unconscious average time that students spent online during their entire studies were investigated and linked to their final grades. The approach of this work is to remove any barrier that inhibits a real teaching environment and statistically quantified the relationship.
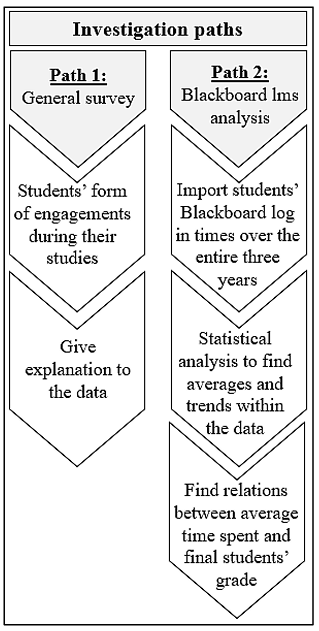
There are two approaches; (1) investigating students’ preferred online engagement, and (2) statistically evaluating the relationship between students’ Blackboard leearning times and their final grades.
2. Method
The following survey and experimental approach were adopted;
Pathway 1: The undergraduate MSE students were surveyed and their responses illustrated under appendix A, section 1. Data collected for forms of engagements are as shown in tables 1 to 3 (appendix A). A plot of the responses were also done to vislualize students’s perception..
Table 1. Examples of learning management systems and their functions
LMS tool | Functions | Limitation |
Blackboard | Create online assessments, facilitate discussion and deliver high-quality training and learning content. Have a variety of blended learning capabilities, social engagement features and content authoring tools to enhance e-learning content and learner engagement. It has threads to structure online discussions and allows posting and replies. Currently, it allows videos, display of web pages, wikis, blogs, email, and analytics that monitors students’ activities as well as surveys [12]. | Usability does not just apply to business software or entertainment websites [17]. |
MOOCs | MOOCs allows videos, discussion forums, chat groups, lecture materials, quizzes, lecture viewing, and coursework submissions [8]. | Needs to initiate a platform to include multiple pathways that support user activities [14]. |
Moodle | Features course gamification, peer and self-assessment, file management, multilingual capabilities and a shared calendar. Users can create course forums, wikis and more. Free license cost. Moodle promotes videos adaptation, chat forums, chat groups, uploading lecture resources, setting of quizzes, lecture viewing, and coursework submissions [11]. | Needs proper IT architecture and manpower in place to implement and maintain a system. |
Canvas | Web-based software that offers all of the core LMS functionality including course and assessment creation, and course management [15]. | Does not have links to social media sites like YouTube and Facebook for informal learning. |
Accord | A web-based software for schools and businesses that promotes social learning and role-based groups to engage with over 200,000 students. More affordable than Blackboard [13]. | It has a reporting challenge. |
Schoology | The objective of this free platform is to create a learning strategy for students and to motivate studying online. On this platform, teachers and students are able to develop groups and courses, administer resources, set course materials and present statistical data for students’ assessments [10]. Other platforms such YouTube, Google Drive and Turnitin can be used. | While navigation can be confusing, it requires operator to allow students to unenroll. |
Pathway 2: The number of Blacboard logs from previous third-year Bachelor students were investigated and compared with their grades. Tables 4 and 5 (appendix B) show the average data from sixty-nine (69) students in a semester-year and the entire three-year period were obtained from the e-learning person. The students’ IDs were replaced with numbers to ensure complete anonymity based on ethical reasons and that allowed the evaluation between their login times during the entire study period and their final grades.
In the statistical analysis, averages were made from the total average login times for each year (table 5, appendix B), After that, trend analyses were made to bring out a clear relationship between the students’ login times and their final grades.
In the survey, the type of program, learning style, method of learning new concepts, engagement form as well as type of internal and external digital resources (see Appendix A, section 1) were investigated. Random responses from eighty-three (83) students that selected multiple choices were obtained. A student can select all five (5) options in the learning styles, three (3) for learning new concepts, four (4) for forms of engagement and two (2) for internal digital that support learning as shown in section (appendix A). There would be 415 if all 83 students in table 1 select all 5 options within the forms of engagements (appendix A). As a result, table 1 (appendix A) revealed a total of 212 selections for the forms of engagement that constitute 46 responses for the lecturer’s feedback, 45 for Blackboard, 41 for face-to-face lectures, 39 for demonstrations, 36 for coursework, 1 for lecture sheets, 1 for podcast content, 1 for seminars, 1 for academic one-to-one engagement and 1 for going over contents for the low-grade students.
2.1. Calculating Simple Moving Average
To visualize the trend of the bivariate data between the mean time students spent on LMS and their grades, trend analysis [28,29,30] was performed using a four (4) point simple moving average (SMA) [31] as follows;
$$SMA = \frac{(S_n + S_{n+1} + S_{n+2} + S_{n+3})}{4}$$
The terms Sn, Sn+1, Sn+2, and Sn+3 are four (4) consecutive numbers from the table. In the trend analysis, the first 4 numbers within the column were averaged which was followed by the next 4 consecutive numbers as shown in table 6 (appendix B). The procedure was repeated until all data were used.
2.2. Calculating the Product Moment Correlation Coefficient (r)
The correlation coefficient called Product Moment Correlation Coefficient (r) [32, 33, 34] was used to predict the correlation between the average time spent by the students and their grades at the end of their three-year program after the SMA trend analysis. The correlation coefficient, r, is given by;
$$r = \frac{S_{xy}}{\sqrt{S_{xx} S_{yy}}}$$
Where
$$S_{xx} = \sum x^2 – \frac{(\sum x)^2}{n}$$
$$\quad S_{yy} = \sum y^2 – \frac{(\sum y)^2}{n}$$
$$\quad S_{xy} = \sum xy – \frac{\sum x \sum y}{n}$$
Note that x represents the variables for the total average obtained from the average times students spent over the three years, and y, the variables for their final grades obtained. The r-value can be defined as;
−𝟏 ≤ 𝒓 ≤ 𝟏
When r = 1, a positive linear correlation is obtained, r = -1 gives a negative linear correlation, and r = 0 predicts a no correlation data.
3. Results
In pathway 1, and since the department uses the Blackboard LMS, the survey done was to find out whether students use any other online engagements and most of them confirm the usage of Blackboard. This was followed by the statistical analysis in pathway 2 to find the correlation between the average time spent by students on Blackboard over the three years and their final grades. The results obtained have been explained below.
3.1. Survey results
The survey results demonstrate that students rely more on lecturer feedback, Blackboard, in-person discussions with the lecturer, graduate teaching assistance (GTA) demonstrations and coursework as shown in figure 2a. It can be postulated that the MSE students deal more with mathematical derivations, theory and science definitions and they get more information from the Blackboard LMS which also enables them to have fruitful discussions with lecturers. Interactions with some of the other students revealed that they focus more on how to get better grades rather than engaging in seminars and other meetings.
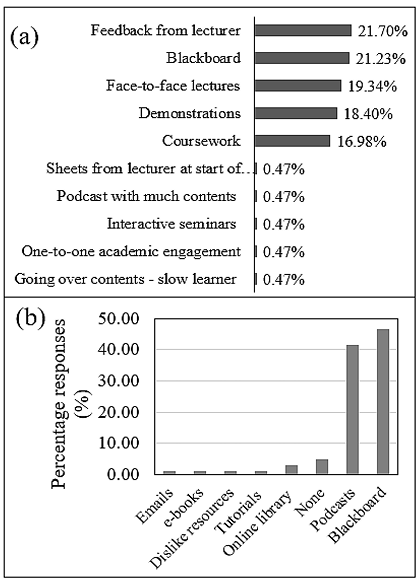
The survey results confirmed the use of Blackboard LMS as the most used digital resource used by the students (figure 2b) but there were also higher ratings for podcasts that can be accessed through the Blackboard LMS. In addition, there were other online platforms such as YouTube, emails, etc. also embedded in Blackboard. Meaning that the results in figure 2b are more informative and justifies why the relationship between the average Blackboard log times and students’ final grades is very important.
3.2. Students’ log times versus their final grades
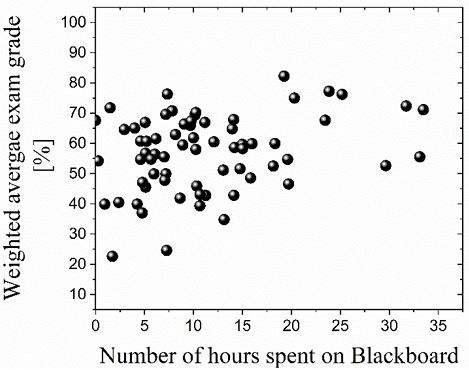
The average login times students spent online per day for the two-semester period have been plotted against their final exam grades (figure 3). It was clear that there was a weak positive linear correlation but it was necessary to work with the exams grade since all students were examined using the same examinations process. It was believed that all students use similar exam preparation times, and exam guidelines but the information absorption might vary. The main point is that the students might have different learning styles, absorption rates, capacity of the working memories and that might influence their final grades [35,36]. In summary, the data represent perfectly the students’ performances because they all received the same Blackboard LMS information.
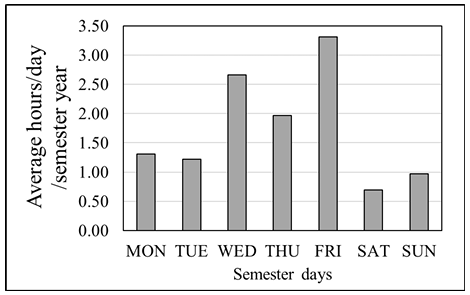
Another intriguing analysis is shown in figure 4. It was noticed that had more engagement with the Blackboard on Wednesdays and Fridays over the two semesters and this suggests that lecturers might use these two days to effectively communicate with the students. The lecturers might use those two days to set coursework deadlines. The remaining days are not suitable for scheduling assignment deadlines since students do not engage well on those days.
3.2.1. Finding the relationship between the average time students spent online versus their final grades
After statistical analyses of the data by using the four (4) point moving average described in section 2.1, the full results obtained are as shown in table 6 (appendix B). The four (4) point moving process involves averaging the first 4 numbers in each column before moving to the next four (4) consecutive numbers until all data is completed.
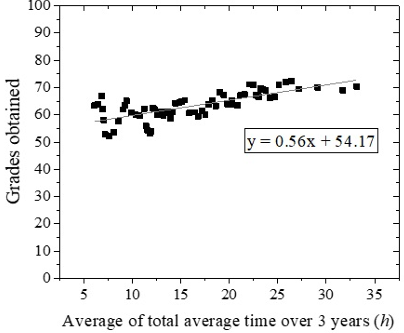
The results after the statistical analysis of the data gave a strong positive correlation between the overall average time students spent online and their final grade (figure 5). The statistical trend analysis enabled the visualization of the relationship between this complex bivariate data. The complexity of the data stems from the fact that the accurate and effective usage of the Blackboard LMS by the students cannot be quantified perfectly but the trend analysis gives a good indication of the relationship between the data. The r-square value of 0.56 (figure 5) suggests a strong positive correlation after the statistical trend analysis.
3.2.2. Product Moment Correlation Coefficient (r)
To confirm the strength of the correlation, the treated data from the 4 points moving average were used to calculate the correlation coefficient (r). Using the description under section 2.2, the values in table 7 (appendix B) were generated. The values in table 7, appendix B) were calculated with;
$$\sum x = 1097.74$$
$$\quad \sum y = 4241.70$$
$$\quad \sum x^2 = 21044.37$$
$$\quad \sum y^2 = 270272.92$$
$$\quad \sum xy = 71252.63$$
The number of data used, n = 67.
Meaning,
$$S_{xx} = 21044.37 – \frac{(1097.74)^2}{67} = 3558.80$$
$$S_{yy} = 270272.92 – \frac{(4241.70)^2}{67} = 1735.32\quad$$
$$\quad S_{xy} = \sum xy – \frac{\sum x \sum y}{n} \quad$$
$$\quad S_{xy} = 71252.63 – \frac{1097.74 \times 4241.70}{67} = 1755.86$$
and
$$r = \frac{1755.86}{\sqrt{3558.80 \times 1735.32}} \quad$$
$$\quad r = 0.71$$
The value of r around 0.7 means that the square value is 0.5 (i.e. r2 = 0.5) and this confirms that the perfect positive linear correlation that exists between the bivariate data is similar to that obtained from the plot in figure 5.
4. Discussions
The observations reveal that students engage more with the Blackboard LMS on Wednesdays and Fridays and it was not checked whether this is peculiar to the MSE program but the result is similar to a different study where students were found to interact more with the Blackboard at certain periods [37, 38]. It also provides substantial information that lecturers must avoid setting deadlines and actions on the rest of the days sinc students might stick more to their non-academic activities.
The very good and positive correlation obtained after the statistical trend analysis gives evidence of the fact that there were several factors at play and a clear picture could only be observed after the trend analysis. It was believed that before the trend analysis (figure 3), factors such as technology barriers [39], misconceptions because of internationalization [40]), different learning styles [41-44], and Blackboard inactivity after login [45] may have influenced the correlation. Hence, the analysis was necessary to mitigate those factors and promote a clear picture of the data.
The positive correlation predicts that the more engagements students have with the Blackboard LMS, the more they will improve their grades and the result is comparable to previous findings. Students who spent more time improve their grades and became high achievers [5, 6, 46].
The result also relates to the constructivism learning theory [47] that suggests that learning must be an active process where students construct their learning and that can be said to have happened when they engage more with the Blackboard LMS [48].
4.1. Effects of reading from the computer screen on the results
Excessive participation in online learning and discussions may occasionally inhibit students’ learning since that might affect their concentration and divert them from the main issues during learning [49]. To aid effective online discussions and reduce students’ search times online, content quality must be the top priority. As suggested by the cognitive learning theory, part of the reasons why students do not store information correctly is their ineffectiveness to process the acquired information via a computer screen [50]. The usage of Tablets may also pose a technological hindrance during information capturing since special skills will be required to enhance performance [51].
In the human eye, the process is such that, the retina (composed of millions of light receptors known as rods and cones that detect visible light) conveys reading information to the brain and the brain translates the information as visual objects. The act of gazing and movement of the eye in front of computer screens can predict user intentions [52]. Previous investigations suggest that gazing prompts attention and directs cognitive processes within the brain [52]. This is because our attentional orienting system quickly and automatically prioritizes salient visual events [53].
Furthermore, screen characters, contrast, colour, background, and the dynamic aspects of the screens affect readability [54]. Kim and Albers [55] noted that user motivation in searching for information, varied information, and user’s knowledge of the types of information are key factors for consideration. Moreover, reading is normally done for quality but not on the reading speed [56].
4.2. Influence of the cognitive processes on the results
Sticking with the cognitive learning theory that postulated that learning is the development of knowledge and conceptual development which includes the storing of knowledge in the brain and the process of that knowledge [57, 58, 59]. In another study, Piaget was also quoted to have described learning to be the formation of new schemas (i.e. a pattern of thought) and the building on previous schemas [50]. It was also disclosed that Piaget proposed learning to be an organization of schemas and adaptation of schemas and that new information is created by absorbing and readjusting previous schemas [60]. In addition to the above, when the cognitive load is less it becomes easier and more processable than a high cognitive load because some of the working memories of users cannot process a very heavy load [35, 36].
4.3. Influence of the Blackboard screen design on the results
Designing a good Blackboard LMS screen can improve spontaneous information processing and reduce the cognitive load during learning [61]. There is a high cognitive load requirement when reading from the screen than for print because there is an additional screen navigation skills requirement [62-66]. Hence, poorly designed computer screens hinder communication [67].
4.4. Influence education level and computer usage
The education level of any student might influence their computer skills to scan through the screens and absorb information and this will have the same limitations of the required information landing on the retina before transporting it for conversion into the desired results [52, 68]. After that, the brain prioritizes salient visual events [53]. The mood of the user might also influence the required skills to scan the computer screens efficiently [69] and this has been noticed that positive moods predispose people towards using computers, while negative moods contribute to computer avoidance [70, 71].
5. The implication of this study
The students preferring the Blackboard LMS was because it was the only one adopted by our institution even though other students occasionally use other forms of engagement, they did not alter their preferences.
Some students spend much time during information absorption and this can be explained by the cognitive learning theory such that effective learning can be achieved if previously-stored information can be processed further to create new knowledge and enhance conceptual development [57, 58, 59]. The explanation suggests that spending more time on the Blackboard LMS helps to process stored knowledge and the creation of new information. Piaget’s work also confirms this notion that learning is the formation of new schemas (i.e. a pattern of thought) and building upon previous schemas during learning [50]. It can be summarized under this section that students who spend much time on the Blackboard LMS have much time to absorb information irrespective of the working memory capacity and they can readjust previous schemas [60].
The screen design also plays a role in knowledge absorption and an excellent screen design promotes spontaneous processing of information and improves students’ learning rate [61]. Normally, students who engage with the screen readings need to deal with a greater cognitive load than print reading since they required additional time and skills to have an effective scanning of the information [62, 63].
From another angle, the level of education might also affect their information scanning abilities because some inexperienced students may not be used to this process of fishing out information from the screen. Having positive moods enhances computer engagement [70,71] which was also confirmed by a previous study observing that the computer skills were greatly affected by the mood of the users [69]. Consequently, this might influence the time students spent online even though it can not be justified what students do online when they log in. Furthermore, this work will have extensive studies on what students do when they log onto Blackboard LMS including any upgrade on the Blackboard software within the three years. It is noted that there might be a frequent update of the Blackboard LMS that would have affected every student during the investigations.
6. Conclusion
To conclude, the work demonstrates that students engage more on Wednesdays, Thursdays and Fridays and their engagement with the Blackboard was found to correlate positively with their final grades after trend analysis was performed on the data. It was noticed that the trend analysis supported the visualization of the pictorial correlation by minimising the complexity of the data. This result suggests that spending much time on the Blackboard LMS might help the creation of new knowledge in the schema and allows further process within the memory that may support the development of new information.
Conflict of Interest
The authors declare no conflict of interest.
Acknowledgement
The author will like to thank colleagues and students that supported the work.
- H Duin, J. Tham, “The current state of analytics: Implications for learning management system (LMS) use in writing pedagogy,” Computers and Composition, vol. 55, p. 102544,. doi.org/10.1016/j.compcom.2020.102544
- R. Rabiman, M. Nurtanto, N. Kholifah, “Design and Development E-Learning System by Learning Management System (LMS) in Vocational Education,” Online Submission, vol. 9(, pp. 1059-1063, 2020.
- H. Ghapanchi, A. Purarjomandlangrudi, A. McAndrew, Y. Miao, “Investigating the impact of space design, visual attractiveness and perceived instructor presence on student adoption of learning management systems,” Education and Information Technologies, vol. 25, pp. 5053-5066, doi.org/10.1007/s10639-020-10204-5.
- Y. Su, C. H. Chen, “Investigating university students’ attitude and intention to use a learning management system from a self-determination perspective,” Innovations in Education and Teaching International, pp.1-10, doi.org/10.1080/14703297.2020.1835688.
- R. Cerezo, M. Sánchez-Santillán, M. P. Paule-Ruiz, J. C. Núñez, “Students’ LMS interaction patterns and their relationship with achievement: A case study in higher education,” Computers & Education, vol. 96, pp. 42-54, 2016, doi.org/10.1016/j.compedu.2016.02.006.
- Y. Li, C. C. Tsai, “Accessing online learning material: Quantitative behavior patterns and their effects on motivation and learning performance,” Computers & Education, vol. 114, 286-297, 2017, doi.org/10.1016/j.compedu.2017.07.007.
- H. L. Koh, R. Y. P. Kan, “Perceptions of learning management system quality, satisfaction, and usage: Differences among students of the arts,” Australasian Journal of Educational Technology, vol. 36, pp. 26-40, 2020, doi.org/10.14742/ajet.5187
- Baikadi, C. Demmans Epp, C. D. Schunn, “ Participating by activity or by week in MOOCs,” Information and Learning Science, 2018, doi.org/10.1108/ILS-04-2018-0033.
- D. Epp, K. Phirangee, J. Hewitt,C. A. Perfetti, “Learning management system and course influences on student actions and learning experiences,” Educational Technology Research and Development, vol. 68, pp. 3263-3297, 2020, doi.org/10.1007/s11423-020-09821-1.
- Juarez Santiago, J. M. Olivares Ramirez, J. Rodríguez-Reséndiz, A..Dector, R. Garcia Garcia, J. E. González-Durán, F. Ferriol Sanchez, “Learning Management System-Based Evaluation to Determine Academic Efficiency Performance,”. Sustainability, vol. 12, p. 4256, 2020, doi.org/10.3390/su12104256.
- H. S. Simanullang, J. Rajagukguk, (2020). Learning Management System (LMS) Based On Moodle To Improve Students Learning Activity. In Journal of Physics: Conference Series, vol. 1462, p. 012067. IOP Publishing. 2020, doi.org/10.1088/1742-6596/1462/1/012067.
- Tseng, “An exploratory study of students’ perceptions of learning management system utilisation and learning community,” Research in Learning Technology, vol. 28, 2020, doi.org/10.25304/rlt.v28.2423.
- Vallone, E. Dell’Aquila, M. C. Zurlo, D. Marocco, “ACCORD’e-Platform: development and evaluation of an innovative multicultural training for school professionals,” In PSYCHOBIT, 2020.
- Ferguson, E. Scanlon, L. Harris, ”Developing a strategic approach to MOOCs,” Journal of Interactive Media in Education, vol. 1, p. 21, 2016. For more information, see https://doi.org/10.5334/jime.439.
- B. Mpungose, S. B. Khoza, “Postgraduate students’ experiences on the use of Moodle and Canvas learning management system,” Technology, Knowledge and Learning, pp. 1-16, 2020, doi.org/10.1007/s10758-020-09475-1.
- Almoeather, “Effectiveness of Blackboard and Edmodo in self-regulated learning satisfaction, “Turkish Online Journal of Distance Education (TOJDE), vol. 21, 2020, doi.org/10.17718/tojde.728140.
- Conley, Y. Earnshaw, G. McWatters, “Examining Course Layouts in Blackboard: Using Eye-Tracking to Evaluate Usability in a Learning Management System,” International Journal of Human–Computer Interaction, vol. 36, pp. 373-385, 2020, doi.org/10.1080/10447318.2019.1644841.
- Naim, F. Alahmari, “Reference Model of E-learning and Quality to Establish Interoperability in Higher Education Systems,“ International Journal of Emerging Technologies in Learning (iJET), vol. 15, pp. 15-28, 2020, doi.org/10.3991/ijet.v15i02.11605.
- Romanov, A. Nevgi, “Do medical students watch video clips in eLearning and do these facilitate learning?” Medical teacher, vol. 29, pp. 490-494, 2007, doi.org/10.1080/01421590701542119.
- S. Liaw, “Investigating students’ perceived satisfaction, behavioral intention, and effectiveness of e-learning: A case study of the Blackboard system,” Computers & education, vol. 51, pp. 864-873, 2008, doi.org/10.1016/j.compedu.2007.09.005.
- Martin, “Blackboard as the learning management system of a computer literacy course,” Journal of Online Learning and Teaching, vol. 4, pp. 138-145, 2008.
- Heirdsfield, S. Walker, M. Tambyah, D. Beutel, “Blackboard as an online learning environment: What do teacher education students and staff think?” Australian Journal of Teacher Education (Online), vol. 36, p. 1, 2011, doi.org/10.14221/ajte.2011v36n7.4.
- Machado, E. Tao, “ Blackboard vs. Moodle: Comparing user experience of learning management systems,” In 2007 IEEE 37th annual frontiers in education conference-global engineering: Knowledge without borders, opportunities without passports (IEEE), pp. S4J-7, 2007, doi.org/10.1109/fie.2007.4417910.
- Biswas, “Schoology-supported classroom management: A curriculum review,” Northwest Journal of Teacher Education, vol. 11, p. 12, 2013, doi.org/10.15760/nwjte.2013.11.2.12.
- S. Sicat, “Enhancing college students’ proficiency in business writing via schoology,” International Journal of Education and Research, vol. 3, pp. 159-178, 2015.
- Romero, S. Ventura, “Educational data mining: a review of the state of the art. IEEE Transactions on Systems, Man, and Cybernetics, Part C (Applications and Reviews), vol. 40, pp. 601-618, 2010.
- Calafiore, D. S. Damianov, “The effect of time spent online on student achievement in online economics and finance courses,” The Journal of Economic Education, vol. 42, pp. 209-223, 2011, doi.org/10.1080/00220485.2011.581934.
- R. Esterby, “Trend analysis methods for environmental data,” Environmetrics, vol. 4, pp. 459-481, 1993, doi.org/10.1002/env.3170040407.
- Kivikunnas, “Overview of process trend analysis methods and applications,” In ERUDIT Workshop on Applications in Pulp and Paper Industry, 395-408, 1998.
- Hess, H. Iyer, W. Malm, “Linear trend analysis: a comparison of methods,” Atmospheric Environment, vol. 35, pp. 5211-5222, 2001, doi.org/10.1016/s1352-2310(01)00342-9.
- Educba, “Moving average formula,” 2020. For more information, see https://www.educba.com/moving-average-formula/.
- R. Derrick, B. T. Bates, J. S. Dufek, “Evaluation of time-series data sets using the Pearson product-moment correlation coefficient,” Medicine and science in sports and exercise, vol. 26, pp. 919-928, 1994, doi.org/10.1249/00005768-199407000-00018.
- T. Puth, M. Neuhäuser, G. D. Ruxton, “Effective use of Pearson’s product–moment correlation coefficient,” Animal behaviour, vol. 93, pp. 183-189, 2014, doi.org/10.1016/j.anbehav.2014.05.003.
- Wolfram Mathworld, “Correlation Coefficient,” 2020. For more information, see https://mathworld.wolfram.com/CorrelationCoefficient.html/.
- Sweller, P. Chandler, “Why some material is difficult to learn,” Cognition and instruction, vol. 12, pp. 185-233, 1994, doi.org/10.1207/s1532690xci1203_1.
- S. Yeung, “Cognitive load and learner expertise: Split-attention and redundancy effects in reading comprehension tasks with vocabulary definitions,” The Journal of Experimental Education, vol. 67, pp. 197-217, 1999, doi:10.1080/00220979909598353.
- Carvalho, N. Areal, J. Silva, “Students’ perceptions of Blackboard and Moodle in a Portuguese university,” British Journal of Educational Technology, vol. 42, pp. 824-841, 2011, doi:10.1111/j.1467-8535.2010.01097.x.
- L. Larkin, S. I. Belson, “Blackboard technologies: A vehicle to promote student motivation and learning in physics,” Journal of STEM Education: Innovations and Research, vol. 6., 2005.
- M. Al Meajel, T. A. Sharadgah, “Barriers to using the Blackboard system in teaching and learning: Faculty perceptions,” Technology, Knowledge and Learning, vol. 23, pp. 351-366, 2015, doi.org/10.1007/s10758-017-9323-2.
- Tange, “Caught in the Tower of Babel: university lecturers’ experiences with internationalisation,” Language and Intercultural Communication, vol. 10, pp. 137-149, 2010, doi.org/10.1080/14708470903342138.
- Heaton‐Shrestha, C. Gipps, P. Edirisingha, T. Linsey, “Learning and e‐learning in HE: the relationship between student learning style and VLE use, “ Research Papers in Education, vol. 22, pp. 443-464, 2007, doi.org/10.1080/02671520701651797.
- Graf, T. C. Liu, “Analysis of learners’ navigational behaviour and their learning styles in an online course,” Journal of Computer Assisted Learning, vol. 26, pp. 116-131, 2010, doi:10.1111/j.1365-2729.2009.00336.x.
- Preidys, L. Sakalauskas, “Analysis of students’ study activities in virtual learning environments using data mining methods,” Technological and economic development of economy, vol. 16, pp. 94-108, 2010, doi.org/10.3846/tede.2010.06.
- Y. Huang, S. W. Lin, T. K. Huang, “What type of learning style leads to online participation in the mixed-mode e-learning environment? A study of software usage instruction,” Computers & Education, vol. 58, pp. 338-349, 2012, doi.org/10.1016/j.compedu.2011.08.003.
- Kashima, S. Matsumoto, “Estimating the difficulty of exercises for inactive students in user-based e-learning,” In Iaeng Transactions On Engineering Technologies, vol. 7, pp. 103-114, 2012, doi.org/10.1142/9789814390019_0008.
- F. Nyabawa, “Technology in Learning: Blackboard Usage & Its Impact on Academic Performance,” International Journal of Humanities and Management Sciences (IJHMS), vol. 4, 2016. For more information, see http://www.isaet.org/images/extraimages/P1216204.pdf..
- H. Wu, H. C. Hsiao, P. L., Wu, C. H. Lin, S. H. Huang, “Investigating the learning‐theory foundations of game‐based learning: a meta‐analysis.,” Journal of Computer Assisted Learning, vol. 28, pp. 265-279, 2012, doi:10.1111/j.1365-2729.2011.00437.x.
- J. Vogel‐Walcutt, J. B. Gebrim, C. Bowers, T. M. Carper, D. Nicholson, “Cognitive load theory vs. constructivist approaches: which best leads to efficient, deep learning?,” Journal of Computer Assisted Learning, vol. 27, pp. 133-145, 2011, doi:10.1111/j.1365-2729.2010.00381.x.
- G. Wolff, M. R. Dosdall, “Weighing the risks of excessive participation in asynchronous online discussions against the benefits of robust participation,” MERLOT Journal of Online Learning and Teaching, vol. 6, pp. 55-61, 2010.
- A. Chalmers, “The role of cognitive theory in human–computer interface,” Computers in human behavior, vol. 19, pp. 593-607, 2003, doi: 10.1016/S0747-5632(02)00086-9.
- Debue, N. Ou, C. van de Leemput, “An investigation of using a tablet computer for searching on the web and the influence of cognitive load,” Tutorials in Quantitative Methods for Psychology, vol. 16, pp. 226-239, 2020, doi: 10.20982/tqmp.16.3.p226.
- Biedert, G. Buscher, A. Dengel, “The eyebook–using eye tracking to enhance the reading experience,” Informatik-Spektrum, vol. 33, pp. 272-281, 2010, doi: 10.1007/s00287-009-0381-2.
- Carrasco, N. M. Hanning, “Visual Perception: Attending beyond the Eyes’ Reach,” Current Biology, vol. 30, pp. R1322-R1324, 2020, doi: 10.1016/j.cub.2020.08.095.
- B. Mills, L. J. Weldon, “Reading text from computer screens,” ACM Computing Surveys (CSUR), vol. 19, pp. 329-357, 1987, doi: 10.1145/45075.46162.
- Kim, M. J. Albers, “Web design issues when searching for information in a small screen display,” In Proceedings of the 19th annual international conference on Computer documentation, pp. 193-200, 2001, doi: 10.1145/501516.501555.
- Dillon, “Reading from paper versus screens: A critical review of the empirical literature,” Ergonomics, vol. 35, pp. 1297-1326, 1992, doi: 10.1080/00140139208967394.
- W. Satzinger, “‘The effects of conceptual consistency on the end user’s mental models of multiple applications,” Journal of Organizational and End User Computing (JOEUC), vol. 10, pp. 3-15, 1998.
- C. Bartlett, F. C. Bartlett, “Remembering: A study in experimental and social psychology,” Cambridge University Press, 1995.
- Bernstein, “Essentials of psychology,” Cengage learning, 2018..
- S. McNamara, “Effects of prior knowledge on the generation advantage: Calculators versus calculation to learn simple multiplication,” Journal of Educational Psychology, vol. 87, p. 307, 1995, doi: 10.1037/0022-0663.87.2.307.
- Nichols, “Reading and studying on the screen: An overview of literature towards good learning design practice,” Journal of Open, Flexible, and Distance Learning, vol. 20, pp. 33-43, 2016.
- DeStefano, J. –A. LeFevre, “Cognitive load in hypertext reading: A review,” Computers in Human Behavior, vol. 23, pp. 1616–1641, 2007, doi: 10.1016/j.chb.2005.08.012.
- Lauterman, R. Ackerman, “Overcoming screen inferiority in learning and calibration,” Computers in Human Behavior, vol. 35, pp. 455–463, 2014, doi: 10.1016/j.chb.2014.02.046.
- Mangen, B. R. Walgermo, K. Brønnick, “Reading linear texts on paper versus computer screen: Effects on reading comprehension,” International Journal of Educational Research, vol. 58, pp. 61–68, 2013, doi: 10.1016/j.ijer.2012.12.002.
- Wästlund, H. Reinikka, T. Norlander, T. Archer, “Effects of VDT and paper presentation on consumption and production of information: Psychological and physiological factors,” Computers in Human Behavior, vol. 21, pp. 377–394, 2005, doi: 10.1016/j.chb.2004.02.007.
- Wästlund, T. Norlander, T. Archer, “The effect of page layout on mental workload: A dual-task experiment,” Computers in Human Behavior, vol. 24, pp. 1229–1245, 2008, doi: 10.1016/j.chb.2007.05.001.
- M. Heines, Screen design strategies for computer-assisted instruction. Digital Press, 1984.
- Larissa, “What Are the Eyes and How Do They Work?,” KidsHealth, 2019. For more information, see https://kidshealth.org/en/parents/eyes.html#:~:text=The%20retina%20(the%20soft%2C%20light,sensitive%20to%20light%20than%20cones..
- J. Rozell, W. L. Gardner III, “Cognitive, motivation, and affective processes associated with computer-related performance: a path analysis,” Computers in Human behavior, vol. 16, pp. 199-222, 2000, doi: 10.1016/S0747-5632(99)00054-0.
- H. Dambrot, S. M. Silling, A. Zook, “Psychology of computer use: II. Sex differences in prediction of course grades in a computer language course,” Perceptual and Motor Skills, vol. 66, pp. 627-636, 1998, doi: 10.2466/pms.1988.66.2.627.
- Mitra, “Categories of computer use and their relationships with attitudes toward computers,” Journal of Research on computing in Education, vol. 30, pp. 281-295, 1998, doi: 10.1080/08886504.1998.10782227.
No related articles were found.