Hybrid Frameworks for the Multi-objective Optimization of Distributed Generation Units and Custom Power Devices with Simultaneous Distribution Network Reconfiguration
(This article belongs to the Section Electronic Engineering (EEE))
Export Citations
Cite
Ramsami, P. and King, R. T. F. A. (2022). Hybrid Frameworks for the Multi-objective Optimization of Distributed Generation Units and Custom Power Devices with Simultaneous Distribution Network Reconfiguration. Journal of Engineering Research and Sciences, 1(5), 186–197. https://doi.org/10.55708/js0105020
Pamela Ramsami and Robert Tat Fung Ah King. "Hybrid Frameworks for the Multi-objective Optimization of Distributed Generation Units and Custom Power Devices with Simultaneous Distribution Network Reconfiguration." Journal of Engineering Research and Sciences 1, no. 5 (May 2022): 186–197. https://doi.org/10.55708/js0105020
P. Ramsami and R.T.F.A. King, "Hybrid Frameworks for the Multi-objective Optimization of Distributed Generation Units and Custom Power Devices with Simultaneous Distribution Network Reconfiguration," Journal of Engineering Research and Sciences, vol. 1, no. 5, pp. 186–197, May. 2022, doi: 10.55708/js0105020.
The increased penetration of renewable energy sources in the distribution system affects the stability and efficiency of the system. To account for the intermittent nature of these sources, distribution network reconfiguration and the integration of custom power devices are important. This paper aims to identify the optimum location of photovoltaic systems and unified power quality conditioners in the distribution system considering economic and technical aspects. Three metaheuristic algorithms namely nondominated sorting genetic algorithm-II (NSGA-II), strength pareto evolutionary algorithm-2 (SPEA2) and multi-objective evolutionary algorithm based on decomposition (MOEA/D) were employed. Furthermore, three hybrid algorithms were developed by dividing the population into two parts. Multi-objective particle swarm optimisation (MOPSO) was applied in the upper part while NSGA-II, SPEA2 or MOEA/D was used in the lower part of the population resulting in three hybrid algorithms: MOPSO-NSGA II, MOPSO-SPEA2, MOPSO-MOEA/D. The simulation was performed on the IEEE-123 Node Test Feeder system using the OpenDSS and MATLAB environment. The performance of the proposed algorithms was compared according to their computation time and performance metrics such as pure diversity, generational distance and spacing. It was found that the hybrid algorithms enhance the convergence of the solutions to the true Pareto front. Combining SPEA2 or MOEA/D with MOPSO also reduced the complexity of the algorithms resulting in a lower simulation time.
1. Introduction
The traditional distribution system is radial in nature. It is fed from the main substations via the transmission network. Due to the large resistance/reactance ratio in the distribution system, the voltage drops and power losses increase. Under extreme conditions, the distribution system may be subjected to instantaneous voltage collapse resulting from poor voltage stability at most nodes. Therefore, emerging power systems are integrated with small power generating units close to the loads. These units are commonly known as distributed generation or dispersed generation (DG) [1]. To account for the depleting nature of fossil fuels and their negative impacts on the environment, DG units based on renewable energy are being favoured. Examples of such DG units include wind turbine, solar photovoltaic (PV), fuel cell, microturbine and micro-hydro generator. However, the intermittent nature of the renewable energy sources leads to fluctuations in the power output of these DG units. Also, the bidirectional power flow may affect the coordination of the protective devices [2].
Due to the deregulation in the electricity industry, it is important to ensure the reliability of the distribution system [3]. This can be achieved by modernising or substituting the current distribution lines, transformers, switchgears and other electrical components. Alternatively, spare equipment can be made available. As these solutions require large capital investments, distribution network reconfiguration (DNR) has gained much interest among utilities. It involves the opening and closing of switches in the distribution system to alter the structure of the distribution system [4]. In addition to DNR, power electronic devices called custom power devices (CPD) can be integrated in the distribution system. CPD such as distribution static compensator (DSTATCOM), dynamic voltage restorer (DVR) and unified power quality conditioner (UPQC) help to enhance the power quality issues such as voltage sags, voltage swells and harmonics generation [5]. While DVR can address a maximum of two power quality problems, UPQC has the ability of considering several power-related issues simultaneously. It aids in load balancing, harmonics eradication, voltage sag reduction and power quality enhancement [6].
Optimisation is needed to identify the most appropriate parameters of the DG unit, CPD and DNR. To ensure the best performance of the power system, it is expected to consider the maximum number of objective functions. As the formulated problem involves more than one objective function, it is known as a multi-objective problem. In contrast to single-objective optimisation, multi-objective optimisation generates a set of solutions called Pareto-optimal solutions or non-dominated solutions [7].
To assist engineers and power system operators in the proper planning of the future power system, various research works have been performed using multi-objective optimisation. The state-of-the-art reveals that meta-heuristic algorithms are favoured over analytical and classical techniques of DG optimisation. The optimal size and location of DG units have been identified considering technical, economic and environmental factors. The technical aspects considered are mainly power loss, short circuit current and voltage stability. The economic factors were based on net present cost, annual worth, life cycle cost and levelized cost of energy. The environmental considerations were related to the emissions of carbon dioxide, oxides of nitrogen and sulfur dioxide [2]. Some studies used weighed sum approach to combine the objective functions to a single objective [3], [8]. Examples of meta-heuristic algorithms used to identify the optimal sizing and location of DG units include ant lion optimization technique [9], PSO, genetic algorithm, bacterial foraging algorithm and cat swarm optimisation, grey wolf algorithm (GWO), krill herd algorithm, invasive weed optimisation [2]. Particle swarm optimisation (PSO) has also been hybridised with modified gravitational search algorithm [8] and analytical method [10], grey wolf optimisation [11] and fuzzy systems [12]. The optimisation was performed considering power loss, voltage deviation, voltage stability and reliability [8].
The CPD used in the optimisation studies were mainly UPQC and DSTATCOM. Multi-objective particle swarm optimisation (MOPSO) [13], cuckoo optimisation algorithm (COA) [6], GWO [13] and sine cosine approach [14] were employed. The objective functions include power quality, power loss [15] and voltage stability [15]. Reference [16] used SPEA2-MOPSO for the allocation of photovoltaic-integrated UPQC. Reference [17] and reference [18] further proposed the simultaneous location of DG and DSTATCOM.
The algorithms used in the optimisation of DNR includes genetic algorithm (GA) [3], modified bacterial foraging optimisation algorithm [19] and binary cuckoo search algorithm [20]. The objective functions considered were mainly load balancing, power loss minimisation, voltage profile enhancement and reliability. Some papers combined DNR with DG allocation [21]. Reference [22] proposed DG sizing and location with simultaneous DNR to minimise real power loss using a hybrid algorithm based on binary particle swarm optimisation and shuffled frog leap algorithm. The hybrid algorithm performed better than other optimisation algorithms. The results proved that simultaneous DNR and DG optimisation reduce power loss while also enhancing the voltage profile.
Although there exist possible interactions among the network structure, DG units and CPDs in the power system, the addition of DG units and CPDs with simultaneous DNR have been barely explored. This paper is an extension of the work originally presented in the 2020 3rd International Conference on Emerging Trends in Electrical, Electronic and Communications Engineering (ELECOM) [23]. In [23], the multi-objective optimisation of PV systems and UPQC was performed with simultaneous DNR using non- dominated Sorting Genetic Algorithm-II (NSGA-II), Strength Pareto Evolutionary Algorithm-2 (SPEA2) and Multi-objective Evolutionary Algorithm based on Decomposition (MOEA/D). Three objective functions were considered namely active power loss, voltage deviation and total cost liable to constraints. The optimisation was performed using the following seven different cases: (1) DNR only, (2) UPQC only, (3) PV systems only, (4) UPQC and PV systems, (5) UPQC and DNR, (6) PV systems and DNR, (7) UPQC, PV systems and DNR. It was found that the most desirable solution was obtained in case 7 whereby the voltage and power loss profile were improved at a low cost. Each of the proposed optimisation algorithms proved to have their own advantages and disadvantages. However, the possibility of hybridising the optimisation algorithms was not attempted. To account for the limitations and promote the benefits of the individual algorithms, this paper aims to identify the optimum size and location of PV systems and UPQC along with the optimum network structure using hybrid algorithms. The population is divided into two parts to reduce the risk of premature convergence. To prevent global solutions from being caught in local minima, the proposed algorithms must compromise with the exploitation and exploration. NSGA-II was utilised in the exploration phase using the upper half of the population to identify the global solutions. On the other hand, MOPSO was applied to the remaining population for the exploitation phase so that the particles in the neighbourhood converge towards a global solution. NSGA-II and MOPSO were chosen due to their different search mechanisms. Keeping MOPSO to exploit the search space, the simulation was repeated by replacing NSGA-II by SPEA2 and MOEA/D in the exploitation process.
The main contributions of the paper are as follows:
- The novelty of this paper is the multi-objective optimisation of DG units, CPD and DNR simultaneously. Although CPD and DNR can help to address the challenge of integrating renewable DG units in unbalanced distribution systems, optimisation is required to satisfy the economic and technical constraints. The most appropriate network structure as well as the size and location of the DG units and CPD must be identified to improve the efficiency of the power system at reduced cost.
- With reference to the No Free Lunch theorem [24], there is always the chance of developing novel algorithms for solving optimisation problems. Furthermore, the literature review revealed that there is scope for proposing new hybrid multi-objective algorithms. Therefore, the authors employed three hybrid algorithms namely NSGAII-MOPSO, SPEA2-MOPSO and MOEA/D-MOPSO to solve the problem. In each of the hybrid algorithm, the population was divided into two parts. MOPSO was used in the exploitation of the upper half of the population. NSGA-II, SPEA2 and MOEA/D were applied for the exploration of the lower half of the population in NSGAII-MOPSO, SPEA2-MOPSO and MOEA/D-MOPSO respectively.
- The performance of the algorithms was evaluated based on the computation time and performance metrics such as pure diversity, spacing and generational distance. The variation in the number of non-dominated solutions in the external repository at the MOPSO stage and in the Pareto front at the final stage is plotted. In addition, the Pareto front was plotted to provide a visual interpretation of the three objective functions for each of the non-dominated solution.
The paper is organised as follows: Section 2 describes the optimisation algorithms. Section 3 deals with the methodology. Section 4 highlights the results obtained while section 5 provides the conclusion.
2. Literature review
2.1. Multi-objective optimisation
It is desired to have a power system which can satisfy the consumers’ demand while optimising the technical, economic and environmental factors simultaneously. Therefore, power system optimisation problems are multi-objective in nature. A multi-objective optimisation problem simultaneously considers several objective functions subject to equality and inequality constraints in a suitable region D as illustrated in (1). The objective functions can either be maximised or minimised.
$$\text{Optimise } f(x) = \{f_1(x), f_2(x), \ldots, f_m(x)\},\ x \in D$$
$$\text{Subject to } g_j(x) \leq 0\ ;\ j = 1, 2, \ldots, n$$
$$h_l(x) = 0\ ;\ l = 1, 2, \ldots, e\tag{1}$$
where f(x) is the objective functions’ vector, m is the total number of objective functions, n is the number of inequality constraints and e is the number of equality constraints.
2.1.1. Multi-objective Particle Swarm Optimisation (MOPSO)
Particle Swarm Optimization (PSO) is an algorithm which mimics the conduct of birds and insects in their hunt for food or new places for habitation. It is based on a population in which each member moves in its own direction and velocity looking for a suitable place in the search space. All the members are in contact with each other to transfer data so the population is directed to the good locations in the search space. Each member indicates a particular solution and its position is upgraded in relation to its memory of the good locations (the local best) or the memory of the whole swarm. PSO was initially proposed to solve single-objective problem. Later, multi-objective particle swarm optimisation (MOPSO) was developed. The limitations of MOPSO include the formation of local fronts and the poor diversity in the Pareto front [25].
Algorithm 1: MOPSO | |||||||||||
Result: Swarm fitness calculation and determination of global best member | |||||||||||
Initialization of position and velocity for each particle in the swarm randomly; | |||||||||||
For each particle in the swarm | |||||||||||
Evaluate the fitness function | |||||||||||
If fitness of particle exceeds personal best fitness | |||||||||||
New fitness of particle = personal best fitness; | |||||||||||
End | |||||||||||
End From all particles in the population, choose the global best solution
End
| |||||||||||
2.1.2. Non-dominated Sorting Genetic Algorithm II (NSGAII)
In Non-dominated Sorting Genetic Algorithm II (NSGA-II), the members of the population are located in several fronts depending on their extent of dominance. The crowding distance of the member is then found individually. Subsequently, the member having the larger crowding distance is selected from the primary front. The process is continued for the subsequent fronts. Following the selection process, crossover and mutation operations are carried out to generate the new population.
The positive aspects of NSGA-II include elitism, non-dominated sorting and crowding distance which improves the diversity and spread of the solutions. Nonetheless, the convergence may deteriorate due to the crowding operation. As the population size increases, the simulation time increase as the population requires sorting in each generation [26].
Algorithm 2: NSGA-II | |||||
Result: Generation of Pareto front | |||||
Initialise population; Evaluate objective functions; Rank population | |||||
while maximum iteration is not reached | |||||
Perform selection, crossover and mutation to generate child population; | |||||
Evaluate each individual; Combine child and parent population; Non-dominated sorting process if maximum iteration is reached then | |||||
Generate Pareto front; | |||||
end | |||||
end | |||||
2.2. SPEA2
In SPEA2, the initial population is generated randomly and an empty external archive is created. Each member is allocated a strength value with reference to the quantity of members it dominates in the external archive. The raw fitness value R(i) of a solution is computed by summing the strengths ) of every solution which dominates it in both the archive and the population. The members are then retained by the kth nearest neighbor method according to the density D(i) as shown in (2) and (3). This conservation approach enhances the diversity of the solutions. The fitness F(i) of an individual is identified from the density D(i) and raw fitness value R(i) as indicated by (4). The nondominated solutions are collected in an exterior archive until the latter is completely filled [27].
$$\mathrm{D}(i) = \frac{1}{\sigma^{k+2}}\tag{2}$$
$$\mathbf{k} = \sqrt{N + \overline{N}}\tag{3}$$
where N is the population size and is the archive size
$$\mathbf{F}(\mathrm{i}) = \mathbf{R}(\mathrm{i}) + \mathbf{D}(\mathrm{i})\tag{4}$$
Algorithm 3: SPEA-2 | ||
Result: Identification of members of Pareto front | ||
Initialisation of initial population randomly; Creation of an empty external archive; | ||
while maximum iteration is not reached | ||
Calculate fitness value of each individual; Copy all non-dominated solutions to external archive; Compute fitness value of each solution; Conserve the solutions based on KNN method; Perform selection, crossover and mutation; | ||
end | ||
2.2.1. MOEA/D
In MOEA/D, the multi-objective problem is split into several single-objective small problems. The commonly-used decomposition techniques are the Tchebycheff technique and the weighed sum technique. The subproblems are then accumulated by the predefined weights. Finally, they are optimised simultaneously using evolutionary algorithms. The population is initialised randomly and the objective function value is computed accordingly. To generate a new member in the population, two parents are chosen indiscriminately from the surrounding. The information is transmitted based on the relationship among the neighbours. The neighbourhood mechanism used in MOEA/D enhances the convergence of the algorithm. However, the size of the neighbourhood must be selected properly to prevent the search from attaining local minima without causing any complexity burden [28].
2.2.2. Hybrid algorithms
MOPSO has a remarkable exploitation capability. However, the particles in MOPSO tend to be confined to local optima. This issue can be addressed by using MOPSO together with NSGA-II, SPEA2 or MOEA/D. This results in three hybrid algorithms namely MOPSO-NSGA-II, MOPSO-SPEA2 and MOPSO-MOEA/D. The population is divided into two parts. Half of the population is solved using NSGA-II, SPEA2 or MOEA/D to generate solutions. Due to its elitism, sorting and crowding distance computation, NSGA-II produces solutions with a wide spread and diversity. MOPSO then exploits the search place to identify better solutions in the surrounding driving the low-rank solutions to the global optimum.
The optimal solutions in NSGA-II, SPEA2 or MOEA/D are stored in an external archive whereas those in MOPSO are stored in an external repository. After each iteration, the solutions in the archive are merged with that of the repository and eventually kept in the archive [29].
2.3. Test system
2.3.1. The Distribution system
The simulation was carried out using the IEEE-123 Node Test Feeder System which is an unbalanced distribution system consisting of constant power, constant impedance and constant current loads. Figure 1 shows the IEEE-123 Node Test Feeder System. The distribution system, DG units and custom power devices were modelled by separate scripts in the Electric Power Research Institute’s (EPRI) open-source software ‘Distribution System Simulator’ (OpenDSS). The PV system and the UPQC were used as DG units and CPD respectively. Monte Carlo Simulation was done to cater for the uncertainty in the weather data [30].
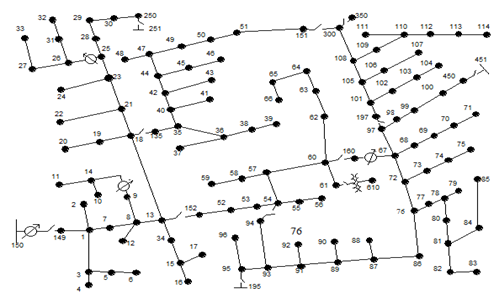
Table 1: Switches in IEEE-123 node test feeder system [31]
Switch | Node A | Node B | Status |
Switch 1 | 13 | 152 | closed |
Switch 2 | 18 | 135 | closed |
Switch 3 | 60 | 160 | closed |
Switch 4 | 97 | 197 | closed |
Switch 5 | 151 | 300 | open |
Switch 6 | 54 | 94 | open |
Switch 7 | 150 | 149 | closed |
Switch 8 | 61 | 610 | closed |
Switch 9 | 250 | 251 | open |
Switch 10 | 450 | 451 | open |
Switch 11 | 300 | 350 | open |
Table 1 illustrates the location and status of all the switches in the IEEE-123 Node Test Feeder System. From Figure 1 and Table I, it can be deduced that only six switches (Switch 1 – Switch 6) can modify the network structure. From the switches utilised, three loops namely L1, L2 and L3 can be obtained. L1 is arises from the closure of switches Switch 1, Switch 2, Switch 3, Switch 4 and Switch 5 whereas L2 is formed by closing Switch 1, Switch 2, Switch 4, Switch 5 and Switch 6. Meanwhile, L3 results from the opening of all the switches except Switch 3 and Switch 6. To maintain a radial network structure, one switch must be in the open state in each loop. Radial configuration is important for the proper management and protection of the system. 1. From the 64 possible switch combinations, only the 48 combinations which generated a radial network structure were used in the simulation [23].
2.3.2. PV system
The PV system contains semiconductor materials which convert solar energy to electrical energy. Figure 2 illustrates the PV system model. The active power output in the connection node at time t is obtained by multiplying the PV array output P(t)and the inverter efficiency as shown by (5).
$$P_{out}(t) = P(t) \times eff(P(t))\tag{5}$$
For simplicity, it is supposed that the inverter locates the maximum power point (MPPT) of the panel rapidly. Equation (6) represents P(t) in terms of the rated power output at MPPT (Pmpp), the base irradiance irradbase, the per unit irradiance at t irrad(t)and the correction factor (c).
$$P(t) = P_{mpp} \times irrad(t) \times irrad_{Base} \times c\tag{6}$$
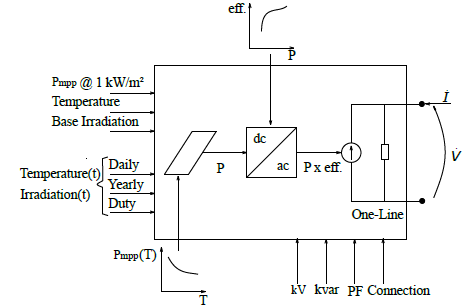
The PV array is designed using the irradiance data, temperature data and the PV array power curve while the inverter is designed using the efficiency curve as illustrated in Figure 2 [32].
2.3.3. Unified power quality conditioner
UPQC is a single-phase device which manages the voltage and reactive power. It is added on the secondary side of a transformer and can function in three modes namely mode 1 (voltage control), mode 2 (power factor correction) and mode 3 (voltage control and power factor correction). Fig. 3 illustrates the model of UPQC in OpenDSS.
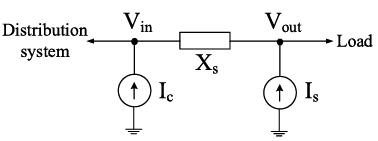
The current source Ic is calculated using (7).
$$I_c = \frac{V_{out}}{I_S \times V_{in}}\tag{7}$$
where the impedance Xs and the current source Is represent the Thevenin equivalent of the voltage source in series [33].
3. Methodology
3.1. Formulation of the problem
Operating the power system at minimum cost results in poor voltage and power loss profile. On the other hand, it is too expensive to only enhance the quality of the power supply. Therefore, the problem was formulated as multi-objective based on three objective functions namely the active power loss, voltage deviation and total cost. The objective functions were minimised simultaneously taking into account the uncertainty associated with DG units based on renewable energy.
3.1.1. Objective functions
- Active power loss
Minimisation of the active power loss helps to make the system more efficient. Active power loss includes the copper loss of the transformers and the loss in the lines [34]. In OpenDSS, it is computed by solving the circuit in the snapshot mode.
- Voltage deviation
The voltage deviation is minimised to enhance the security and power quality in the system. The voltage deviation index (IVD) was computed by comparing the final node voltages with initial node voltages as shown in (8). The node voltages were found by the load flow analysis in OpenDSS [35].
$$\text{IVD} = \sum |V_{AD} – V_A| + \sum |V_{BD} – V_B| + \sum |V_{CD} – V_C|\tag{8}$$
where VA, VB and VC are the initial node voltages,
VAD, VBD and VCD are the node voltages in the presence of PV systems
- Total cost
The total cost is equivalent to the sum of the capital cost and the replacement cost. The capital cost is computed from the net present cost (NPC) and the capital recovery factor (CRF) using (9) and (10) [36].
$$\text{Capital cost} = \text{NPC} \times \text{CRF}\tag{9}$$
$$\quad \text{CRF} = \frac{i(i+1)^L}{(i+1)^L – 1}\tag{10}$$
Table 2 illustrates the NPC and the lifespan for the PV system, switch and UPQC [37] [38].
Table 2: Net present value and lifespan of each device
Device | NPC (USD) | Lifetime |
PV | 1330 /kW | 25 |
Switch | 2581 | 15 |
UPQC | 15 |
The NPC for the UPQC is found from the polynomial cost function given by (11) and the size of the UPQC (SUPQC) [39].
$$\text{NPC}_{UPQC} = 0.0003S_{UPQC}^2 – 0.2691S_{UPQC} + 188.22\tag{11}$$
The Fisher equation calculates the real interest rate (i) using the nominal interest rate (j) and the inflation rate (f) as shown by (12).
$$i = \frac{j – f}{1 + f}\tag{12}$$
The nominal interest rate and inflation rate are set to 3.5% and 1.5% respectively in this study. The replacement cost is calculated based on (13) [38][40].
$$\text{Annualised replacement cost} = \text{NPC} \cdot \frac{i}{(1+i)^L – 1}\tag{13}$$
3.1.2. Constraints
The power flow constraint was utilized as equality constraint. As the power flow calculations were integrated in the procedure to calculate the total feeder losses, the satisfaction of this constraint was not checked. The convergence of the power flow computation revealed that the equality constraint was satisfied [41]. The size and number of the DG units and CPD were used as inequality constraints.
- The size of the DG unit lies between 5 kW and 500 kW as given by (14).
$$5\,\text{kW} < DG_{size} < 500\,\text{kW}\tag{14}$$
- The size of the UPQC ranges from 5 kVAr to 100 kVAr as shown in (15).
$$5\,\text{kVAr} < CPD_{size} < 100\,\text{kVAr}\tag{15}$$
3.2. Optimization algorithm
3.2.1. Chromosome model
OpenDSS was linked with MATLAB through the Component Object Model (COM) server Dynamic-link library (DLL) for optimisation studies. A compatible PC (CPU Intel Pentium 2.10 GHz 2GB of RAM) with 32-bit operating system was used for the simulation. The optimization algorithms depend on a group of artificial chromosomes which are assigned fitness values depending on their capability to solve the problem. Each chromosome is a potential solution to the problem. Figure 4 shows the chromosome model in which the first two numbers in the string refers to the size and location of the first DG unit respectively. The following two numbers indicate the size and location of the first CPD respectively. The letter n denotes the total number of DG units and CPD used. In this case, n has been set to three. The last number in the string denotes the network structure based on switch SW1 to SW6.

3.2.2. Parameters of optimization algorithm
Table 3 illustrates the parameters of the optimisation algorithms. The parameters were kept constant for all the three algorithms. To account for the heuristic nature of the optimisation algorithms, the simulation was performed over 50 independent runs by using varying random number seeds for each run. Each run consisted of 100 iterations to guarantee the convergence of the algorithms. The population size, crossover probability and mutation probability were chosen by a trial-and-error method such that a reasonable number of solutions were found without increasing the complexity of the algorithms.
Table 3: Parameters of optimisation algorithms
Number of members in population | 50 |
Probability of crossover | 0.3 |
Probability of mutation | 0.05 |
Maximum iteration number | 100 |
Number of runs | 50 |
3.3. Performance metrics
The efficiency of the algorithms was evaluated using the performance metrics such as pure diversity, spacing and generational distance.
1) Pure Diversity (PD)
Pure diversity indicates the spread and uniform spacing of the non-dominated solutions in the objective space. It is calculated utilising (16).
$$\text{PD} = d_p + d_q + \sqrt{\frac{1}{|n|-1} \sum_{i=1}^{|n|-1} (d_i – \bar{d})^2}\tag{16}$$
where dp and dq represents distances between the nearest non-dominated solutions and the two extreme solutions on the Pareto front, di is the Euclidean distance between two succeeding non-dominated solutions and is the mean of the distances di and n is the sum of the number of non-dominated solutions [42].
2) Spacing (SP)
Spacing indicates the standard deviation of the distance between the non-dominated solutions in the Pareto front and is given by (17). A spacing of zero is obtained when all the solutions in the Pareto front are equally spaced.
$$\text{SP} = \sqrt{ \frac{1}{n-1} \sum_{i=1}^{n} (\bar{d} – d_i)^2 }\tag{17}$$
3) Generational distance (GD)
Generational distance shows the smallest Euclidean distance di from all the vectors in the Pareto front to any vector in the reference Pareto front. It is calculated using (18) [43].
$$\text{GD} = \sqrt{ \frac{ \sum_{i=1}^{n} d_i^2 }{n} }\tag{18}$$
3.4. Technique for Order of Preference by Similarity to Ideal Solution (TOPSIS)
TOPSIS is a decision-making approach proposed by Yoon and Hwang in 1980. It evaluates each alternative according to its Euclidean distance from the best and worst solutions. The decision matrix (R) is constructed using the normalised performance ratings as shown by (19).
$$\text{R} = \begin{bmatrix} r_{11} & r_{12} & \cdots & r_{1n} \\ r_{21} & r_{22} & \cdots & r_{2n} \\ \vdots & \vdots & \vdots & \vdots \\ r_{m1} & r_{m2} & \cdots & r_{mn} \end{bmatrix}
\tag{19}$$
The weight of the attributes (wj) is then associated with the normalised performance ratings (rij) using (20) to form the weighed normalized preference ratings (vij).
$$\mathbf{v}_{ij} = \mathbf{w}_j \times \mathbf{r}_{ij}\tag{20}$$
The weighed normalised decision matrix V is then constructed as shown by (21).
$$\mathbf{V} = \begin{bmatrix} \mathbf{v}_{11} & \mathbf{v}_{12} & \cdots & \mathbf{v}_{1n} \\ \mathbf{v}_{21} & \mathbf{v}_{22} & \cdots & \mathbf{v}_{2n} \\ \vdots & \vdots & \vdots & \vdots \\ \mathbf{v}_{m1} & \mathbf{v}_{m2} & \cdots & \mathbf{v}_{mn} \end{bmatrix}
\tag{21}$$
The positive-ideal (A+) and negative-ideal (A–) solutions are then identified by computing the maximum and minimum of the weighed normalized values using (22) to (25).
$$A^{+} = \{ \mathbf{v}_1^{+}, \mathbf{v}_2^{+}, \ldots, \mathbf{v}_n^{+} \}\tag{22}$$
$$A^{-} = \{ \mathbf{v}_1^{-}, \mathbf{v}_2^{-}, \ldots, \mathbf{v}_n^{-} \}\tag{23}$$
$$\mathbf{v}_j^{+} = \max \mathbf{v}_{ij}\tag{24}$$
$$\mathbf{v}_j^{-} = \min \mathbf{v}_{ij}\tag{25}$$
where i = 1,2,…….,m and j = 1,2,……,n
Si+ and Si– shows the distance of each alternative from the positive-ideal and negative-ideal solution respectively. They are found from equations (26) and (27).
$$\mathbf{S}_i^{+} = \sqrt{ \sum_{j=1}^{n} (\mathbf{v}_{ij} – \mathbf{v}_j^{+})^2 }\tag{26}$$
$$\mathbf{S}_i^{-} = \sqrt{ \sum_{j=1}^{n} (\mathbf{v}_{ij} – \mathbf{v}_j^{-})^2 }\tag{27}$$
The preference for each alternative, Pi is calculated using equation (28).
$$\mathbf{P}_i = \frac{\mathbf{S}_i^{-}}{\mathbf{S}_i^{+} + \mathbf{S}_i^{-}}\tag{28}$$
The alternatives are ranked in descending order of the value of the preference [44].
4. Results
Figures 5 to 7 show the number of non-dominated solutions stored in the external repository used by the MOPSO section in the NSGAII-MOPSO, MOEA/D-MOPSO and SPEA2-MOPSO respectively. It was found that the repository was never full after the application of MOPSO. In NSGAII-MOPSO, the maximum number of non-dominated solutions identified in the lower portion of the population was 18 at iteration number 29 and 85. It amounts to 30 in MOEA/D-MOPSO and occurred at iteration number 72. For SPEA2-MOPSO, the number of non-dominated solutions in the repository reached a peak of 29 at iteration 14.
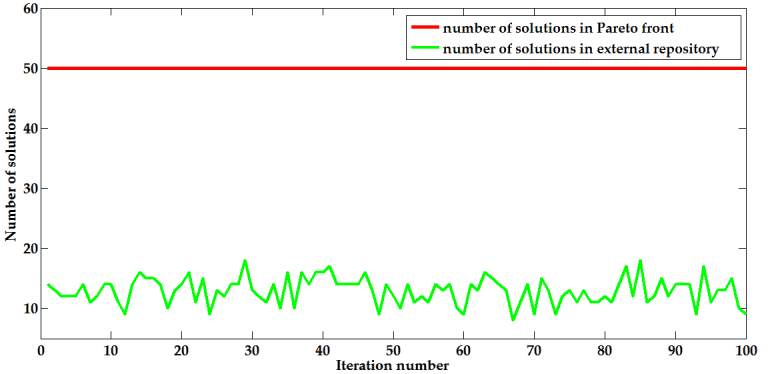
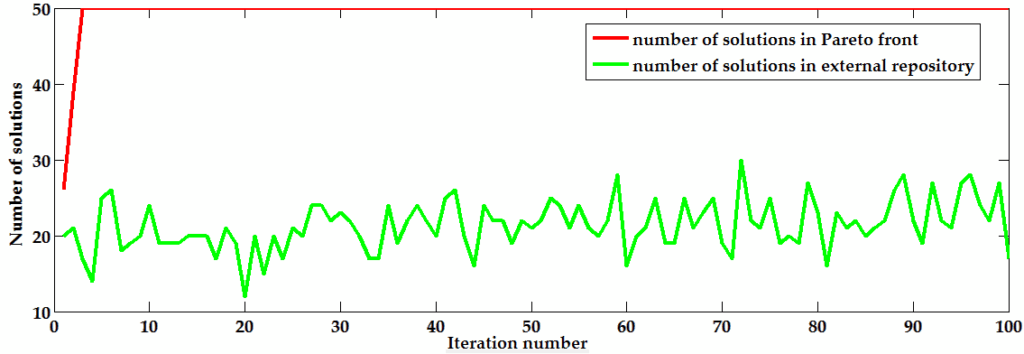
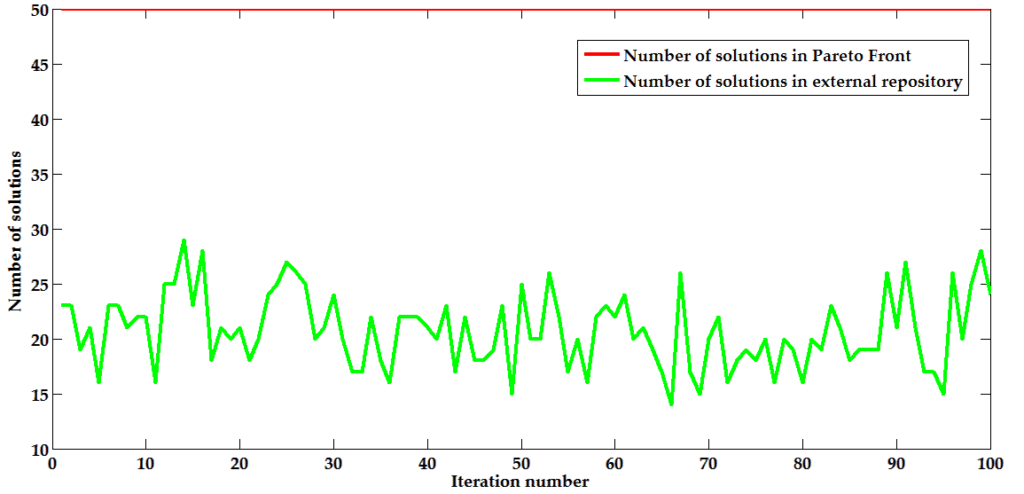
Figures 5 to 7 also reveal the number of non-dominated solutions located in the Pareto front of in the NSGAII-MOPSO, MOEA/D-MOPSO and SPEA2-MOPSO respectively. The maximum allowable number of solutions in the Pareto front was 50. If the number of non-dominated solutions in the front exceeded 50, they were ranked so that only the first 50 solutions were kept. For NSGAII-MOPSO and SPEA2-MOPSO, it was found that the number of solutions in the Pareto front remained constant throughout the 100 iterations. In MOEA/D-MOPSO, the number of solutions in the Pareto front changed in the first two iterations. It then stabilised to 50 for the remaining iterations. The Pareto front was completely filled quickly due to the small size of the search space. It can be inferred that all the 50 solutions identified by NSGA-II, SPEA2 and MOEA/D from the upper half portion of the population in their respective hybrid algorithm dominates the solutions identified by MOPSO in the lower half section of the population.
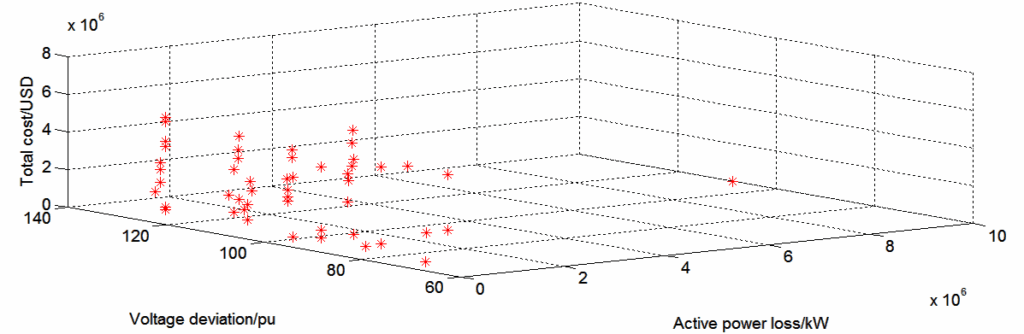
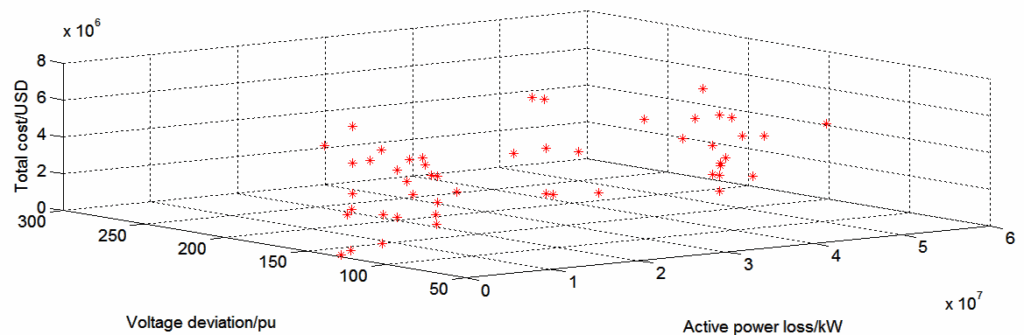
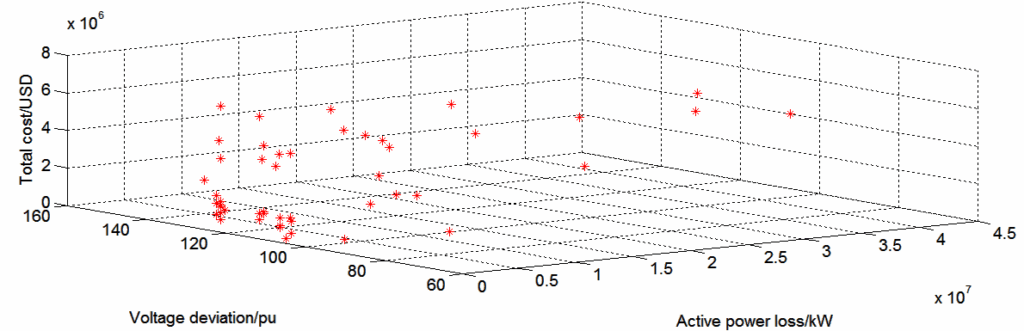
Figure 8 to Figure 10 illustrates the solutions in the search space of the hybrid algorithms at the start of the MOPSO stage. It can be observed that the search space is quite small. This explains why the Pareto front was rapidly filled. Figure 8 to Figure 10 also reveals the great exploration capability of NSGAII, SPEA2 and MOEA/D. These algorithms produce a diversity of solutions which are used by MOPSO during the exploitation phase.
Figure 11 to Figure 13 shows the three-dimensional surface plot superimposed on the scatter plot generated by SPEA2-MOPSO, NSGAII-MOPSO and MOEA/D-MOPSO respectively. The figures illustrate the compromise among the three objective functions. There is no solution which generates the best value for all the three objective functions. It is up to the engineers to choose the solution depending on the needs of the power system at that time.
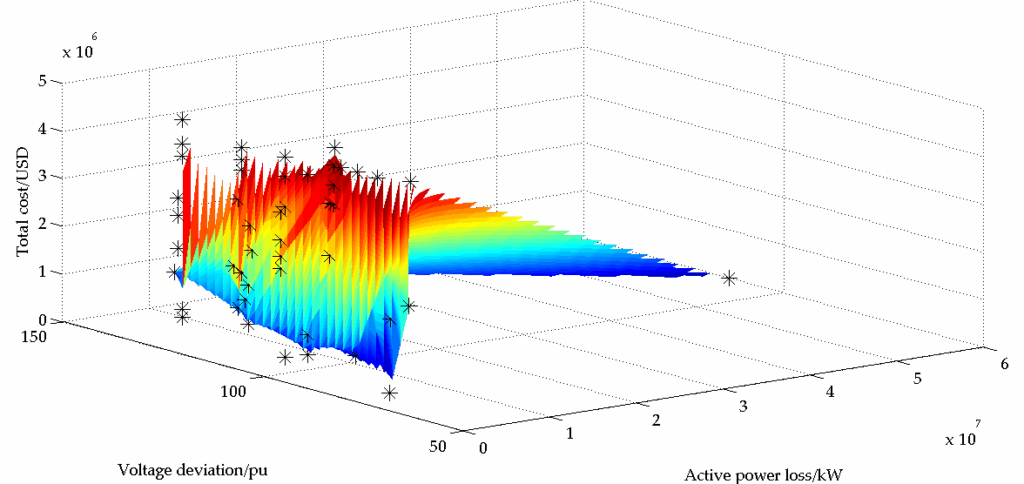
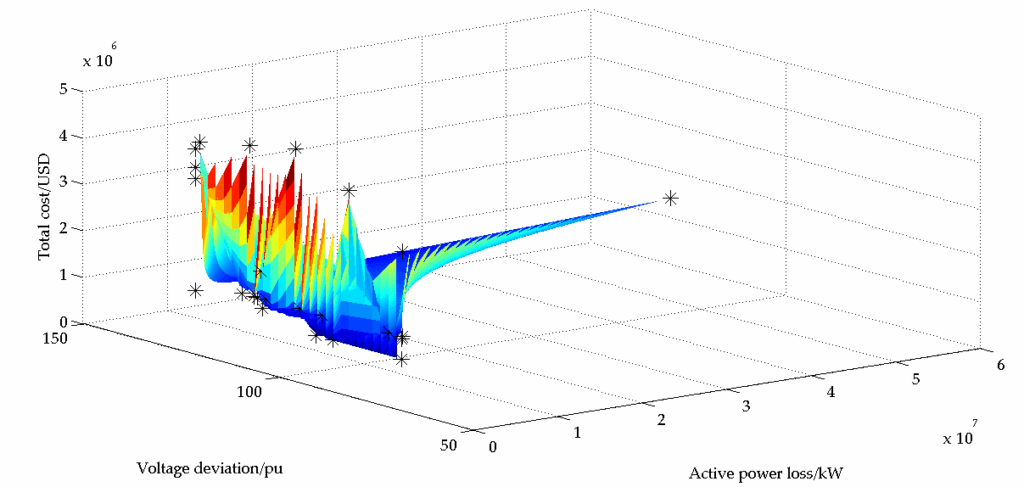
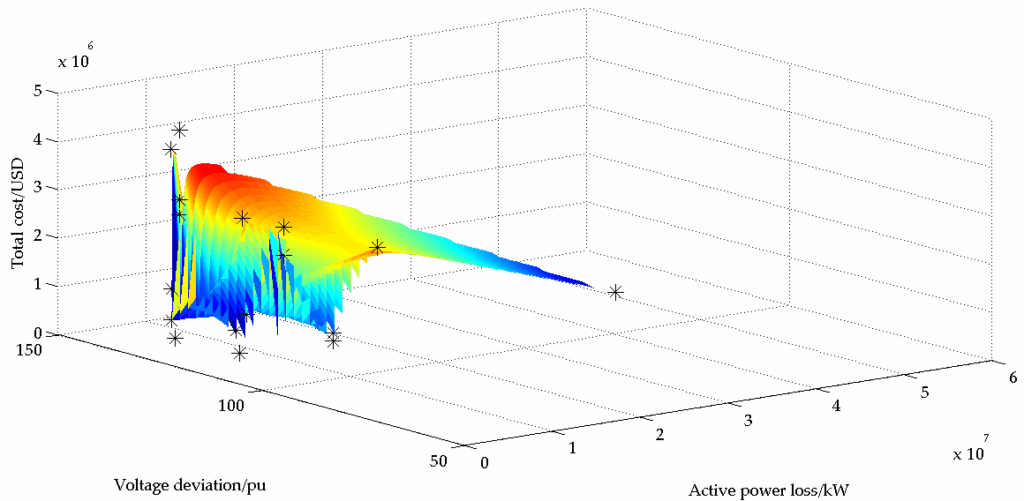
Table 4 illustrates the best compromise solution produced by NSGA-II. It shows the optimal size and location of the three PV systems and UPQC as well as the optimal status of the six switches. As no solution in the Pareto front minimises the three objective functions simultaneously, TOPSIS was used to identify the optimal solutions. Equal importance was given to each objective function.
Table 4: Best compromise solution produced by NSGA-II
PV sizes | 47 kW, 25 kW, 83 kW |
PV locations | node 24, node 46, node 76 |
UPQC sizes | 9 kVAr, 85 kVAr, 100 kVAr |
UPQC locations | node 83, node 110, node 4 |
Status of switch SW1 to SW6 | open, open, closed, closed, closed, open |
Table 5 shows the mean simulation time for all the algorithms used. NSGA-II is the fastest algorithm as it computes the crowding distance of each solution objective-wise and then adds them to find the overall crowding distance. On the other hand, SPEA2 computes all the Euclidean distances in the objective space, generates clusters and then calculates the distance between consecutive clusters. MOEA/D has a lower mean simulation time than SPEA2 because each sub-problem in MOEA/D is solved using information from the neighbouring sub-problems only. NSGAII-MOPSO has a larger simulation time than NSGAII. This may be due to the fact that hybridization increases the memory requirement of the algorithm. SPEA2-MOPSO and MOEA/D-MOPSO have an average simulation time which is 49 % and 55 % less than that of SPEA2 and MOEA/D respectively. Therefore, MOPSO helps to accelerate the optimal solutions produced by SPEA2 and MOEA/D to particular search space regions.
Table 5: Mean simulation time of the different algorithms
Algorithm | Mean simulation time/s |
NSGA-II | 2 795 |
SPEA2 | 24 943 |
MOEA/D | 20 222 |
NSGAII-MOPSO | 6613 |
SPEA2-MOPSO | 12 684 |
MOEA/D-MOPSO | 9 010 |
Table 6: Minimum value of active power loss, voltage deviation and total cost produced by each algorithm
Algorithm | Active power loss/ kW | Voltage deviation/ pu | Total cost/ USD |
NSGA-II | 2252.5 | 63.22 | 80 394 |
SPEA2 | 2310.7 | 63.29 | 83 289 |
MOEA/D | 2308.2 | 63.44 | 139 700 |
NSGAII-MOPSO | 2394.4 | 63.33 | 103 160 |
SPEA2-MOPSO | 4214.3 | 68.20 | 108 630 |
MOEA/D-MOPSO | 3728.4 | 71.58 | 185 490 |
Table 6 shows the minimum values obtained by the optimisation algorithms for each objective functions. It was found that NSGA-II produced the lowest value for all the objective functions (shown in bold). However, the data in Table 6 is not enough to evaluate the performance of the optimisation algorithms. Due to the stochastic nature of the latter, it is vital to find the statistical significance of the obtained solutions. The quality of the results can be determined from the convergence and diversity of the optimal solutions.
Table 7: Mean value of the performance metrics for the different algorithms
Algorithm | SP | PD | GD |
NSGA-II | 0.2480 | 6.3461 | 0.0900 |
SPEA2 | 0.2104 | 4.9366 | 0.0842 |
MOEA/D | 0.3336 | 5.9259 | 0.0954 |
NSGAII-MOPSO | 0.3841 | 4.1899 | 0.0838 |
SPEA2-MOPSO | 0.3295 | 4.7661 | 0.0733 |
MOEA/D-MOPSO | 0.3374 | 4.4552 | 0.0746 |
Table 7 showcases the performance metrics for the different optimisation algorithms. As the data was of different orders of magnitude, it was normalised before the computation of these metrics. It was observed that the hybrid algorithms improve the generational distance metrics. The lowest mean GD was produced by SPEA2-MOPSO. The average SP value for all three hybrid algorithms was close to zero indicating that the neighbouring solutions were almost evenly arranged. The GD values are reduced by nearly 6.9 %, 12.9 % and 21.8 % in NSGAII-MOPSO, SPEA2-MOPSO and MOEA/D-MOPSO respectively relative to their corresponding non-hybrid algorithms. This reveals that the Pareto front generated by the hybrid algorithms is closer to the true Pareto front. This may be due to the local search performed by MOPSO in the hybrid algorithms. The high PD values in the results generated by NSGA-II indicate that the solutions were more scattered. The diversity in the results produced by all the three hybrid algorithms was almost similar. However, it was less than that of the non-hybrid algorithms.
5. Conclusion
The integration of renewable DG units in the distribution system poses several technical challenges. The use of UPQC and DNR are potential solutions to the problem. Thus, multi-objective optimisation is needed to boost the efficiency of the power system at reduced costs. The novelty of this research is the multi-objective optimisation of PV systems, UPQC and DNR simultaneously using MOEA/D, NSGAII and SPEA2. These optimisation algorithms were further combined with MOPSO resulting in three hybrid algorithms namely NSGA-II- MOPSO, SPEA2-MOPSO and MOEA/D-MOPSO. The hybrid algorithms produced solutions with better spacing and generational distance metrics at the cost of a degradation in the diversity of the solutions. In addition, hybridizing SPEA2 or MOEA/D with MOPSO helps to reduce the simulation time. Using TOPSIS, the optimal network structures as well as the optimal size of the PV systems and UPQCs were found.
This research produces insightful findings so that policy makers and engineers can introduce new incentives and regulatory measures. It shows that hybridisation of multi-objective optimisation algorithm is promising. Future works may include techniques to improve the diversity of the solutions generated by hybrid algorithms. Also, the multi-objective optimisation based on a larger number of objective functions may be investigated. The effect of varying the population size, repository size, crossover parameter and mutation parameter can also be analysed.
Conflict of Interest
The authors declare no conflict of interest.
Acknowledgment
This research was partly funded by the Mauritius Research and Innovation Council under the MRC Post- Graduate Award Scheme.
- S. Sharma, K. R. Niazi, K. Verma, T. Rawat, “Coordination of different DGs, BESS and demand response for multi-objective optmisation of distribution network with special reference to Indian power sector, ” Electrical Power and Energy Systems, vol 121, pp. 1-10, 2020, doi: 10.1016/j.ijepes.2020.106074
- W. L. Theo, J. S. Lim, W. S. Ho, H. Hashim, C. T. Lee, “Review of distributed generation (DG) planning and optimisation techniques: Comparison of numerical and mathematical modelling methods,” Renewable and Sustainable Energy Reviews, vol. 67, pp. 531-573, 2017, doi: 10.1016/j.rser.2016.09.063
- N. Gupta, A. Swarnkar, K. R. Niazi, “Distribution network reconfiguration for power quality and reliability improvement using genetic algorithms,” Electrical Power and Energy Systems, vol. 54, pp. 664-671, 2014, doi: 10.1016/j.ijepes.2013.08.016.
- M. Abdelaziz, “Distribution network reconfiguration using a genetic algorithm with varying population size,”Electric Power Systems Research, vol. 142, pp. 9-11, 2017, doi: 10.1016/j.epsr.2016.08.026
- N. D. Kareila,”Distributed generation and role of UPQC-DG in meeting power quality criteria-a review,” Procedia Technology 21, pp. 520-525, 2015, doi: 10.1016/j.protcy.2015.10.042
- J. Sarker, S. K. Goswami,”Optimal location of unified power quality conditioner in distribution system for power quality improvement,” International Journal of Electrical Power & Energy Systems, vol. 83, pp. 309-324, 2016, doi: 10.1016/j.ijepes.2016.04.007
- Q. Qi, J. Wu, C. Long, “Multi-objective operation optimization of an electrical distribution network with soft open point,” Applied energy, vol. 208, pp. 734-744, 2017, doi: 10.1016/j.apenergy.2017.09.075
- A. Eid, ”Allocation of distributed generations in radial distribution systems using adaptive PSO and modified GSA multi-objective optimizations,” Alexandria Engineering Journal, vol. 59, pp. 4771-4786, 2020, doi: 10.1016/j.aej.2020.08.04
- M. J. Hadidian-Moghaddam, ”A multi-objective optimal sizing and siting of distributed generation using ant lion optimization technique,” Ain Shams Engineering Journal, vol. 9, pp. 2101-2109, 2018, doi: 10.1016/j.asej.2017.03.001
- S. M. Arif, “Analytical hybrid particle swarm optimisation algorithm for optimal siting and sizing of distributed generation in smart grid,” Journal of Modern Power Systems and Clean Energy, vol. 8, no. 6, pp. 1221-1230, 2020, doi: 10.35833/MPCE.2019.000143
- M. I. Akbar, S. A. A. Kazmi, O. Alrumayh, Z. A. Khan, A. Altamimi, M. M. Malik, “A novel hybrid optimization -based algorithm for the single and multi-objective achievement with optimal DG allocations in distribution networks,” IEEE Access, vol. 10, pp. 25669-25687, 2022, doi: 10.1109/ACCESS.2022.3155484
- S. Nagaballi, R. R. Bhosale, V. S. Kale, “A hybrid fuzzy and PSO based optimum placement and sizing of DG in radial distribution system,” 2018 International Conference on Smart Electric Drives and Power System, 12-13 June 2018, Nagpur, India, doi: 10.1109/ICSEDPS.2018.8536057
- S. Kaur, N. Kaur, “Application of optimisation techniques to mitigate voltage sag and swell by using real time values,” 2022 International Conference on Electronics and Renewable Systems (ICEARS), 16-18 March 2022, Tuticorin, India, doi: 10.1109/ICEARS53579.2022.9751971
- A. Selim, S. Kamel, F. Jurado,”Optimal allocation of distribution static compensators using a developed multi-objective sine cosine approach,” Computers & Electrical Engineering, vol. 85, pp. 1-17, 2020, doi: 10.1016/j.compeleceng.2020.106671
- S. Ganguly,” Multi-objective planning for reactive power compensation of radial distribution networks with unified power quality conditioner allocation using particle swarm optimization,” IEEE TRANSACTIONS ON POWER SYSTEMS, vol. 29, no. 4, pp. 1801-1810, 2014, doi: 10.1109/TPWRS.2013.2296938
- T. Yuvaraj, K. Ravi, “Multi-objective simultaneous DG and DSTATCOM allocation in radial distribution networks using cuckoo searching algorithm,” Alexandria Engineering Journal, vol. 57, pp. 2729-2742, 2018, doi: 10.1016/j.aej.2018.01.001
- S. Lakshmi, S. Ganguly,”Multi-objective planning for the allocation of PV-BESS integrated open UPQC for peak load shaving of radial distribution networks,” Journal of Energy Storage, vol. 22, pp. 208-218, 2019, doi: 10.1016/j.est.2019.01.011
- K. R. Devabalaji, K. Ravi, “Optimal size and siting of multiple DG and DSTATCOM in radial distribution system using bacterial foraging optimization algorithm,” Ain Shams Engineering Journal, vol. 7, pp. 959-971, 2016, doi: 10.1016/j.asej.2015.07.002
- S. Naveen, K. S. Kumar, K. Rajalakshmi, “Distribution system reconfiguration for loss minimization using modified bacterial foraging optimization algorithm,” Electrical Power and Energy Systems,” vol. 69, pp. 90-97, 2015, doi: 10.1016/j.ijepes.2014.12.090.
- T. T. Nguyen, T. T. Nguyen, B. Le, “Optimisation of electric distribution network configuration for power loss reduction based on enhanced binary cuckoo search algorithm,” Computers & Electrical Engineering, vol. 90, pp. 1-24, 2021, doi: 10.1016/j.compeleceng.2020.106893
- M. N. M. Nasir, N. M. Shahrin, Z. H. Bohari, M. F. Sulaima, M.Y. Hassan, “A Distribution Network Reconfiguration Based on PSO: Considering DGs Sizing and Allocation Evaluation for Voltage Profile Improvement,” 2014 IEEE Student Conference on Research and Development, December 16-17, pp. 1-6, doi: 10.1109/SCORED.2014.7072981
- A. S. Hassan, Y. Sun, Z. Wang, ”Multi-objective for optimal placement and sizing of DG units in reducing loss of power and enhancing voltage profile using BPSO-SFLA,” Energy Reports, vol. 6, pp. 1581-1589, 2020, doi: 10.1016/j.egyr.2020.06.013
- P. Ramsami, R. T. F. Ah King, “Multi-objective optimisation of photovoltaic systems and unified power quality conditioners with simultaneous distribution network reconfiguration,” 2020 3rd International Conference on Emerging Trends in Electrical, Electronic and Communications Engineering (ELECOM), 25-27 November 2020, Balaclava, Mauritius, doi: 10.1109/ELECOM49001.2020.9297033
- D.H. Wolpert, W.G. Macready, “No Free Lunch Theorems for Optimization,” IEEE TRANSACTIONS ON EVOLUTIONARY COMPUTATION, vol. 1, no. 1, pp. 67-82, 1997, doi: 10.1109/4235.585893
- A. Elhossini, S. Areibi, R. Dony, “Strength Pareto Particle Swarm Optimization and Hybrid EA-PSO for Multi-Objective Optimization,” Evolutionary Computation, vol.18, no. 1, pp. 127-156, 2010, doi: 10.1162/evco.2010.18.1.18105.
- K. Deb, A. Pratap, S. Agarwal, T. Meyarivan, “A Fast and Elitist Multiobjective Genetic Algorithm: NSGA-II,” IEEE Transactions on Evolutionary Computation, vol. 6, no. 2, pp. 182-197, 2002, doi: 10.1109/4235.996017
- E.Zitler, M. Laumanns, L. Thiele, “SPEA2: Improving the Strength Pareto Evolutionary Algorithm,” Swiss Federal School of Technology, Zurich, Switzerland, TIK-Report 103, 27 September 2001, doi: 10.3929/ethz-a-004284029
- Q. Zhang, H. Li. MOEA/D, “A Multiobjective Evolutionary Algorithm Based on Decomposition,” IEEE TRANSACTIONS ON EVOLUTIONARY COMPUTATION, vol. 11, no. 6, pp. 712-731, 2007, doi: 10.1109/TEVC.2007.892759
- A. Sundaram,”Combined Heat and Power Economic Emission Dispatch Using Hybrid NSGAII-MOPSO Algorithm Incorporating an Effective Constraint Handling Mechanism,” IEEE Access, vol. 8, pp. 13748-13768, 2020, doi: 10.1109/ACCESS.2020.2963887
- M. Muller, K. G. Gutbrod, C. Ramshorn, R. Vogt, “Meteoblue Weather Phoenix” [online]. Available: https://www.meteoblue.com/en/weather/forecast/week/phoenix_united-states-of-america_5308655
- Fuller, Y. Xu, “IEEE PES AMPS DSAS Test Feeder Working Group”. IEEE Power and Energy Society [online]. Available: http://sites.ieee.org/pes-testfeeders/resources/
- P. Radatz, N. Kagan, C. Rocha, J. Smith, R. C. Dugan, “Assessing Maximum DG Penetration levels in a Real Distribution Feeder by using OpenDSS,” 17th International Conference on Harmonics and Quality of Power (ICHQP), Belo Horizonte, Brazil, October 16-19, 2016, doi: 10.1109/ICHQP.2016.7783416
- H. V. Padullaparthi, P. Chirapongsananurak, S. Santoso, J. A. Taylor, “Edge-of-Grid Voltage Control: Device Modeling, Strategic Placement, and Application Considerations,” IEEE Power and Energy Technology Systems Journal, vol. 4, no. 4, pp. 106-114, 2017, doi: 10.1109/JPETS.2017.2750479
- P. Dehghanian, S. H. Hosseini, M. Moeini-Aghtaie, A. Arabali, “Optimal sizing of DG units in power systems from a probabilistic multi-objective optimization perspective,” Electrical Power and Energy Systems, vol. 51, pp. 14-26, 2013, doi: doi.org/10.1016/j.ijepes.2013.02.014
- Y. Zeng, Y. Sun, “Comparison of Multiobjective Particle Swarm Optimization and Evolutionary Algorithms for Optimal Reactive Power Dispatch Problem,” 2014 IEEE Congress on Evolutionary Computation, July 6-11, pp.258-265, 2014, doi: 10.1109/CEC.2014.6900260
- D. Thomas, O. Deblecker, C. S. Loakimidis, “Optimal design and techno-economic analysis of an autonomous small isolated microgrid aiming at high RES penetration”, Energy, vol. 116, no. 1, pp. 364-379, 2016, doi: doi.org/10.1016/j.energy.2016.09.119
- A. Chatterjee, R. Rayudu, “Techno-Economic Analysis of Hybrid Renewable Energy System for Rural Electrification in India,” 2017 IEEE Innovative Smart Grid Technologies-Asia (ISGT-Asia), Auckland, New Zeeland, December 4-7, 2017, doi: 10.1109/ISGT-Asia.2017.8378470
- C. H. Lin, C. S. Chen, H.J. Chuang, C. S. Li, M. Y. Huang, “Optimal Switching Placement for Customer Interruption Cost Minimisation” 2006 IEEE Power Engineering Society General Meeting, Montreal, Que., Canada, June 18-22, 2006, doi: 10.1109/PES.2006.1708917
- A. Elmitwally, A. Eladl, “Planning of multi-type FACTS devices in restructured power systems with wind generation,” Electrical Power and Energy Systems, vol. 77, pp. 33-42, 2016, doi: 10.1016/j.ijepes.2015.11.023
- H. Bilil, G. Aniba, M. Maaroufi, “Multiobjective optimisation of renewable energy penetration rate in power systems,” Energy Procedia, vol. 50, pp.368-375, 2014, doi: 10.1016/j.egypro.2014.06.044
- M. Barukcic, Z. Hederic, K. Miklosevic, “Multiobjective optimisation of energy production of distributed generation in distribution feeder,” ENERGYCON 2014, May 13-16, pp. 1325-1333, 2014, doi: 10.1109/ENERGYCON.2014.6850595
- H. Eskandari, C. D. Geiger, G. B. Lamont, “A Dynamic Population Sizing Approach for Solving Expensive Multiobjective Optimization Problems,” 4th International Conference, EMO 2007, Matsushima, 5-8 March 5-8, 2007, pp. 141-155, doi: 10.1007/978-3-540-70928-2_14
- M. Premkumar, P. Jangir, R. Sowmya, “MOGBO: A new multiobjective gradient-based optimizer fore real-world structural optimization problems,” Knowledge-Based Systems, pp. 1-40, 2021, doi: 10.1016/j.knosys.2021.106856
- Chakraborty, A., Kar, A.K. Swarm Intelligence: A Review of Algorithms. Nature-Inspired Computing and Optimization, pp. 475-494, 2017 doi: 10.1007/978-3-319-50920-4_19