Evaluating Project Complexity in Construction Sector in India
(This article belongs to the Section Construction and Building Technology (CBT))
Export Citations
Cite
Moza, A. , Paul, V. K. and Solanki, S. K. (2022). Evaluating Project Complexity in Construction Sector in India. Journal of Engineering Research and Sciences, 1(5), 198–212. https://doi.org/10.55708/js0105021
Amit Moza, Virendra Kumar Paul and Sushil Kumar Solanki. "Evaluating Project Complexity in Construction Sector in India." Journal of Engineering Research and Sciences 1, no. 5 (May 2022): 198–212. https://doi.org/10.55708/js0105021
A. Moza, V.K. Paul and S.K. Solanki, "Evaluating Project Complexity in Construction Sector in India," Journal of Engineering Research and Sciences, vol. 1, no. 5, pp. 198–212, May. 2022, doi: 10.55708/js0105021.
Evaluating complexity, in order to manage it effectively, has been stressed by many researchers as one of the key areas of project management. This, as literature shows, has been done using different methodologies and assessing it from different perspectives resulting in measures that differ in their characteristics, their application, and their relevance with respect to location or typography. Since no such quantitative study with respect to Indian construction sector was found in literature, the aim of this research is, therefore, to develop a model for evaluating complexity in projects in Indian construction sector with aim of enabling informed interventions at the planning stage to manage the complexity better. A comprehensive literature study enabled identification of 23 such determinants initially which were grouped under 7 components of complexity, each component representing a different type of complexity. Using a two-stage Delphi process, the determinants were narrowed down to 21 and were weighed using mean rank weightages. The results of the survey were used to develop a framework for evaluating complexity which was further idealized into a model in the form of Project Complexity Index that could provide a single quantitative value of complexity at any stage of the project and highlight the areas of concern. Application of the developed model was demonstrated on two case studies of similar infrastructure projects. The framework made it possible to evaluate the complexity as well as highlight the areas needing attention on the basis of component complexity scores thereby indicating that the framework was robust.
1. Introduction
The success of a construction project has been often measured as performance achieved on three parameters of time, cost and quality. In order to improve the probability of achieving this performance, numerous established techniques like time scheduling, cost scheduling, risk assessment etc. have been used extensively by project managers. However, despite this, a large number of projects still fail to achieve performance criteria on these parameters and many other parameters of project success put forward by different researchers from time to time. One of the reasons for this, cited by many researchers, is not understanding the project complexity and its implications on project planning and execution, even though it is a commonly held opinion that the reason for the poor performance is the design and construction process being particularly complex for several reasons [1–3] such as complex processes of communication among project stakeholders, ambiguity and equivocality related to project performance criteria, complex construction techniques etc.
Consequently, a lot of research has been carried out on complexity in projects and it has been acknowledged that construction projects must be viewed as complex and planned accordingly. For example, in [4] authors opined that construction problems are complex, the elements of the problem are numerous and the interrelationships among the elements are extremely complicated. In [5] author reinforced this by stating that construction is more than a straightforward linear process that can be managed top-down. Many researchers [1–3] stressed on the need to not only acknowledge construction projects as complex but also to understand this complexity so that it could be managed effectively. Therefore, it follows that for achieving project success, managing complexity gains significant importance. However, in order to drive the project complexity management efficiently, it is imperative that the project complexity is clearly defined and measured beforehand [6] This has been reinforced by many empirical studies in the construction field which reflect that project complexity would affect the project duration, cost, and quality and should be objectively measured in order to provide continuous feedback to help control the process of project development [1], [7], [8].
The importance of measuring project complexity has been widely acknowledged, but there are not many universal objective measures available for assessing it. Researchers have attributed this to complexity being largely connected to the subjectivity of the observer [9], [10] which suggests that the measurement of complexity in context of projects too will differ among various project stakeholders.
Considerable research has been carried out on identification of factors that contribute to complexity and also on methods that can be used for measuring such complexity in a project. Several authors have looked at the problem of managing projects from the complex systems’ point of view. While analyzing the complexity, they have often used a specific angle. For example, characterizing complexity as structural uncertainty and uncertainty in goals and methods only [11] or complexity being a function of how social systems work in projects [12]. The basic premise of all such studies has been that managing complexity needs to be viewed separately from traditional project management approach. As a result, the factors proposed have been different from those that reflect the general character of a project or those which are used often in project management vocabulary by people managing projects.
Other studies have tried to view or identify complexity in a project from within the existing characteristics of a project by simply analyzing the usual project parameters of cost, design, quality standards, specifications etc. [13]. The premise behind these studies is that it is possible to gather simple project complexity factors which are often encountered and dealt with at site level and thus are familiar to people managing projects. However, such studies are often specific with respect to various factors and local nuances like type of project, project delivery mechanism, country specific factors etc. affecting their management. Thus, a uniform approach having a universal implication on complexity management has not evolved, though the studies do provide insights into various methodologies used. Since such methodologies are often geographically specific and take into account the local nuances, very little research is available on objective quantification of complexity in India construction industry scenario thereby indicating that research on methodology for evaluating complexity in projects in an Indian context needs attention. This would enable informed interventions by project managers for reducing the complexity and managing project outcomes efficiently.
It can be argued, basis study of existing literature as mentioned above, that by simply analyzing the usual project parameters of cost, design, quality standards, specifications etc., it is possible to gather simple factors that make a project complex. For example, a project using only an established schedule of items with no additional items specific to the project can be termed as non-complex because the established items have fixed specifications and there’s nothing peculiar about them as far as executing the specifications or even cost of item is concerned. At the same time, however, project will be considered complex if knowledge of processes involved in executing the project is new and requires higher skills or professional delivery.
Therefore, by considering the premise already established in the literature [13] that complexity can be established from within project parameters and fine-tuned to the geographical or locational peculiarities, evaluation of complexity can be made simpler. Also, in India though some studies have been carried out on issues of project complexity, for example, finding measures of complexity but limited to engineering design projects [14], while some studies explore complexity in governance of projects [15], others explore complexity in project interfaces [16], but no significant study on an objective evaluation of complexity in projects in Indian Construction Sector can be found in literature,. Therefore, this study was carried out to identify determinants that contribute to project complexity from the existing project parameters like design, quality, location etc. using existing available research and establishing a framework, based on identified determinants, for evaluating the same. The methodology for such a framework shall be such as can be easily applied by project professionals without prior expert knowledge of complexity modelling and complexity measurement techniques.
The study aims to develop a framework that can objectively measure complexity of projects in Indian construction sector so that project managers can make managerial interventions at appropriate stages for effective project management.
To achieve the above-mentioned aim of the study, the following are the objectives to be met:
- To identify determinants of complexity and characterize project complexity determinants (factors) and establish key interrelationships between them.
- To develop a model for effectively measuring project complexity as an index for assisting project managers in evaluating complexity.
- To validate the model by testing its application to a case example generally perceived to be complex.
2. Research Method
This study tries to look at complexity using an approach wherein complexity is considered a general characteristic of a project rather than application of complexity theory and is based upon following successive steps, which are a modified combination of methodology used by researchers [17] and [18] in their respective studies on measuring complexity.
- Reviewing literature in order to provide documentary evidence of the subject matter and to provide a wider understanding of the key issues.
- Determining, from reviewed literature, key factors contributing to complexity and group them under relevant heads to form a preliminary framework for complexity evaluation.
- Carrying out validation and refinement of preliminary framework through a questionnaire survey using Delphi method.
- Analyzing the results of the Delphi survey for the purpose of refining the framework and assign weights to each determinant.
- Idealizing the refined framework into a model to determine the complexity index of a project so that areas needing improvement through managerial interventions are highlighted.
- Testing the model by applying it to analyze a few real-life projects.
3. Background Study
A common view that one comes across often when dealing with the construction industry is that construction is a complex process, and it continues to get more and more complex with projects employing sophisticated technologies to serve diversified requirements of varied end-users. In [1], the author opines that the building projects have become progressively more complex since World War II. Although Project complexity has not been clearly defined [19] it is regarded as one of the critical project characteristics that determine appropriate actions to result in successful project outcomes [1]. The fact that project complexity influences project performance and affect the success of a project has been widely recognized by various researchers in the past [20–23]. Despite this and years of research on the concept of complexity, there has been a lack of consensus on what project complexity means. Many researchers have suggested that processes comprising innovative operations and conducted in an uncertain situation are complex. On the other hand, complexity of a task is defined as being the degree of difficulty in the search process, in performing the task, the amount of thinking time required and the body of knowledge in existence [24–26]. In [27] the author presented a view that a large number of elements in a process did not make it complex but the complexity was in the interactions between elements. This seems to fit well with the construction sector with its wide variety of disciplines, varied project types, organizational structures etc. For example, just by differing methods of procurement used may result in high or low levels of subcontracting [28] adding to the problems of integrating numerous, diverse organizations. Having no general definition of complexity, the difficulty in defining it is mainly circumvented by defining its key drivers. But according to authors in [29] defining those key drivers is not easy because those drivers depend on the environment and context of the project and reiterate that “when modelling the complexity of the design process it is first essential to determine the context” (work context, time context, motivational context and social context). They also suggest that there is very little information on the interrelations between these drivers due to a lack of consensus on project complexity drivers themselves. Project complexity is therefore difficult to define as a whole in general. As a result, many researchers have tried to express project complexity as composed of different kinds of complexity. That way they could easily define and explore the drivers of that particular aspect of the project which had the potential of making it complex. For instance, in [1] the author explores project complexity as a function to two distinct complexities depending upon the nature of organization and technology used and called them organizational complexity (number of hierarchical levels in organization, the degree of interaction between the project organizational elements, etc.) and technological complexity (number and diversity of inputs/outputs, number of interdependencies between tasks, etc.). The benefit of such a differentiation or breaking up of total complexity into components is that managing complexity becomes simpler to some extent as project managers can fine tune their approach if they know the kind of complexity they are dealing with. Consequently, complex projects have been defined by various researchers depending upon different characteristics they could possess. For example, lack of clarity on the goals of the project [30] dynamism in overall project methodology [31] direct or indirect communication among project elements [32] uncertainty in events [11], though simply having uncertain events during project lifecycle does not constitute complexity as some amount of uncertainty is always present in a project [33], and uniqueness of project [34]. These characteristics have been used by various researchers while propounding different complexity models with a view to assess and manage complexity in projects. For example, in [30] the authors having developed a ‘Goals and Methods Matrix’ classify projects using two parameters: How well defined the goals are, and how well defined are the methods of achieving those goals. They suggest that if methods are uncertain, the fundamental building blocks of Project Management like, tasks required to complete the job etc. will not be known. This model addresses the ‘Uncertainty’ aspect of complexity but does not address the interdependence of the elements in a model. Similarly, in [11] the author extends the model presented by Baccarini by adding one more dimension of Uncertainty to two components of ‘No. of elements’ and ‘Interdependence of these elements’ presented by Baccarini. The uncertainty could be that of Goals or it could be in Uncertainty of methods. This model was further modified by researchers in [35] by including social interactions as one of the major determinants of complexity. According to them, the previous models neglected the effect of social interactions and their contribution to Complexity. Their model, therefore is an extension of William’s model which in itself is a combination of Baccarinis’s and Turner & Cochrane’s model of uncertainty. Based on the source of complexity the authors in [36] suggest four types of project complexity
- Structural complexity: Arises in large scale projects which are broken down into smaller parts
- Technical complexity: Arises in projects “which have design characteristics or technical aspects that are unknown or untried”
- Directional complexity: found in change projects, “when it is clear that something must be done to improve a problematic situation, but it is unclear what this ‘something’ should be.” [36]
- Temporal complexity: results in projects where there is a high level of uncertainty regarding future constraints like change in laws, guidelines etc.
This was further developed by researchers in [37] by stating that structural complexity is compounded by uncertainty increased by constraints. These constraints could be either environmental constraints, resource constraints or constraints of objectives.
Reviewing these models, it is clear that every model looks at complexity from a different perspective. While some of the key factors like structural complexity, uncertainty, technical complexity and clarity of goals seem to resonate in different models, yet it cannot be concluded that one model shall fit all the project scenarios. The researchers [38] in their study on complexity model conclude that existing models of project complexity do not suffice for an overall definition of project complexity. However, these models provide a base for identifying complexity measures particularly for infrastructure projects in the context of Indian construction industry.
Given the fact that project complexity is hard to be quantified precisely, many researchers focus on identifying factors/aspects relating to the project complexity while others focus on identifying specific variables and rating systems to quantify the project complexity. For example, in [39], the author classified construction projects based on scale of complexity into three categories of normal, complex, and singular. Classification is done on the basis of ten groups of variables and each variable is quantified on a 10-point Likert scale, and the average rating is then calculated to obtain the complexity category. However, no weights have been provided for these variables according to their relative importance. In [7], the author on the other hand worked on a construction complexity index (CCI) using ten variables that define the project complexity. The CCI is calculated as the sum of products of weight coefficients and complexity rating scores which are calculated using factor analysis and cluster analysis respectively, carried out with respect to an opinion survey. This is a robust model; however, it only focuses on measuring the complexity of the construction process only and does not focus on entire or all phases of project and also limits the study to building projects only. The model, however, does provide a working methodology for quantifying complexity in different project types carried out in different geographies. Researchers [13] further this methodology by presenting a complexity index consisting of six key measures of complexity for building projects in China. They use a three-round Delphi questionnaire survey for identifying key parameters and based on their relative importance and weightages, they calculate an index for quantifying complexity under each parameter. However, the study is restricted to building projects in PRC only. Therefore, it would not be appropriate to use the same variables for construction projects in India.
It can be concluded that there is no consensus on the identification of complexity measures for construction projects. Researchers assess the project complexity from different perspectives. The identified measures include not only specific characteristics of construction projects but also conceptual aspects relating to the theory of complex system. Furthermore, considering that the complexity in this study is defined as the degrees of difficulty when delivering projects, the complexity measures would vary in different geographical locations due to their unique market conditions. Therefore, in order to meet our objectives, it was evident that any new proposed framework must have specific measures or determinants that usually come across in a project and could be easily identified and quantified by a regular project manager. The determinants must further be able to be grouped under different heads for the purpose of classification of complexity into various components which again correspond to different aspects of project management.
4. Proposed Framework of Project Complexity
Having carried out a detailed literature study on issues related to complexity and analyzing different complexity models proposed by researchers, the next step involved listing the measures that could be used to assess complexity in an infrastructure project. While doing so it was imperative that all aspects of project complexity are captured keeping the above mentioned two main objectives in mind. As a whole, a very large number of possible project complexity measures can be identified when structuring a literature review. From among these, a set of measures were identified after discussions among researchers which were objective in nature and corresponded to the denominations commonly used in field. The measures listed are presented in Table 1.
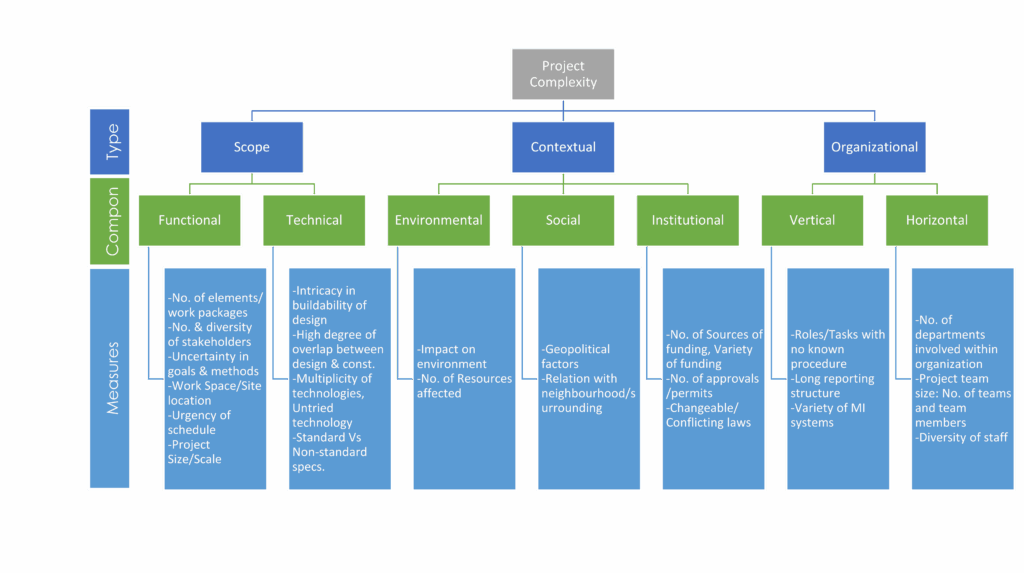
The measures were then further classified and grouped according to the type of complexity they attribute to. This grouping was carried out through a new model of complexity wherein overall complexity has been proposed to be of three main types and each type to be composed of different components each of which can be evaluated through measures listed above and grouped under each such component.
Accordingly, the proposed framework classifies overall complexity into three main types with each type composed of different components:
- Complexity with respect to Scope
- Functional Complexity
- Technical complexity
- Complexity with respect to Context
- Environmental complexity
- Social complexity
- Institutional complexity
- Complexity with respect to Organization
- Vertical organizational complexity
- Horizontal organizational complexity
The primary objective of evaluating complexity under these three heads is to clearly differentiate between complexities that are either stemming directly out of the project and inherent to it or arise as a result of interactions that the project is going to have with external environment and stakeholders or those complexities that are not specific to project but are associated to it on account of the organizational structure of the project proponent or client organization.
A summary of these three types is presented in Table 2 below followed by proposed new framework as Figure 1 .
Table 1: Listed Measures of Complexity
S No. | Complexity Determinant | Description |
1 | No. of elements or work packages | More no. of elements in a project or more number of work packages would make a project more complex to deal with due to a large number of interactions between these elements |
2 | No. of stakeholders | If stakeholders are larger in number, it involves more complexity as one has to manage large no of diverse interests these stakeholders would bring with them. |
3 | Diversity of Stakeholders | Stakeholders coming from different cultures and different geographical regions are more difficult to manage as it poses difficulty in understanding mutual concerns. |
4 | Uncertainty in goals and methods | Uncertainty leads to complexity. Uncertainty in goals might arise due to various stakeholders having different expectations and goals from the project or when the scope is poorly defined. |
5 | Workspace/Site location | Difficult locations or constrained site conditions make a project more complex. Difficult locations would mean far away locations removed from resources, in difficult terrain, hostile terrains etc. Similarly constrained workspaces would involve more complexity. |
6 | Project Duration | The Urgency of Schedule or an accelerated schedule makes a project more complex. A project with fast-track schedule is more complex. |
7 | Project Size/Scale | Bigger projects are usually more complex than the smaller ones |
8 | Buildability of design | To construct the design requires complex procedures and techniques making the project more complex |
9 | High degree of overlap between design & construction | Overlapping stages of design and construction makes it more complex to manage the project. This can happen for various reasons like no. of interactions required between the two phases, non-availability of drawings at the right time, close monitoring required for both stages to be in sync etc. |
10 | Multiplicity of technologies | Too many technologies or new unused technologies makes a project more complex. This would include use of new or advanced equipment and techniques of construction. |
11 | Non-standard specifications/ BOQ items | If project requires too many non-standard items, it is more complex than a project which runs on standard items/specifications |
12 | Environmental Impact | Requires high degree of environmental clearances and procedures for mitigation of adverse effects |
13 | Resources Affected | If a project involves affecting too many natural resources and people, it becomes more complex due to mitigation and rehabilitation processes getting involved which increase the elements and consequently interactions between these elements to be managed. |
14 | Interaction with surroundings | Negative interactions with public/surroundings make it more complex to handle a project as interactions now fall outside the regular or envisaged scope of the project. |
15 | Geopolitical Factors | Adverse geopolitical factors make a project more complex. This includes projects coming up in politically unstable locations, disturbing territories, violence prone areas etc. |
16 | No. of approvals or permits | Too many and varied approvals required for project make it more complex to handle |
17 | No. and variety of sources of funds | More number and different types of funding make a project more complex from a financial perspective. |
18 | Unstable laws/ policies | High probability of frequently changing laws or policies related to a project make a project more complex |
19 | Conflicting Laws | Laws or policies not conducive to project execution make it more complex, for example, too many restrictions on methods of disposal of waste, methods of construction etc. |
20 | No. of departments within a client organization | More departments mean more interactions hence more complexity. |
21 | Reporting Structure | Complex and a long reporting structure delays decision making and hence is more complex to deal with. |
22 | Roles/Tasks with no known procedure | Roles or tasks without precedence or known procedure can cause a high degree of organizational complexity |
23 | Variety of MI Systems | Too many and varied management information systems are more complex to deal with. |
Table 2: Summary of types of Complexity
Complexity | Definition | Objective | Details |
With respect to Scope | Complexities associated with the project’s deliverables and the work required to create those deliverables. | To have a measure of complexity which is inherent to the project due to its structure so that interventions required for mitigating its effects are identified | It includes aspects like basic structure of project, project size and scale, execution methodology, technologies used etc |
With respect to Context | Complexities arising out of interactions of project with its environment in a specific context | To have a measure of complexity that arises due to external factors affecting project and also management actions in response to such factors. | It includes aspect like environmental impact, geopolitical factors, effect on resources/populations, interactions with statutory and other bodies |
With respect to Organization | Complexities arising out of the organizational structure of project organization | To identify and optimize the organizational structure for the project so that organizational differentiation is minimized. | This is characterized by depth of hierarchical and reporting structure and Number of departments or formal organizational units across organization |
4.1. Survey Design
The methodology adopted in this research is based on the work done by researchers [13] who used three rounds of Delphi survey to finally calculate a complexity index for building projects in China. The Delphi Process is a unique method of eliciting and refining group judgment, based on the rationale that two heads are better than one when exact knowledge is not available [40]. It has proven over the years to be a very popular tool for framework building, forecasting, issues prioritizing, decision-making, etc. [41]. The Delphi method is used in this study as it is designed to obtain the most reliable consensus from a panel of experts basis several rounds of questionnaires with each subsequent round supplemented by controlled feedback [13].
As a first step of Delphi method, an expert panel was chosen for responding to the questionnaire. As suggested by researchers in [41] the experts selected should have enough knowledge and experience, willingness and time to take part in the survey, and good communication skills. Based on these features, a panel of 20 experts was selected to perform Delphi process, 18 of them belonging to construction industry while as 02 of them being academicians in the field of construction projects management. 5 out of 18 industry Practitioners were visiting academic faculty teaching construction projects management. The selected experts represent a wide spectrum of construction professionals and provide a balanced view for the Delphi study. All the experts have sufficient experience and expertise in building projects. Figure 2 depicts the details of the experience of the experts in construction industry, number of projects handled by them and their role in the construction industry.
Fifty-Eight percent (58%) of the panel members had experience of more than 15 years in construction industry while as 26% of respondents had an experience of 5-15 years. Only 16% had less than 5 years’ experience in construction industry. Almost all the respondents had acceptable backgrounds and experience in construction projects.
Thirty-seven percent (37%) of the respondents were either the owners or clients of the projects. These included public bodies like CPWD, PWD, DDA and other public sector units. More than half of the panel of respondents were consultants or architects. Almost 50% of these were both consultants as well as academicians and thus were very well versed with nuances of construction projects.
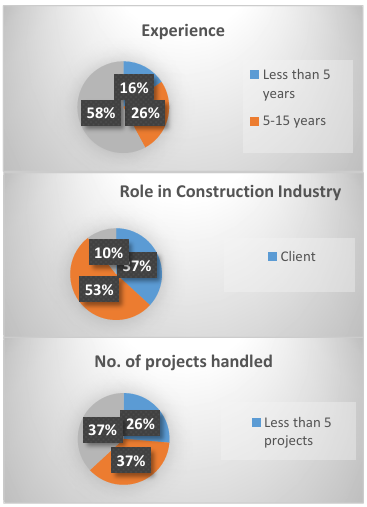
The balance 2% of the respondents were academicians who specialized in field of construction and project management.
Because of the purpose of this research, the number of completed projects is more important than the number of years a respondent has worked. 70% of the experts had participated in more than 5 projects and out of these 50% had carried out more than 15 projects.
The questionnaire besides recording the personal details of experts as described above, also had a section where in all 23 measures classified into 7 groups were presented to experts with a brief description for each measure. Respondents expressed their opinion on the importance level of each measure on a five-point Likert scale under categories of “1” means not important at all, “2” means little important, “3” means moderately important, “4” means very important, and “5” means extremely important. For measures to be important from a respondent’s perception means that the importance level should be significantly higher than three. Also, an applicable measure with mean value should be higher than three for it to be included in the framework.
4.2. Survey -Results & Analysis
The purpose of the first round of the questionnaire survey was to finalize the list of measures of complexity and also begin the process of building consensus among the experts. A list of 23 complexity determinants or measures were provided to experts in the form of a questionnaire, and they were required to record their responses against each one as per the scale explained above and were also asked to provide any other measure along with its importance on liker scale, which they felt was necessary for inclusion in the framework. In all 19 out of 20 experts selected for the panel returned their responses. In this research, the mean score of 3.0 was adopted as a cut-off point. Only the measure regarded as ‘Important’ remains for the re-evaluation in round 2. Table 3 below shows the results of round 1 of the Delphi questionnaire survey.
Table 3: Results of round 1 of survey
Determinants | N | Mean | Std. Deviation | Mean Ranks | Rank |
No. of elements | 19 | 4.05 | .621 | 14.63 | 4 |
No. of stakeholders | 19 | 4.26 | .653 | 16.00 | 2 |
Diversity of stakeholders | 19 | 3.79 | .535 | 12.11 | 13 |
Uncertainty in goals & methods | 19 | 4.42 | .769 | 17.24 | 1 |
Workspace/Site location | 19 | 3.84 | .898 | 12.63 | 10 |
Urgency of schedule | 19 | 3.47 | .905 | 10.03 | 20 |
Project size/scale | 19 | 3.16 | .688 | 7.61 | 23 |
Buildability of design | 19 | 3.89 | .658 | 12.95 | 7 |
Degree of overlap design & const | 19 | 3.79 | .631 | 12.66 | 9 |
Multiplicity of technologies | 19 | 3.74 | .991 | 12.50 | 11 |
Non-standard specifications | 19 | 3.53 | .964 | 10.66 | 18 |
Impact on environment | 19 | 3.58 | 1.071 | 10.82 | 17 |
No. of resources affected | 19 | 3.63 | .895 | 11.21 | 15 |
Interaction with surroundings | 19 | 3.21 | 1.084 | 7.87 | 21 |
Geopolitical factors | 19 | 4.00 | .882 | 14.00 | 5 |
No. of approvals | 19 | 3.16 | 1.068 | 7.76 | 22 |
No. of sources of funds | 19 | 3.74 | .733 | 11.45 | 14 |
Unstable laws/policies | 19 | 3.84 | .688 | 12.74 | 8 |
Conflicting laws | 19 | 3.84 | .688 | 13.00 | 6 |
No. of departments | 19 | 3.63 | .831 | 11.11 | 16 |
Reporting structure of client org | 19 | 3.58 | .607 | 10.13 | 19 |
Tasks/roles with no known procedure | 19 | 4.11 | .567 | 14.74 | 3 |
Variety of MI systems | 19 | 3.74 | .806 | 12.18 | 12 |
average score against a determinant is 3.16 for ‘No. of approvals’ and ‘project size/scale’ which is still slightly above the cut off score of 3.0. Therefore, all of the twenty-three determinants were carried to the second round of the survey for re-evaluation.
Though mean standard deviation of all the responses is 0.7 which is moderately high, standard deviations of many responses are quite high, in a few cases going well beyond 1.0. This indicates that an acceptable consensus has not been achieved. This is confirmed by a low value of 0.161 of Kendall’s Coefficient of Concordance (W) calculated with the aid of the SPSS software.
Therefore, a second round of survey was carried out for allowing the respondents to re-evaluate their ratings on the basis of consolidated results of round one with the aim of building a reliable consensus.
In the second round of the Delphi survey, the experts were asked to re-assess their ratings. For this purpose, they were provided a copy of the consolidated results of the first round of survey along with their individual ratings. The consolidated results included median ratings and standard deviations of each determinant. It also presented percentage responses received against each rating for a particular determinant. The purpose of providing these details was to provide the experts with enough data to assess their ratings vis-à-vis the entire panel.
Finally, all 19 experts returned back the second-round questionnaire. Most of the experts had reconsidered their ratings and had accordingly made adjustments in their ratings. From the results it was observed that two determinants had got an average value less than the cut-off score of 3 meaning that they are not considered important in determining the complexity of a project. The two determinants are ‘interaction with surroundings’ and ‘number of approvals. Consequently, these two determinants are dropped from the list of determinants for further analysis.
Furthermore, it is also observed that these two determinants had received very low ranks in the round 1 survey and had only one determinant ranked below them.
After these two determinants were removed from the data, further statistical analysis was carried out to find out the mean ranks and the weightage of each determinant. Mean Ranks have been used instead of statistical averages because the rating scale is not a purely equal interval scale and hence doesn’t justify usage of the averages for calculating weights.
On the basis of ratings provided by experts, mean ranks were calculated using SPSS software. Based on the mean ranks so calculated, similar to [13] the weightages of each determinant were computed.
Table 4-4 consolidates the results of the 2nd round of the survey. It can be observed that when compared to the results of round 1 survey, all the standard deviations have reduced and are now less than 1. The mean standard deviations too are calculated for the entire framework and found to be 0.56 which is lower than 0.7 obtained after the first round of survey. This indicates that a reasonable consensus has been achieved.
Table 4: Consolidated results of second round of survey
Complexity Determinant | Avg Rating | Std. Deviation | Mean Ranks | Weight | Rank |
No. of elements | 4.05 | .405 | 13.05 | 0.057 | 5 |
No. of stakeholders | 4.42 | .507 | 15.79 | 0.068 | 2 |
Diversity of stakeholders | 3.79 | .419 | 10.58 | 0.046 | 11 |
Uncertainty in goals & methods | 4.68 | .478 | 18.08 | 0.078 | 1 |
Workspace/Site location | 3.79 | .713 | 10.42 | 0.045 | 14 |
Urgency of schedule | 3.58 | .607 | 8.89 | 0.039 | 18 |
Project size/scale | 3.11 | .459 | 4.61 | 0.020 | 21 |
Buildability of design | 3.89 | .567 | 11.63 | 0.050 | 7 |
Degree of overlap design & construction | 3.79 | .419 | 10.76 | 0.047 | 10 |
Multiplicity of technologies | 3.79 | .787 | 10.50 | 0.045 | 13 |
Non-standard specifications | 3.89 | .658 | 11.82 | 0.051 | 6 |
Impact on environment | 3.53 | .697 | 8.08 | 0.035 | 20 |
No. of resources affected | 3.58 | .692 | 8.92 | 0.039 | 17 |
Geopolitical factors | 4.11 | .658 | 13.24 | 0.057 | 4 |
No. of sources of funds | 3.58 | .507 | 8.47 | 0.037 | 19 |
Unstable laws/policies | 3.89 | .459 | 11.53 | 0.050 | 8 |
Conflicting laws | 3.79 | .631 | 10.55 | 0.046 | 12 |
No. of departments | 3.74 | .733 | 9.92 | 0.043 | 15 |
Reporting structure of client org | 3.63 | .496 | 9.26 | 0.040 | 16 |
Tasks/roles with no known procedure | 4.16 | .501 | 13.82 | 0.060 | 3 |
Variety of MI systems | 3.84 | .501 | 11.08 | 0.048 | 9 |
To verify this and to find out the degree of variance in the rankings, Kendal’s coefficient of concordance is once again calculated and is found to be 0.291. The value of coefficient of concordance obtained is not substantial, but when compared to the result of first round, the value has almost doubled. This means that a reasonable consensus has been built up. Also, a low value of coefficient can be attributed to the fact that experts were asked to rate each determinant on a rating scale of 1 to 5 and were not required to rank the determinants directly. The rankings were calculated based on these ratings. Consequently, what it means is that the experts believe that some of the determinants are equally important in the evaluation of complexity of a project. This is corroborated by the fact that many determinants have values of mean ranks very close to each other. The presence of a rating scale allowed them to do so. Had they been required to rank each determinant from 1 to 23, it would have been unlikely that two or more determinants would have same mean ranks which would have resulted in a far improved value of the coefficient of concordance.
From Table 4 it can be observed that only five determinants have average scores above 4 which means that respondent experts feel that these five are extremely important in evaluating complexity. Furthermore, all three complexity types of Scope, Contextual and Organizational are represented in these top five determinants. ‘Uncertainty in goals and methods’ has been ranked as the highest determinant of complexity followed by ‘number of stakeholders involved’. Both of these determinants have their genesis in complexity related to Scope. Though they are ranked as top two, there is no significant correlation between the two as suggested by a low value of coefficient of correlation (0.2) between the two.
In order to understand better the relationships between the identified project complexity factors, a correlation analysis has been performed by calculating Spearman Rank correlation coefficient. The aim is to check for possible existing correlations between factors in the answers of the experts.
The correlations above critical values of the Spearman Rank for the value of 19 pairs have been highlighted in Figure-3.
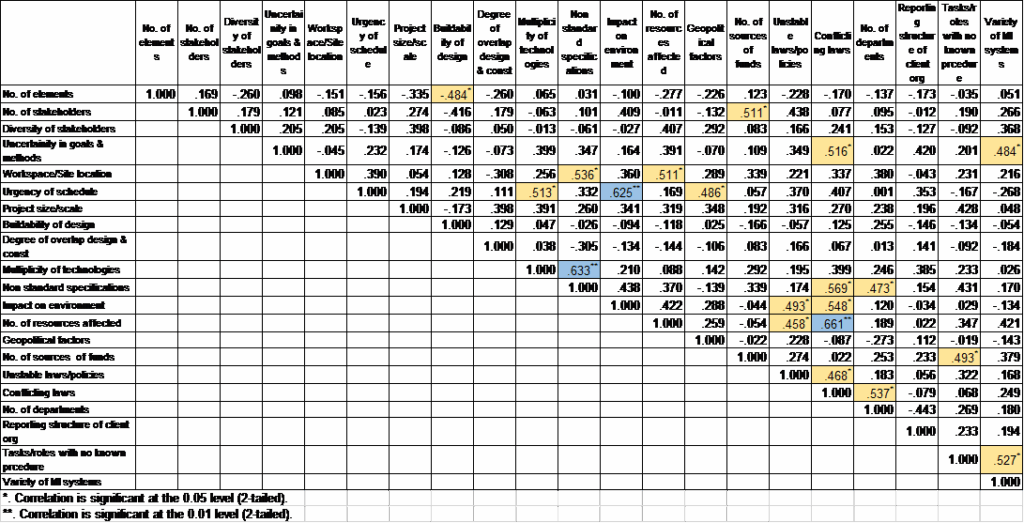
From the correlation analysis, it could be concluded that the project complexity determinants tend to be positively correlated with less than 30% of the values being negatively correlated. However, the average value of rs2 is equal to 0.16 indicating that the positive correlations are not very high. Finally, less than 8% of the values are above the critical value for p < 0.05 and less than 1.5% of them are above the critical value for p < 0.01, which means that strong correlations are rare in this case.
Despite the positive correlation being limited among determinants, there are significant correlations between some of them. For example, the highest value of r = 0.661 indicates that ‘No. of resources affected’ and ‘conflicting laws’ are significantly positively correlated determinants in evaluation of overall complexity. Similarly, with r = 0.633 ‘multiplicity of technologies’ and ‘non-standard specifications’ are significantly positively correlated and so are ‘impact on environment’ and ‘urgency of Schedule’. It must, however, be noted that these correlations are not very intuitive and yet are significant at p<0.01. Also, another important observation that must be made is that these correlations are significant but not strong because the value of ‘r’ must be above 0.85 for correlations to be strong. Therefore, in case of fitting this data in a model, it is valid to assume a linear relationship between the determinants.
4.3. Complexity Model: Project Complexity Index
Referring to the framework of complexity evaluation presented in Figure 1, the overall complexity of a project is divided into three main types which are further composed of different components which can be directly measured from the project details.
Therefore, for evaluating the overall complexity of the project, the component complexity indices are first evaluated. These component indices are then added, as per the grouping finalized in proposed framework, to provide values of each type of complexity which can be further added to give a consolidated complexity index for the project. The final refined framework is presented in Table 4-5.
Table 5: Final refined framework of project complexity
Complexity Type | Component Complexity | Complexity Determinant | Short Form | Mean Ranks | Weightage |
SCOPE | Functional | No. of elements | FD1 | 13.05 | 0.057 |
No. of stakeholders | FD2 | 15.79 | 0.068 | ||
Diversity of stakeholders | FD3 | 10.58 | 0.046 | ||
Uncertainty in goals & methods | FD4 | 18.08 | 0.078 | ||
Workspace/Site location | FD5 | 10.42 | 0.045 | ||
Urgency of schedule | FD6 | 8.89 | 0.039 | ||
Size/Scale of Project | FD7 | 4.61 | 0.020 | ||
Technical | Buildability of design | TD1 | 11.63 | 0.050 | |
Degree of overlap design & construction | TD2 | 10.76 | 0.047 | ||
Multiplicity of technologies | TD3 | 10.50 | 0.045 | ||
Use of non-standard specifications | TD4 | 11.82 | 0.051 | ||
CONTEXTUAL | Environmental | Impact on environment | ED1 | 8.08 | 0.035 |
No. of resources affected | ED2 | 8.92 | 0.039 | ||
Social | Presence of adverse geopolitical factors | SD1 | 13.24 | 0.057 | |
Institutional | No. and variety of sources of funds | ID1 | 8.47 | 0.037 | |
Likelihood of unstable laws/policies | ID2 | 11.53 | 0.050 | ||
Laws in conflict with a project implementation strategy | ID3 | 10.55 | 0.046 | ||
ORGANIZATIONAL | Organizational | Number of departments in Client organization/project setup | OD1 | 9.92 | 0.043 |
Long Reporting structure of client organization | OD2 | 9.26 | 0.040 | ||
Tasks/roles with no known procedure | OD3 | 13.82 | 0.060 | ||
Variety of Management Information systems | OD4 | 11.08 | 0.048 |
4.3.1. Component Complexity Indices
Using the weightages from the framework, the component complexity indices are developed and presented in following paragraphs.
Functional Complexity Index
Functional Complexity deals with functional aspects of the scope like project size and scale, stakeholder number and mix, financial sources and financial mix, uncertainty in goals and methods, site location etc. The factors within functional complexity component bring out those aspects of project management that deal with functional attributes of a project having their genesis in Scope Management. The first component complexity index is developed which can be represented by the following equation
$$FCI = 0.057 \times SFD1 + 0.068 \times SFD2 + 0.046 \times$$
$$SFD3 + 0.078 \times SFD4 + 0.045 \times SFD5 + 0.039 \times$$
$$SFD6 + 0.020 \times SFD7$$
where
- FCI represents the Functional Complexity Index
- SFD1 to SFD7 represent the scores of functional complexity determinants.
The above index has been derived on the basis of assumption that the model is a linear and additive one. This assumption is confirmed by the correlation analysis carried out wherein it is apparent that the determinants are not strongly correlated with each other. Additionally, it has been the view of many researchers that using non-linear models is not recommended when the sample size is not sufficiently large. [42]
Also, from the above equation, it is observed that the complexity index is defined by two main components: the weight coefficient of a determinant and the score of a determinant. The score of a determinant can be obtained on the basis of values of a determinant for an individual project. The methodology for obtaining these scores can be decided by the project organization or the project manager. For example, a rating system may be developed by an organization for determining the scores against complexity determinants to be used in all its projects.
Technical Complexity Index
Technical Complexity deals with technical aspects of scope like a number and mix of technologies used in both machines as well as methods, constructability of design, nature of specifications, contract delivery mechanism etc. The factors within this component of complexity essentially cover operations, that is, equipping and sequencing of activities, characteristics of materials and characteristics of knowledge. All of these three aspects have their genesis again within the scope management
Similar to procedure above, second component complexity index is developed and is represented by following equation
$$TCI = 0.050 \times S_{TD1} + 0.047 \times S_{TD2} + 0.045 \times S_{TD3} + 0.051 \times S_{TD4}$$
where
- TCI represents the Technical Complexity Index
- STD1 to STD4 represent the scores of technical complexity determinants mentioned in the framework.
Based on the procedure illustrated above, all other component complexity indices are developed and are presented as following equations
Environmental Complexity Index
ECI=0.035×SED1+0.039×SED2
Social Complexity Index
SCI=0.050×SSD1
Institutional Complexity Index
ICI=0.037×SID1+0.050×SID2+0.046×SID3
Organizational Complexity Index
OCI=0.043×SOD1+0.040×SOD2+0.060×SOD3+0.048×SOD4
The overall complexity index for a project is calculated by adding the component complexity indices which are obtained by applying the method explained in preceding section.
Therefore, overall project complexity is calculated as per following equation
PCI = FCI + TCI +ECI + SCI + ICI + OCI
Where
PCI represents the Project Complexity Index and FCI, TCI, ECI, SCI, ICI and OCI represent individual component indices.
Also, from the above equation for overall complexity, complexity with respect to Scope can be determined as
Complexity with respect to scope = FCI + TCI.
Similarly, Complexity with respect to Context = ECI+SCI+ICI and Complexity with respect to Organization = OCI
4.4. Evaluating Determinant Scores and Complexity Indices
The mathematical equations representing the model are simple linear equations containing constants and variables. Constants are the weightages obtained on the basis of the Delphi study results while variables are the complexity determinant scores explained earlier.
In order to evaluate the component complexity and the overall complexity, determinant scores need to be determined for a particular project. These determinant scores can be evaluated for each project as per procedures typical and suitable to a particular organization. For example, every organization may have a different benchmark on the number of stakeholders beyond which they may feel project becomes complex to handle. This is true for all the determinants that make up this model. However, in order to demonstrate the application of the model, a procedure for obtaining this score for a project is illustrated. This procedure may be adopted by any organization for their projects in the initial period of application of the model. When sufficient data has been collected on several projects handled, organizations can use scientific methods to find out and benchmark maximum values of component complexities for their organizations.
The procedure is based on the methodology proposed in an earlier study of modelling complexity [17] and consists in framing a questionnaire for project managers to respond for their respective project, for which complexity needs to be determined. The methodology involves posing a set of questions in a number of phases, minimum two. Phase-1 poses a series of questions relating to the project which have been formulated based upon the project complexity determinants that have been identified and finalized through the research. The questionnaire, format conceived by researcher [17] in her research, contains 19 questions pertaining to each determinant in the model. The user of the model must score each determinant between 0 and 10. The question should be scored zero if it has no significance or does not apply to the project. A low number should be scored for lower impact of that determinant on complexity, with the score increasing towards 10 based upon the magnitude of impact the determinant has on that complexity. The questions are also provided with ‘cues’ to guide the user in filling the scores. The ‘cues’ provide information of what that determinant encompasses and points the user towards various aspects that particular determinant is supposed to capture.
The project complexity is then calculated using the model equation. This is called the ‘baseline’ calculation and should be preferably carried out immediately after project brief is ready and one has all the information related to project in hand. The outcome of Phase 1 is the baseline component complexity figures and highlights the areas which need improving in order to reduce the project complexity.
In Phase-2 a new series of questions are posed relating only to the areas which need improving. These are scored in the same way as the original questions in Phase-1 so that the project complexity can be recalculated. However, stage two questionnaire can be used effectively only if the target maximum level of component complexities are known and established. If target values are not established, it will only provide relative values of complexity for comparison with baseline values, for a particular project. Since the scope of this study is limited to demonstrate the application of model to a particular project at the beginning, the application of phase 2 calculations shall not be covered because due to limited time available for completing this study, it will be difficult to match the progress of the study with a project which is at a preliminary stage of life cycle and then follow as the project moves along.
The whole evaluation process works in the following way:
- Baseline evaluation process determines if the project complexity is at an acceptable level. It is so if all of the component indices score below the target maximum established and the identified complexity can be managed as it is.
- If any of the component complexity indexes is higher than the target maximum, additional information and intervention in terms of strategy is required and therefore phase two of questions must be completed.
- The phase two questions specifically target the areas which have a higher than recommended project complexity value.
- When the stage two questions have been completed, the project complexity calculation and evaluation process is repeated,
- If the project complexity for all of the component complexities is now below the target maximum, the project complexity can be managed.
- If some components are still scoring above the recommended maximum, the phase two questions, calculation and evaluation must be repeated until all of the indices are within the acceptable limits.
5. Testing of Model: Case Studies
In order to test the model and the methodology of applying it described in section 4.4 above, two case studies were analyzed. Since target scores couldn’t be made available for the case studies, as an initial exercise, only baseline scores are being determined. Therefore, to have some meaningful comparisons, case studies selected are of similar projects. It may, however, be noted that the model can be applied to any project in any situation. After obtaining the details of both the projects, the project heads of both the projects were asked to fill the baseline sheet for their respective projects. While doing these they were urged to consider the initial conditions at the beginning of the project life cycle. The overview of the case studies and the model application analysis is provided in the following paragraphs
5.1. Case Study 1: International Airport at Chandigarh
Background
The ambitious ₹900-crore project was conceived as a joint venture between Airports Authority of India (AAI) and the governments of Punjab and Haryana. Designed on the green building concept, the terminal in Mohali (Punjab) is spread over 53,000 sq.m and can handle 1,600 passengers, including 450 international travellers, during peak time
The project had several features that could make the planning for the project complex. First of all, the design of the terminal building was based on green concept, which was a first in the country. Consequently, new technologies were also envisaged in the construction of building as well as allied facilities. This was a planning challenge for the project proponents as many of these initiatives were new for them.
Two of the three major stakeholders of the project had a lot of differences among themselves which led to uncertainty in the naming of the project. The project team had to ensure coordination between these two primary and sensitive stakeholders. Thus, from the point of view of stakeholder management, the project had a different type of complexity.
On the basis of the data related to project, the determinant scores provided by the project proponents in the baseline sheets as ratings on a scale of 0 to 10 were entered in the model after dividing the ratings by 10. This was done to normalize the scores to a 1/10th scale and was necessary because the overall complexity index is a score between 0 and 1. In order to maintain the complexity score in this range, it is necessary to reduce the ratings in baseline sheet to a similar scale. Figure 6 presents an overview of the results of the baseline phase.
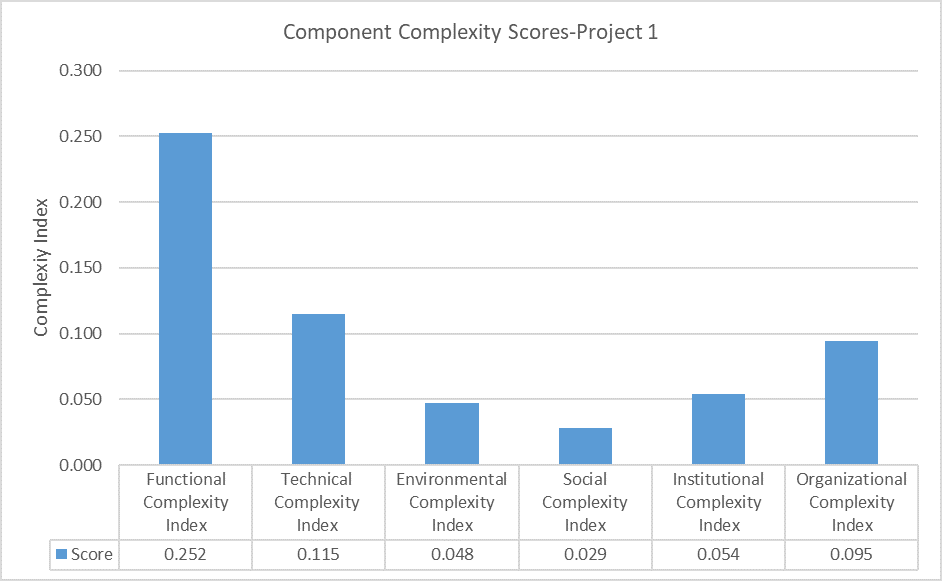
The overall project complexity index determined as a sum of component complexities works outs to be 0.593. Corresponding complexity types are as follows:
Complexity with respect scope = 0.368
Complexity with respect to context = 0.131
Complexity with respect to organization = 0.095
The results from the baseline phase show that the functional complexity has the maximum value among all and accounts for almost 43% of the total complexity in the project. This is in line with what one could have intuitively guessed from the details of the project as it was evident that most of the complexity must lie with respect to scope of the project, both in function and technical aspects. The project involved a number of new technologies and processes, had diverse and very sensitive stakeholders, had a lot of uncertainty in terms of final goals of the project due to sparring between two major stakeholders etc. and all these were bound to add to the respective complexities.
Even though the bare or absolute numbers in absence of benchmarks or target values do not provide many insights as to which areas need immediate attention, the indices still provide a relative scale of importance of areas that need more focused attention. Over some time, as already described in preceding paragraphs, this model can become a knowledge-based system so that appropriate benchmarks are available to compare the values.
5.1. Case Study 2: New Airport at Ajmer
The proposed project involves development of domestic airport spread over an area of 283 hectare which is to be constructed after the dismantling of existing airstrip which is not in working condition. The proposed project is located at a distance of 2km from Kishangarh towards the northwest direction.
The estimated cost of the project is ₹161 crores and was to be constructed in 36 months. The development plan includes 16 different work packages.
The project is a green-field airport project and does not involve too many technological innovations and is a general type of airport project for the project proponents who deal with airports projects extensively. Therefore, complexities with respect to scope are expected to be at reasonable levels. However, the project land acquisition has been a major problem due to the displacement of local population. As a result, the project had been going on getting delayed. This would mean that the value of contextual complexity ought to be more for this project and the same should be highlighted by the model.
Following the procedure similar to the one followed for case study 1, on the basis of the data related to project, the determinant scores provided by the project proponents in the baseline sheets as ratings on a scale of 0 to 10 were entered in the model after dividing the ratings by 10. This was done to normalize the scores to a 1/10th scale and was necessary because the overall complexity index is a score between 0 and 1. In order to maintain the complexity score in this range, it is necessary to reduce the ratings in baseline sheet to a similar scale. Figure 7 presents an overview of the results of the baseline phase for this case study.
The overall project complexity index determined as a sum of component complexities is determined to be 0.383 and corresponding complexity types are as follows:
Complexity with respect scope = 0.200
Complexity with respect to context = 0.120
Complexity with respect to organization = 0.063
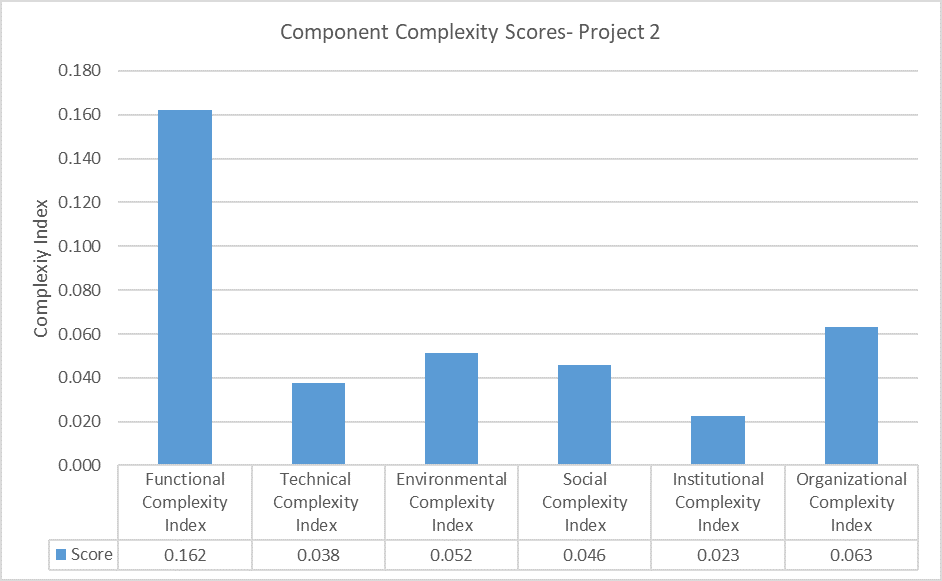
These results show that though the functional and technical complexity is lower as compared to project 1, they are still high as compared to other complexity components within this project. The complexity with respect to scope thus, is close to 0.2 which again accounts for around 40% of the total complexity of the project. Similarly, as anticipated, the environmental and social scores of this project are much higher than the project 1 and they account for more than 30% of the total complexity of the project. What appears to be slightly against intuition is that this value of complexity ought to have been the highest in this case as can be gathered from the project details. Instead scope complexity is yet again a major component of total complexity which was not expected given that project did not entail any new technologies or complex procedures. However, the reason for this becomes apparent on studying the baseline data sheet in which determinant scores against No. of elements, no. of stakeholders and urgency of schedule determinants are the highest. This indicates that the functional complexity is increasing on account of some different factors which are not immediately apparent from the general data usually available. Thus, it shows that the results from the model are robust and present a picture of complexity taking into account underlying factors too which are not apparent otherwise.
It is being again reiterated that the implications and the full potential of the model can only be realized when target scores are benchmarked so that phase 2 questions can be used to bring down the complexity values to target limits in case they are exceeding them. However, at the same time, it is clearly seen from the results of above two case studies that the model is capable of evaluating complexities across projects. It enables one to compare the projects across on complexity scale and will also be able to compare the same project for complexity score before and after interventions for improvements are made.
Therefore, it can be concluded that the model is robust and can be used to provide demonstrable results. The authors declare no conflict of interest.
6. Conclusion
This study tried to focus on identifying key parameters that can be used by industrial practitioners to measure the complexity of projects in the construction sector of India and using these determinants propose a model for evaluating the complexity quantitatively.
A number of factors affecting complexity in a project were identified from the literature. It was proposed that the entire complexity of a project can be attributed mainly to three types. One with respect to scope, second with respect to context and third with respect to Organization. These three types of complexities were further proposed to be composed of different components which formed the basic components of overall complexity too. The number of factors identified from literature were then grouped under each such component and were called the determinants of that component of complexity. Thus, an initial framework of complexity evaluation was proposed which consisted of twenty-three determinants of complexity grouped under seven components which were further organized under three main types of complexities explained above.
To have the framework validated through experts in projects a consensus building exercise was carried out through a Delphi Study. All 23 determinants were framed in the form of a questionnaire and were given to experts for rating each one of them on an importance scale of 1 to 5. The final analysis of results of the Delphi study resulted in a reduction of the number of determinants from 23 to 21. Further, using the results of the Delphi study, the mean ranks of determinants were calculated in SPSS and the corresponding weightage of each determinant in the overall framework of complexity evaluation was determined. Thus, a final framework of evaluation of complexity was proposed.
Using this framework, a model for evaluating the overall complexity of a project using a single index was derived and presented in a form of an equation and was called Project Complexity Index. The project complexity index was determined as a sum of individual component complexities which were in turn derived in the form of equations from the final framework.
This index could be used for any project in India for obtaining a single score which could be used for determining its complexity. The index may also be used for comparing two projects and can assist organizations in setting target maximum component complexities that can be handled and shall also highlight the areas that need interventions to reduce that particular complexity with the purpose of managing this complexity in a better way.
In order to demonstrate the application of this framework in the Indian construction sector, two case studies of similar public infrastructure projects were examined. Using a set of questions, quantifiable values were obtained for each determinant of complexity.
Finally using the component complexity indices equations, component complexities were determined which were further added to determine the overall complexity of the project which clearly indicated that on an overall basis project 1 was more complex to handle than project 2 and thus needed specific interventions to manage this complexity. The model made it possible to evaluate the complexity as well as compare two projects against each component of complexity thereby indicating that the framework was robust.
7. Limitations and Future Research
This study proposed a simple model for evaluating complexity in a construction project in Indian context. The model is a result of the combination between practical construction industry experts’ and academic experts’ points of view. The model provides a great deal of flexibility by which it can be modified to suit the individual requirements of each organization as the method of determining the scores of determinants can be decided by individual organizations based on their internal procedures and processes.
At the same time the study can further be improved to mitigate the following limitations:
- The model can be used more effectively if target maximum values of overall complexity as well as complexities of various types are established and benchmarked. Methodology for carrying out such a benchmarking was not in the scope of this study and may be taken up further.
- The application of the model has been demonstrated on a limited number of case studies and that too only for ascertaining the baseline values of complexity at the initial stage of project lifecycle (for the reasons already enumerated in this report at relevant places). More number of cases studies may be taken up for study to demonstrate the application of model at various stages of life cycle of project. The above-mentioned limitations can be taken up for further research and study.
- D. Baccarini, “The concept of project complexity – A review”, International Journal of Project Management, vol. 14, no. 4, pp. 201–204, 1996, doi:10.1016/0263-7863(95)00093-3.
- A. Mills, “A systematic approach to risk management for construction”, Structural Survey, vol. 19, pp. 244–252, 2001.
- J. Mullholand, B., Christian, “Risk assessment in construction schedules”, Journal of Construction Management, vol. 99, pp. 8–15, 1999.
- E. F. Lifson, M.F; Shaifer, Decision and Risk Analysis for Construction ManagementChichester, , Wiley, 1982.
- S. Bertelsen, “Complexity – Construction in a New Perspective”, International Group of Lean Construction, pp. 12, 2003.
- L.-A. Vidal, F. Marle, J. Bocquet, “Modelling Project Complexity”, International Conference in Engineering Design, ICED ’07, no. August, pp. 1–10, 2007.
- A. Leung Wing Tak, “Classification of building project complexity and evaluation of supervisory staffing patterns using cluster and factor analysis techniques”no. September, pp. 577, 2007.
- G. Little et al., “A feature complexity index”, Proceedings of the Institution of Mechanical Engineers, Part C: Journal of Mechanical Engineering Science, vol. 212, no. 5, pp. 405–412, 1998, doi:10.1243/0954406981521321.
- P. A. Corning, ““The synergism hypothesis”: On the concept of synergy and its role in the evolution of complex systems”, Journal of Social and Evolutionary Systems, vol. 21, no. 2, pp. 133–172, 1998, doi:10.1016/S1061-7361(00)80003-X.
- C. Van Dijkum, “From cybernetics to the science of complexity”, Kybernetes, vol. 26, no. 6–7, pp. 725–737, 1997, doi:10.1108/03684929710169898/FULL/XML.
- T. Williams, Modelling Complex Projects, John Wiley & Sons Ltd, 2002.
- Alan Wild, “The unmanageability of construction and the theoretical psycho-social dynamics of projects,” Engineering, Construction and Architectural Management, vol. 9, no. 4, . MCB UP Ltd, : 345–351, 2002.
- B. Xia, A. P. C. Chan, “Measuring complexity for building projects: a Delphi study”, Engineering, Construction and Architectural Management, vol. 19, no. 1, pp. 7–24, 2012, doi:10.1108/09699981211192544.
- S. Sinha, B. Kumar, A. Thomson, “Measuring Project Complexity: A Project Manager’s Tool”, http://dx.doi.org/10.1080/17452007.2006.9684615, vol. 2, no. 3, pp. 187–202, 2011, doi:10.1080/17452007.2006.9684615.
- A. Halder, “Exploring complexity of project governance in Indian megaprojects: A social network analysis approach,” Proceedings of 3rd International Conference on Construction, Real Estate, Infrastructure and Project Management (ICCRIP) 2018, vol. 1, no. 1, . 2018.
- S. Pritesh, B. A. Konnur, “Interface Management and its Effect on Project Complexity in Construction Management”, International Research Journal of Engineering and Technology, 2019.
- H. L. Wood, “T Itle Page Modelling Project Complexity At the Pre Construction Stage”no. October, 2010.
- A. Ahmadi, M. Golabchi, “Complexity Theory in Construction Project Time Management”, International Research Journal of Applied and Basic Sciences, vol. 6, no. 5, pp. 538–542, 2013.
- S. Bertelsen, L. Koskela, “Approaches To Managing Complexity in Construction Project Production”, Construction, pp. 1–13, 2005.
- R. N. Nkado, “Construction time-influencing factors: The contractor’s perspective”, Construction Management and Economics, vol. 13, no. 1, pp. 81–89, 1995, doi:10.1080/01446199500000009.
- K. R. Molenaar, A. D. Songer, “Model for Public Sector Design-Build Project Selection”, Journal of Construction Engineering and Management, vol. 124, no. 6, pp. 467–479, 1998, doi:10.1061/(ASCE)0733-9364(1998)124:6(467).
- P. W. Simon Austin, Andrew Newton, John Steele, “Modelling and Managing Project Complexity”, International Journal of Project Management, vol. 20, no. 3, pp. 191–198, 2002.
- A. P. C. Chan, A. P. L. Chan, “Key performance indicators for measuring construction success”, Benchmarking: An International Journal, vol. 11, no. 2, pp. 203–221, 2004, doi:10.1108/14635770410532624.
- T. Burns, G. . Stalker, The Management of InnovationLondon, , Tavisotck, 1965.
- P. Malzio et al., “Design Impact of Construction Fast-track”, Journal of Construction Management and Engineering, vol. 5, pp. 195–208, 1988.
- C. Perrow, “Analysis of Goals in Complex Organizations”, American Sociological Review, vol. 26, pp. 854–866, 1961.
- N. Pippenger, “Complexity Theory”, Scientific American, vol. 238, no. 6, pp. 114–125, 1978.
- W. P. Hughes, C. Gray, J. R. Murdoch, “Specialist Trade Contracting: Report.” London, 1997.
- S. Sinha, A. I. Thomson, B. Kumar, “A complexity index for the design process”, WDK Publications, no. June, pp. 157–163, 2001.
- J. R. Turner, R. A. Cochrane, “Goals-and-methods matrix: coping with projects with ill defined goals and/or methods of achieving them”, International Journal of Project Management, vol. 11, no. 2, pp. 93–102, 1993, doi:10.1016/0263-7863(93)90017-H.
- J. Kallinikos, “Organized complexity: posthumanist remarks on the technologizing of intelligence”, Organization, vol. 5, no. 3, pp. 371–396, 1998.
- J. T. Luhman, D. M. Boje, “What is complexity science? A possible answer from narrative research”, Emergence, A Journal of Complexity Issues in Organizations and Management, vol. 3, no. 1, pp. 158–168, 2001.
- H. Maylor, R. Vidgen, S. Carver, “Managerial complexity in project-based operations: A grounded model and its implications for practice”, Project Management Journal, vol. 39, no. 1\_suppl, pp. S15–S26, 2008.
- L. Crawford, “Senior management perceptions of project management competence”, International Journal of Project Management, vol. 23, no. 1, pp. 7–16, 2005, doi:10.1016/j.ijproman.2004.06.005.
- S. Gul, S. Khan, “Revisiting Project Complexity: Towards a Comprehensive Model of Project Complexity.”, International Proceedings of Economics …, vol. 15, 2011.
- K. Remington, J. Pollack, “Tools for Complex Projects. Gower Publishing company”, aldershott, UK, 2007.
- K. Remington, R. Zolin, R. Turner, “A Model of Project Complexity : Distinguishing dimensions of complexity from severity”, The 9th International Research Network of Project Management, no. October, pp. 11–13, 2009.
- I. B. Dunović, M. Radujković, K. A. Škreb, “Towards a New Model of Complexity – The Case of Large Infrastructure Projects”, Procedia – Social and Behavioral Sciences, vol. 119, pp. 730–738, 2014, doi:10.1016/J.SBSPRO.2014.03.082.
- G. Santana, “Classification of Construction Projects by Scales of Complexity”, International Journal of Project Management, vol. 8, no. 2, pp. 102–104, 1990.
- M. A. Jolson, G. L. Rossow, “The Delphi Process in Marketing Decision Making”, Journal of Marketing Research, vol. 8, no. 4, pp. 443, 1971, doi:10.2307/3150234.
- L. A. Vidal, F. Marle, J. C. Bocquet, “Measuring project complexity using the Analytic Hierarchy Process”, International Journal of Project Management, vol. 29, no. 6, pp. 718–727, 2011, doi:10.1016/j.ijproman.2010.07.005.
- H. Senter, “Applied Linear Statistical Models (5th ed.). Michael H. Kutner, Christopher J. Nachtsheim, John Neter, and William Li”, Journal of the American Statistical Association, vol. 103, pp. 880–880, 2005.