Factorial Analysis to Categories Spread and Effect of Ebola Virus from Various Countries

(This article belongs to the Section Statistics & Probability (STP))
Export Citations
Cite
Paritala, V. and Thummala, H. (2022). Factorial Analysis to Categories Spread and Effect of Ebola Virus from Various Countries. Journal of Engineering Research and Sciences, 1(6), 1–6. https://doi.org/10.55708/js0106001
Venu Paritala and Harsha Thummala. "Factorial Analysis to Categories Spread and Effect of Ebola Virus from Various Countries." Journal of Engineering Research and Sciences 1, no. 6 (June 2022): 1–6. https://doi.org/10.55708/js0106001
V. Paritala and H. Thummala, "Factorial Analysis to Categories Spread and Effect of Ebola Virus from Various Countries," Journal of Engineering Research and Sciences, vol. 1, no. 6, pp. 1–6, Jun. 2022, doi: 10.55708/js0106001.
The main objective of this research analyze and correlates the number of cases and death rates reported on the Ebola virus in many countries. Ebola virus is one of the most lethal diseases to infect humans. This approach Proceeding uses the Factorial analysis technique in the Ebola Virus dataset. This method takes the largest common variance from all criteria and combines it into a single score. The analysis is applied to reported and categorize the most effective way countries using the counts of cases and deaths. To this investigate get it, and communicate data in a way of graphic factual properties. The analytic results on the Ebola virus dataset are not accessible anywhere. The Analysis was done by R Studio.
1. Introduction
Ebola virus is also called Ebola hemorrhagic fever. This virus leads to bleeding and calamitous consequence on organ failure which leads to death in several countries. The virus spread from fruit bats accidentally its admittance into the human inhabitants through various contact such as selection of organs and body fluids contaminate animals like monkey, forest antelope porcupine, etc[1]. Ebola spread through human-to-human by-way-of unclean needles touching a contaminated surface and through saliva [2]. The Ebola virus is the impact on the social human development and Lades to the crisis on education, health, economy, and quality of the living system [3]. This crisis eventually carries and differ in several countries. The virus is rapidly increasing in several countries the degree of fear, concern increased inside the people [4]. Mostly the pathogenic doctors of USA they create the awareness within the children, adults threw this virus.
The virus is highly affected in many nations, it is not always the case that the server has the highest death rate [5]. Later global great effect on scientific, economical and sociological. The fundamental aim in maximum of this research is to track and count on how the virus will circulate throughout the country. Researchers have worked difficult to estimate how long the outbreak would remain [6]. As a result, many studies organizations have used numerous modeling techniques for prediction and feature provide you with many intriguing conclusions [7]. The main aim of this research study is to investigate the correlations between the number of Ebola cases and the number of fatalities caused by the disease in several nations that have been badly affected by this pandemic epidemic. To begin, the correlation coefficients are computed to discover the links between these nations. The factor analysis is then used to classify these nations based on the number of cases and fatalities.
2. Materials and Methods
Whatever the study design, the effect of Ebola should first be described (description). For example, Positive and Death cases can be given as the mean value, Coefficient Correlation and standard deviation (for normal distribution), or as the median and range, or in a histogram. Studies on Effect of Ebola Virus in Various Countries also examine influence factors such as Death rate status and annual affect. These variables should be included in the analysis, as they may be risk factors for Ebola Virus and are potential confounders [8]. Risk factors may also be effect modifiers. Effect modification means that the influence of one factor (for example, Ebola Virus) on a Positive cases (for example, death rate ) is modified by the presence of another factor (for example, Annual impact ). In other words, there is an interaction between the two factors. The effects should be examined in different subgroups (stratification), each with the same analysis.
Factor analysis is a statistical method applied to the Ebola virus dataset it initial set of input variables that are cases, deaths, and country to have mutual correlations to find a smaller set of factors that describe the underlying interrelationships and mutual variability [9]. On a co-variance data matrix, the function conducts maximum-likelihood factor analysis. The argument factors provide the number of elements to be fitted.
2.1. Datasets
This study, count the number of cases and number of Deaths due to Ebola virus reported in Guinea, Congo, Italy, Spain, UK, USA, Senegal, Mali, Nigeria, Sierra Leona, Liberia, Guinea, Uganda, Sudan, Gabon, South Africa (ex-Gabon) and Cote from the start the year of 1976 to 2021 to be considered. This investigation is to estimate Ebola virus potential dispersion with an accentuation of the number of positive unused occasions, mortality rate and recuperations. Information retrieve from the World Health Organization [10]. This dataset contains information about 41 instances of positive and 41 are negative instances, 6 attributes are comprised of every record, which all are numeric values. The Ebola virus dataset parameter observed in Table 1.
Table 1: Dataset Parameter Description
S. No | Description |
1 | Year |
2 | Country |
3 | Ebola virus species |
4 | Cases |
5 | Deaths |
6 | Case fatality |
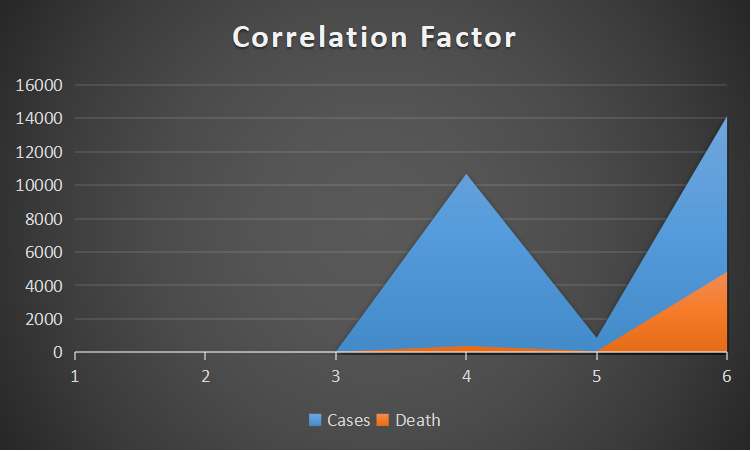
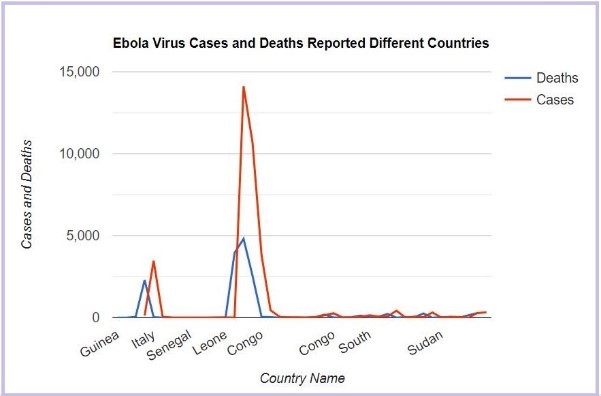
It can be observed that cases and deaths present minimum in Guinea and maximum present in Congo due to the Ebola virus [11]. The plots for the counts of the cases with the Ebola virus and the deaths due to it are also demonstrated in Figure 1. The relationships between the rates of the positive cases, death, and spread of Ebola among these countries have been studied using coefficient correlation by the factors, it examines associations between variable measurements to understand how the variables themselves group together and are related. It can be seen in Table 2 that the rate of cases, death, and spread of the virus in various countries is very strong [12]. In order of correlation factor observer in the overall analysis of 1 quality and 3 rd quality of arithmetic means and median of cases and deaths due to Ebola virus [13]. It also observes the minimum and maximum rofe in the effect of the virus. The order of analysis cases reported in countries in cumulative total Minimum reports is 0 and Maximum is 14124 the death.
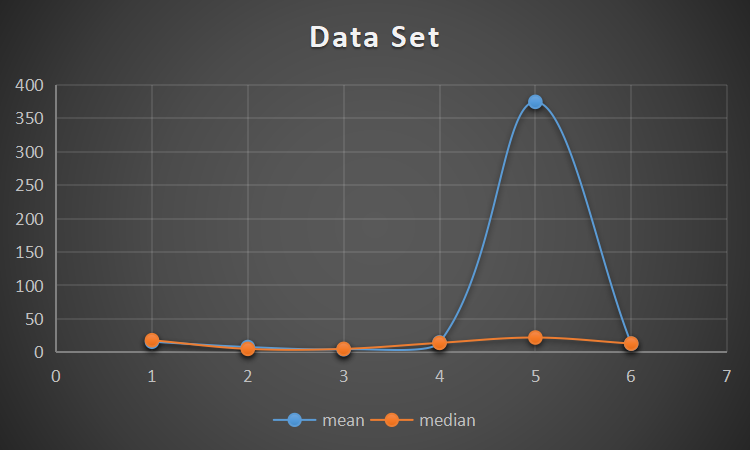
Table 2: Mean and Median for the number of cases and deaths due to Ebola Virus
Correlation Factor 1 | Cases | Death | |
Min | 0 | 0 | |
1st Quality | 4 | 1 | |
Median | 34 | 22 | |
Mean | 10675 | 374.5 | |
3rd Quality | 857.5 | 55 | |
Maximum | 14124 | 4809 |
2.2. Factorial Analysis Model
Factor analysis is a method for condensing a large number of variables into a smaller number of components [14]. This method takes the largest common variance of all variables and combines them into a single score, as shown in Table 3. We may use this score as an index of all variables for future investigation [15]. Exploratory factor analysis (EFA) is a technique for determining a measures factor structure and assessing its internal reliability [16]. When researchers have no theories regarding the nature of the underlying factor structure of their measure, EFA is frequently advised. The goal of this study is to determine the primary factors that affect the Ebola virus data set. An objective strategy incorporating multiple methodologies (statistics, R, GIS, descriptive analysis, and graphical visualization) was used to examine such a complex algorithm [17, 18]. FA is concerned with the correlations of variables so that the variables within a factor are highly linked with one another, while the variables within distinct factors are substantially uncorrelated [19]. Remember the core premise behind the factor analysis before interpreting the findings. To isolate the variables underlying commonality, factor analysis builds linear combinations of components. Fewer factors represent the majority of the variation in the data set to the degree that the variables have an underlying commonality [19]. This lets us describe an underlying nation in a model by aggregating a large number of observable variables, making the data easier to grasp. Our data variability, XX, is provided by, and its estimate is made up of the variability described by Σ variables explained by a linear combination of factors (commonality) and the variability that cannot be explained by a linear combination of factors (uniqueness).
$$\Sigma = XX^\top + \Psi \tag{1}$$
To, calculates an initial estimate of S−Ψ and factors S−Ψ^S−Ψ^, or R−Ψ^R−Ψ^ for the equivalence array. Regrouping the estimated co-variance and equivalence array with the estimated XX array yields:
$$S – \Psi = X \quad \quad X = S – \Psi \quad \quad R – \Psi = X \tag{2}$$
where S is a pp x 1 vector of observed variable scores, R is a p x q matrix of factor loading’s , Ψ is a qq x 1 vector of common factor scores and Σ is a p x 1 vector of unique factor scores.
The S−Ψ^i or R−Ψ^i. Ψ^Ψ^i is a diagonal array is the principal component technique, the h^2ih^i2, is equal to S−Ψ^i for S−Ψ^S−Ψ^ and 1−ψ^i1−ψ^i for R−Ψ^R−Ψ^. The correlation of HH or RR is replaced by their respective commonalities in ψ^iψ^i which gives us the following forms:
$$S – \Psi^i = \begin{bmatrix} h1, i1, s1 \\ s2, h2, i2 \\ i3, s3, hp \end{bmatrix} \tag{3}$$
$$R – \Psi^i = \begin{bmatrix} h1, r1, r12 \\ r2, h2, r21 \\ r3, \ldots, hp \end{bmatrix} \tag{4}$$
The squared multiple correlations between the observation vector of 1 and the other h variables are used to make an initial estimate of the commonalities. In the instance of r, the squared multiple correlations are comparable to the following:
$$h = 1 – \frac{1}{r} \tag{5}$$
3. Result
This segment reports the consequences of the Factorial analysis way to deal with several cases and deaths along with number of nations dependent on exploration the factors annual as observed in Table 5. It must be mentioned the number of primary factors in FA was computed the number of eigenvectors of the correlation matrix with greater affinity than one. Furthermore, the P values were greater than 0.8 as shown in Table 4, confirming the speed of the FA technique. Bartlett’s test using Ebola virus dataset to confirm the value is p-value = 0.05, Then the data set is suitable for normally distributed. The Analysis was done by R Studio.
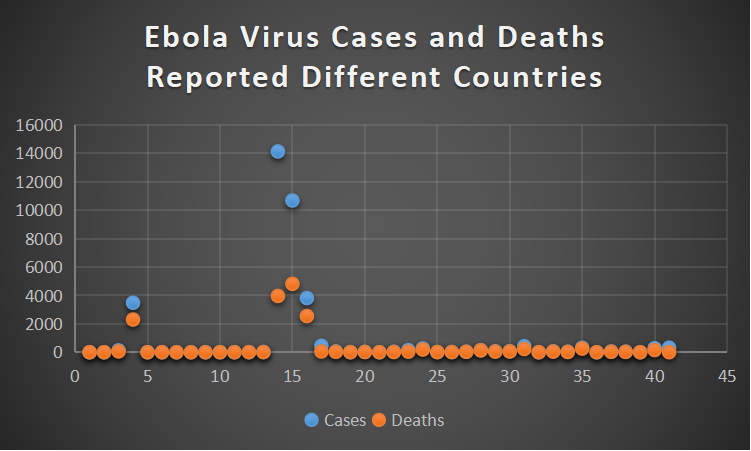
Table 3: Calculate the Factorial classification of positive cases and deaths due to Ebola in various countries.
Country | Cases | Deaths |
Guinea | 1.0000 | 1.00000 |
Democratic Republic of the Congo | 6.47219 | 2.00000 |
Democratic Republic of the Congo | 2.3171 | 3.00000 |
Democratic Republic of the Congo | 4.0304 | 4.00000 |
Democratic Republic of the Congo | 1.0000 | 5.00000 |
Italy | 1.0000 | 6.00000 |
Spain | 1.00000 | 7.00000 |
UK | 2.40001 | 8.00000 |
USA | 1.00000 | 9.00000 |
Senegal | 4.03004 | 1.00001 |
Mali | 2.43018 | 1.10001 |
Democratic Republic of the Congo | 4.05076 | 1.20001 |
Democratic Republic of the Congo | 5.04003 | 1.30001 |
Uganda | 6.20023 | 1.40001 |
Uganda | 1.00000 | 1.50001 |
Uganda | 2.63035 | 1.60001 |
Democratic Republic of the Congo | 3.810260 | 1.70001 |
Democratic Republic of the Congo | 4.79008 | 1.80001 |
Congo | 3.56014 | 1.90001 |
Sudan | 1.03040 | 2.00001 |
Congo | 3.850247 | 2.10001 |
Congo | 1.39080 | 2.20001 |
Congo | 8.25090 | 2.30001 |
Uganda | 1.00000 | 2.40001 |
South Africa (ex-Gabon) | 8.32081 | 2.50001 |
Gabon | 8.22033 | 2.60001 |
Democratic Republic of the Congo | 1.00000 | 2.70001 |
Côte d’Ivoire | 8.07067 | 2.80001 |
Gabon | 2.95038 | 2.90001 |
Sudan | 1.00000 | 3.00001 |
Table 4: Validation of p factor and accuracy of factorial analysis in cases and deaths due to ebola virus
SI.No | Q1 | Q2 | Q3 | Parameters |
MSA | 0.8 | 0.8 | 0.8 | Cases |
MSA | 0.8 | 0.8 | 0.8 | Deaths |
MSA | 0.8 | 0.8 | 0.8 | Case fatality |
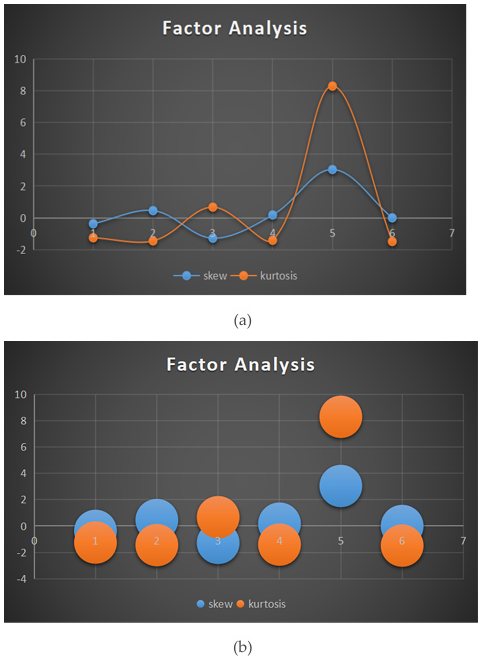
Table 5: Ebola virus spread of cases and deaths correlated by the annual
Name | vars | n | Mean | sd | median | trimmed | mad | min | max | range | skew | kurtosis | se |
Year* | 1 | 41 | 15.7317 | 7.79430 | 18 | 16.06060 | 7.413 | 1 | 27 | 26 | -0.37170 | -1.25495 | 1.217266 |
Country* | 2 | 41 | 7.78048 | 5.71188 | 5 | 7.515152 | 4.4478 | 1 | 18 | 17 | 0.45374 | -1.45162 | 0.892046 |
Ebola virus species* | 3 | 41 | 4.43902 | 1.14124 | 5 | 4.606061 | 0 | 1 | 6 | 5 | -1.28130 | 0.67151 | 0.178232 |
Cases* | 4 | 41 | 14.6585 | 10.9718 | 14 | 14.18181 | 14.826 | 1 | 33 | 32 | 0.18049 | -1.41134 | 1.713507 |
Deaths | 5 | 41 | 374.487 | 1061.42 | 22 | 52.93939 | 32.617 | 0 | 4809 | 4809 | 3.03906 | 8.29111 | 165.7670 |
Case.fatality.* | 6 | 41 | 12.7804 | 8.83604 | 13 | 12.63636 | 11.860 | 1 | 27 | 26 | 0.00049 | -1.48798 | 1.379957 |
3.1. Cumulative number of deaths due to Ebola virus
Figure 5 shows the results of using the FA approach to categorize the increasing mortality rate in several nations based on the cumulative counts of Ebola virus deaths. The outputs show the statistical differences in the mortality rates associations.
4. Conclusion
Ebola Virus is still an unclear infectious disease, the outbreak spreads are largely influenced by each country’s policy and social responsibility. As data transparency is crucial inside the government, it is also our responsibility not to spread unverified news and to remain calm in this situation. In the fight against the Ebola virus, understanding preventative measures, population mobility, viral propagation. The study has shown the importance of information dissemination that can help to identify the most affected countries and its improving response time and help planning in advance to help reduce risk. Further studies need to be done to help contain the outbreak as soon as possible.
Because the Ebola virus has several effects on the environment, health, society, and economy, it is critical to investigate the spread of disease transmission to compare it across nations. The objectives of this paper were to research Ebola cases and deaths caused by this pandemic disease in different countries that have been significantly affected by it. The count number of cases and mortality due to Ebola virus reported in Guinea, Congo, Italy, Spain, UK, USA, Senegal, Mali, Nigeria, Sierra Leon, Liberia, Guinea, Uganda, Sudan, Gabon, South Africa (ex-Gabon), and Cote from the start the year of 1976 to 2021 to be considered. To begin, the correlation coefficients were calculated to discover the links between these nations. The results revealed that the number of positive cases and death rates in different nations had substantial positive associations.
The factor analysis was done the count of positive cases and mortality rate. In the perspective of Ebola virus cases, Congo, Liberia, and Italy were distributed similarly to one another but different from other nations as shown in Figure 6. Meanwhile, for deaths, Ongo, Leone, and Italy were distributed similarly to one other but different from other nations. In a future study, the authors propose classifying Ebola virus datasets from more countries using the FA approach or applying this technique to categorize locations for other epidemic or pandemic illnesses.
Conflict of Interest
The authors state that they do not have any conflict of interest.
Authors’ contributions
Both authors have an equal contribution.
Acknowledgment
We thank Agri IT Solutions for technical assistance.
- Kourtis AP, Appelgren K, Chevalier MS, McElroy A. Ebola Virus Disease: Focus on Children. Pediatr Infect Dis J. 2015 Aug;34(8):893-7. doi: 10.1097/INF.0000000000000707
- Burke RM, Midgley CM, Dratch A, et al. Active Monitoring of Persons Exposed to Patients with Confirmed COVID-19 — United States, January–February 2020. MMWR Morb Mortal Wkly Rep 2020;69:245–6. https://doi.org/10.15585/mmwr. mm6909e1.
- Hunter DJ. Covid-19 and the stiff upper lip—the pandemic response in the united kingdom. N Engl J Med 2020.
- Razai MS, Doerholt K, Ladhani S, Oakeshott P. Coronavirus disease 2019 (covid-19): a guide for UK GPs. BMJ. 2020 Mar 5;368:m800. doi: 10.1136/bmj.m800.
- Lillie PJ, Samson A, Li A, Adams K, Capstick R, Barlow GD, Easom N, Hamilton E, Moss PJ, Evans A, Ivan M, Phe Incident Team, Taha Y, Duncan CJA, Schmid ML, The Airborne Hcid Network. Novel coronavirus disease (Covid-19): The first two patients in the UK with person to person transmission. J Infect. 2020 May;80(5):578-606. doi: 10.1016/j.jinf.2020.02.020. Epub 2020 Feb 28. PMID: 32119884; PMCID: PMC7127394.
- Ahmad, F., Jhajj, A. K., Stewart, D. E., Burghardt, M., & Bierman, A. S. (2014). Single item measures of self-rated mental health: A scoping review. BMC Health Services Research, 14(1), 398. https://doi.org/10.1186/1472-6963- 14-398.
- Ahorsu, D. K., Lin, C. Y., Imani, V., Saffari, M., Griffiths, M. D., & Pakpour, A. H. (2020). The fear of COVID-19 Scale: Development and initial validation. International Journal of Mental Health and Addiction. https://doi.org/ 10.1007/s11469-020-00270-8.
- Arbuckle, J. L. (2014). IBM SPSS AMOS 23 user’s guide. IBM.
- Arpaci, I., Karatas¸, K., & Baloglu, M. (2020). The development and initial tests for the psychometric properties of the COVID-19 Phobia Scale (C19P-S). Personality and Individual Differences, 164, 110108. https://doi.org/10. 1016/j.paid.2020110108.
- Ming H, Abuja N, Kriegman D: Face detection using mixtures of linear subspaces. Proceedings Fourth International Conference on Automatic Face and Gesture Recognition 2000, 4:70-76.
- Aguilar O, West M: Bayesian dynamic factor models and portfolio allocation. Journal of Business and Economic Statistics 2000, 18:338-357.
- Mohammad Reza Mahmoudi, Dumitru Baleanu, Shahab S. Band,Amir Mosavi, Factor analysis approach to classify COVID-19 datasets in several regions.
- Murat Yıldırım & Abdurrahim Güler (2020): Factor analysis of the COVID-19 Perceived Risk Scale: A preliminary study, Death Studies.
- Ressing M, Blettner M, Klug SJ. Data analysis of epidemiological studies: part 11 of a series on evaluation of scientific publications. Dtsch Arztebl Int. 2010 Mar;107(11):187-92. doi: 10.3238/arztebl.2010.0187. Epub 2010 Mar 19. PMID: 20386677; PMCID: PMC2853157.
- Jacob ST, Crozier I, Fischer WA 2nd, et al. Ebola virus disease. Nat Rev Dis Primers. 2020;6 (1):13. Published 2020 Feb 20. DOI: 10.1038/s41572-020-0147-3.
- Zhe Zhang, Dan Li, Xiaotong Wang,Yunpeng Wang, Jingyi Lin, Shen Jiang, Zheng Wu, Yingying He, Xin Gao, Zhuo Zhu, Yanlong Xiao, Zhangyi Qu, Yang Li. (2022) Rapid detection of viruses: Based on silver nanoparticles modified with bromine ions and acetonitrile. Chemical Engineering Journal 438, 135589.
- Luo Y, Wu J, Lu J, Xu X, Long W, Yan G, Tang M, Zou L, Xu D, Zhuo P, Si Q, Zheng X. Investigation of COVID-19-related symptoms based on factor analysis. Ann Palliat Med. 2020 Jul;9(4):1851-1858. doi: 10.21037/apm-20-1113. Epub 2020 Jun 22. PMID: 32576016.
- Cori A, Donnelly CA, Dorigatti I, et al. Key data for outbreak evaluation: building on the Ebola experience. Philos Trans R Soc Lond B Biol Sci. 2017;372(1721):20160371. doi:10.1098/rstb.2016.0371.
- Feldmann, H., Jones, S., Klenk, HD. et al. Ebola virus: from discovery to vaccine. Nat Rev Immunol 3, 677–685 (2003). https://doi.org/10.1038/nri1154.