Advanced Medical Telemonitoring for the Suspected Cases of Covid-19 Virus
(This article belongs to the Section Health Care Sciences and Services (HCS))
Export Citations
Cite
Touil, M. , Bahatti, L. and Magri, A. E. (2022). Advanced Medical Telemonitoring for the Suspected Cases of Covid-19 Virus. Journal of Engineering Research and Sciences, 1(7), 38–43. https://doi.org/10.55708/js0107006
Mohamed Touil, Lhoussain Bahatti and Abdelmounime El Magri. "Advanced Medical Telemonitoring for the Suspected Cases of Covid-19 Virus." Journal of Engineering Research and Sciences 1, no. 7 (July 2022): 38–43. https://doi.org/10.55708/js0107006
M. Touil, L. Bahatti and A.E. Magri, "Advanced Medical Telemonitoring for the Suspected Cases of Covid-19 Virus," Journal of Engineering Research and Sciences, vol. 1, no. 7, pp. 38–43, Jul. 2022, doi: 10.55708/js0107006.
Nowadays Corona Virus is threatening everyone, everywhere because it extremely dangerous. For many reasons; the first one it is a contagious virus, the second reason is there is no definite vaccination for that, because even some vaccinated people against Covid were affected. in the same regard this paper will present a telemedicine solution against Covid-19. the solution contains two parts. One is software, it represents a platform for real-time medical telemonitoring and also some important statistics are performed there. The other part is hardware, it lies on the usage of remote sensors like the temperature sensor the location sensor and so on, to acquire the vital parameters of the affected covid cases. And will have a wearable sensor network Also, there are many computers where we install the different parts of the platform in order to acquire patients’ data and performing statistical studies as well. For that purpose, the LabVIEW software is used to develop different interfaces. Those sensors are connected to the platform in a wireless method, and all data processing are performed on the computers. The proposed solution will manage the whole country because there are local servers and also a main server to perform statistics and help the government to make the proper decision for example total lockdown partial lockdown etc.
1. Introduction
So far Covid -19 affected a lot of people over the world, by the first of June 2022 the world situation known more than 500 million of affected cases, and more than 6 million of deaths. And during this period of time each country has made its proper decision. Inevitably there is a difference between countries. Because the number of affected cases depends on many things. The first one is the strategy of each country against Covid-19, the second one is the immunity system of each race of people and finally the conscience of people. the world organization (WHO) is publishing continuously a plenty of news every day. Consequently, we came to know that the symptoms start between 1 and 14 days of infection. And since that virus is contagious everyone can affect everyone. Hence the suspected case must stay away from other people for at least 14 days [1]. In this regard may researchers has performed many studies in the aim of fighting against Corona virus or at least reduce it spread. Some of them used predictive algorithm [2], others were trying to develop new vaccines [3] and so on.
In our paper we proposed a telemedicine platform for two aims, firstly to remote the vital parameters of the suspected and the affected cases by covid-19 using wearable sensors network handled by each suspected or infected case, secondly to manage the covid situation in terms of public authorities’ decision, in other words our platform will perform statistical analysis in real-time and everywhere in the country. And it will help the government to make the proper decision. The medical telemonitoring will significantly reduce the direct contact between the healthcare professional and the patient, then the infection will be reduced immediately. On the other hand, the suspected person can take the small device that contain sensors and leave the hospital after 30 minutes, and will be remotely monitored at home instead of staying in the hospital [4].
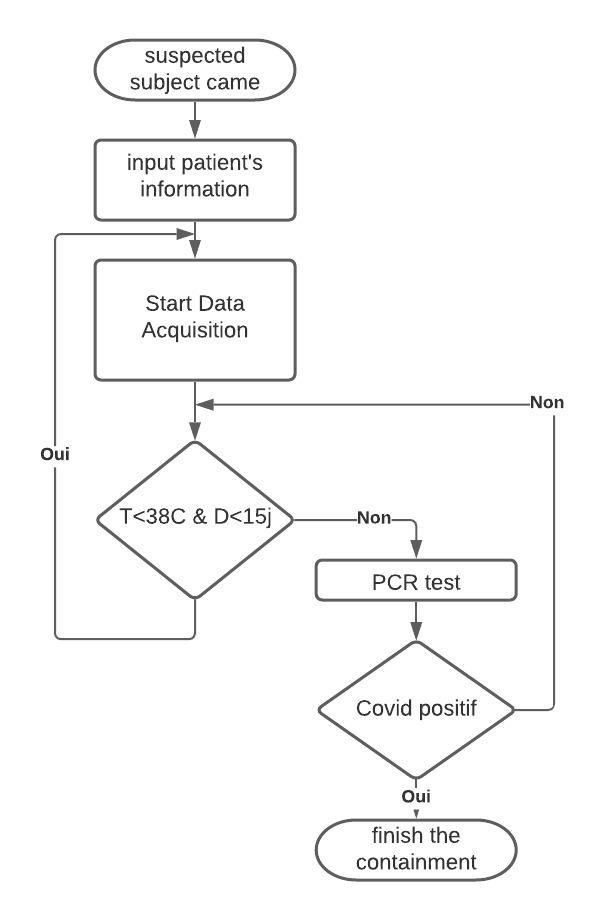
When the patient comes to the hospital, first must be isolated for a period of 14 days, if the temperature of that patient is increased during this period, the medical staff must perform the PCR test otherwise after 14 days they do it. If this patient is confirmed, then the healthcare staff must proceed with the drugs. And if the person is not confirmed after 14 days, he/she must leave the hospital, the figure below illustrates the diagram of the process of the patient inside the hospital.
Recently several researchers and engineers in science technology area started to perform a plenty of studies about wireless wearable sensors. The first application was in the industrial field such as the telemonitoring of industrial parameters. And the production line. And after those biomedical engineers moved to the medical telemonitoring of patient, by acquiring remotely the vital parameters like the Electrocardiogram (ECG), the human body temperature, the noninvasive pressure (NIP) etc. [5] [6]. and so far, the wearable sensors network became very powerful solution for the medical data monitoring. In the same regard our paper will mention about a digital platform to perform the medical telemonitoring of the suspected or the infected cases of covid-19. This platform allows us to also to perform statistics in real-time for lot of people in the same time and with different locations. This platform also is able to display the vital parameters of a specific patient and store all data in a main server. The vital parameters that will be monitored are decided as the main symptoms of corona virus.
Our paper will be organized as follow:
Section 1: is an introduction of the paper.
Section 2: describes the platform layout and details each part of this last.
Section 3: illustrates the proof of concept of our project.
Section 4: concerns result and the interpretation.
2. Platform Layout Description
To develop our platform, we used LabVIEW software to present different interfaces. because this is just a prototype otherwise, we need to consider about many things like the integrity of the medical data, the cybersecurity, medical data privacy etc. but our first aim remains the medical telemonitoring, the other features can be enhanced later.
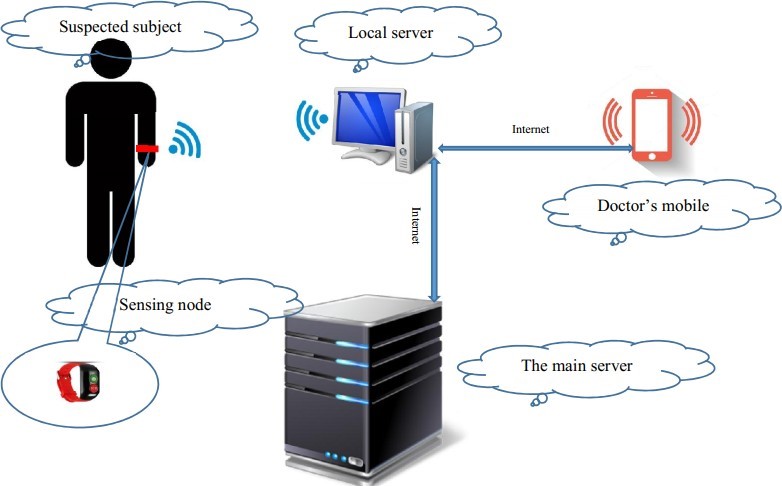
The figure 2 illustrates the architecture of the whole platform:
- The sensing node represent all the sensors such as temperature, ECG, location. That item acquires all values and sends them remotely to the local server in the hospital for the preprocessing, storing and sending to the main server afterwards.[6]
- The local server is the computer located in each hospital; it is responsible for the real-time analysis of all the acquired medical parameters. It detects the high temperature, the patient’s location if there are any changes. At the end of each period of time determined by the user will send all data and statistics to the main server. The doctor’s phone also will be notified from that local PC.
- The doctor or the healthcare professional in the hospital will receive the notification associated with the patient info is there is any abnormal parameter change. Immediately he will check the patient status and he will confirm the case from his mobile phone. After all the confirmations will be sent to the main server for statistical purposes.
- The main server has two important roles, firstly the statistical study for the whole country is being performed here. Secondly that main sever helps the public authority to make the right decision for citizens. If they can move and practice their daily activities without limit or some precautions must be taken.
And since corona virus is strongly contagious, our proposed platform will reduce extremely the direct contact in the hospital especial between doctors, healthcare professional and patients as well.
3. The Proof of Concept
To perform the proof of concept, we chose some didactic sensors some of them are certified but others no.
- NodeMcu for wireless data transmission [6].
- Temperature sensor DHT11 to acquire the human body temperature [7].
- Location sensor for tracking the patient.
- 2 Workstations as the local server and the main server.
- Cables for connecting the different items.
3.1. Materials Specifications
- DHT11 specifications is presented in Table 1.
Table 1: DHT11 Specifications
Specification | Value |
Resolution | 16 Bit |
Repeatability | ±1 °C |
Accuracy | 25°C ±2°C |
Response time | 1/e (63%) 10s |
Power supply DC | 3.3~5.5V |
- Workstations:
To carry out our prototype we used two laptops with the following spects: CPU: core™ i5-7200U 2.50GHz (4cpu); RAM: 8192Mo.
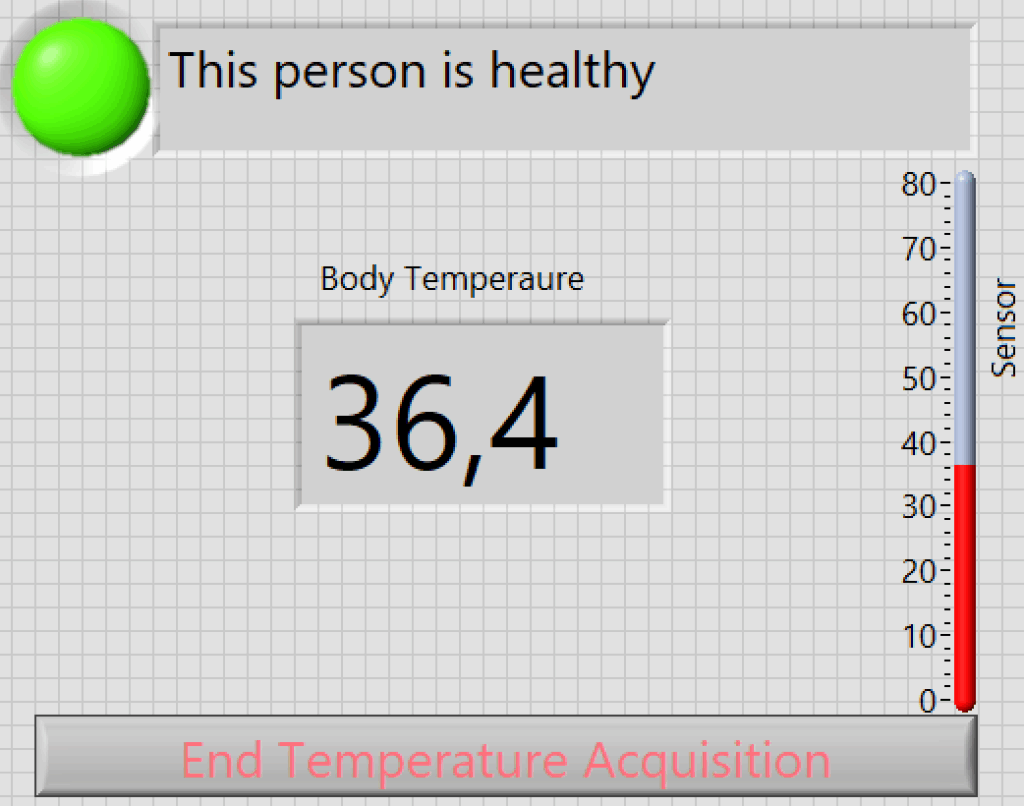
The figure (3) shows the simulation of the developed interface using LABVIEW with normal and abnormal temperature value.
3.2. Data processing algorithm
- Temperature processing
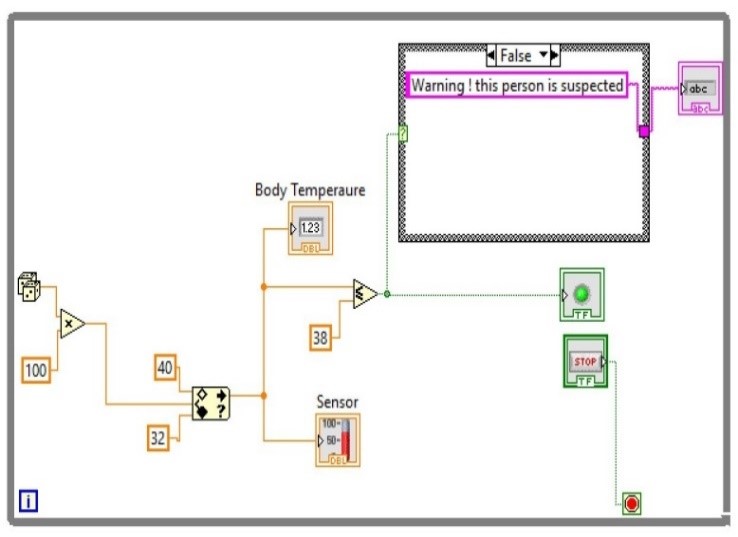
For the medical data processing there are three main phases, firstly data acquisition, in which we take the needed data but with all the measurements noises and artifacts, fortunately for temperature there is no possible artifacts if we measure from the proper region. Secondly data cleaning or denoising in order to remove all the artifact and keep only the useful part of the signal and the precision of this stage will significantly affect the quality of the next step. Thirdly data classification in this phase we check if the medical parameter is in the normal range or not. our focus in this section the human body temperature. The normal value of this last is 36.66, but this value is changing by the time [7] have performed one important study after several years they discovered that the average human body temperature is 36.11°C and not 36.66°C [7]. According to the CDC (centers for disease control and prevention) a person is considered has a fever when his/her temperature is greater than 38°C. so our platform calculation is taking 38°C as a threshold value. If the suspect case get a high temperature. The covid test must be performed immediately in order to confirm his infection.
The figure (3) illustrates the simulation of the developed algorithm with normal and abnormal temperature value
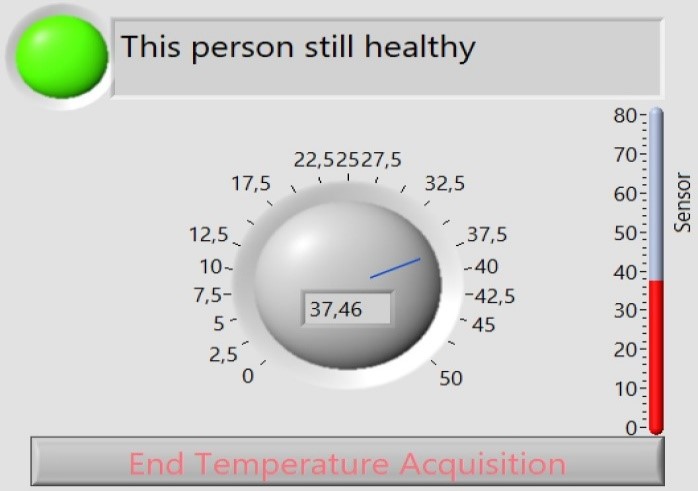
This patient’s body temperature is in the normal range so according to covid19 symptoms this subject is healthy.
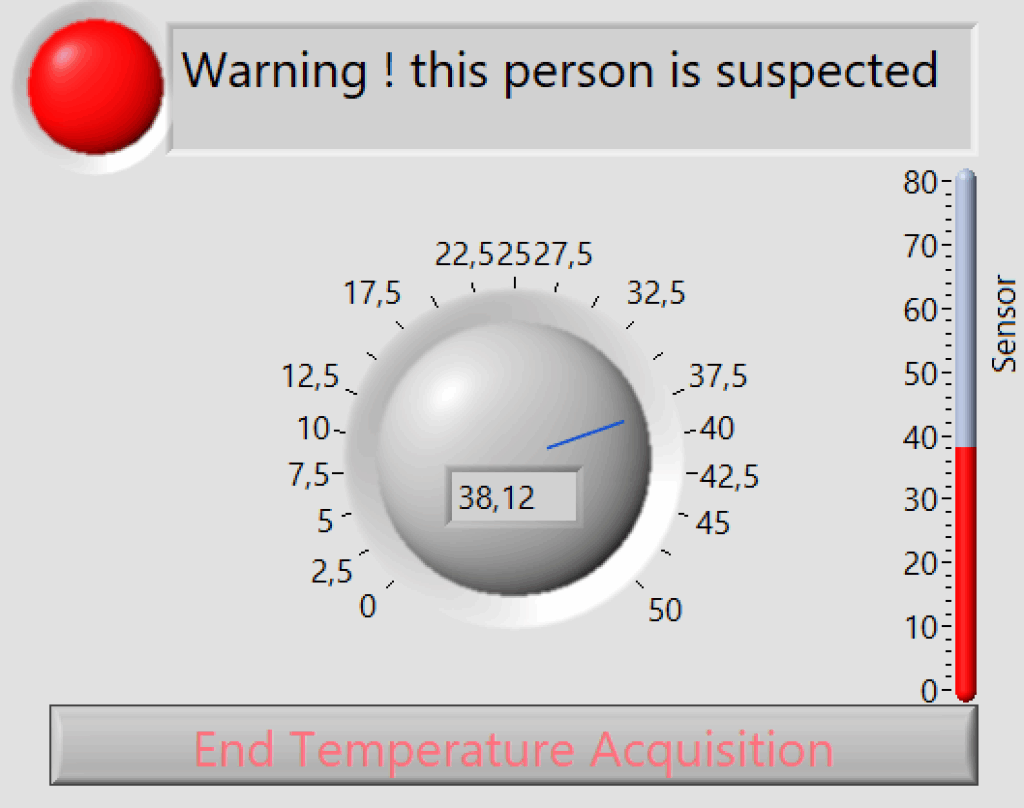
As described in the introduction section our aim is to detect the suspected cases affected by coronavirus. That is why when the person’s temperature is out of the normal range, other analysis must be done in order to be confirmed.
In the previous program, we change the temperature manually for simulation purpose. In bellowing figure (6) two programs are used MATLAB and LabVIEW and the temperature value is changes randomly in order to test the efficiency of our algorithm [8]. The generated values are used as the connected sensors to the platform.
In the platform database, our elements are the sensing nodes. Each node has the information below:
- The unique ID is the CIN/passport number,
- The patient name,
- The patient age,
- The patient’s condition.
3.3. Information system
In the information system the subject or the patient will be identified by three elements:
- The subject’s name
- The CIN/ passport number
- The patient’s location
According to the temperature changes, the subject will be confirmed as a covid19 suspected case or not, that is why this platform will communicate in real-time with the sensing node [8], in order to get the related parameters such as the location and the temperature.
As we are in the proof-of-concept step, “Thingspeak” cloud space is used for online temperature recording [9]. The figure bellow illustrates the recorded temperature using the NodeMcu module and temperature sensor [9].
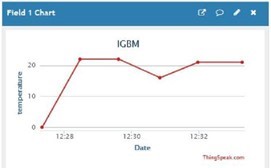
We used Thingspeak cloud space because at the same time, it allows us to collect data from different sensors [9] and analyze the collected data using MATLAB software. So, we can perform many statistical studies using the same platform, such as high temperature detection and the number of confirmed suspected persons, etc.
According to the temperature of each patient the bellowing table will be displayed on the main server [10].
Table 2: Local Server Data processing
CIN | Name | City | Status |
A22020 | Alami | Rabat | healthy |
A25252 | Saadani | Rabat | suspect |
C52458 | Ghita | Casa | recovered |
Another table will be displayed below for the statistical purpose, in order to have an idea about the spread rate for each city [11].
Table 3: Main Server Data processing
City | confi | recove | death | rate |
Rabat | 511 | 300 | 18 | 15% |
Casa | 1500 | 1200 | 75 | 25% |
N.B: all data in the previous table are random values just to highlight the proof of concept.
- ECG signal processing
The ECG signal processing is a long story even though we will mention about the main processing steps in order to calculate the heart rate of the patient in real-time. As it is known among the electrophysiology data analysts, the first there are three stages of ECG signal processing as follow:
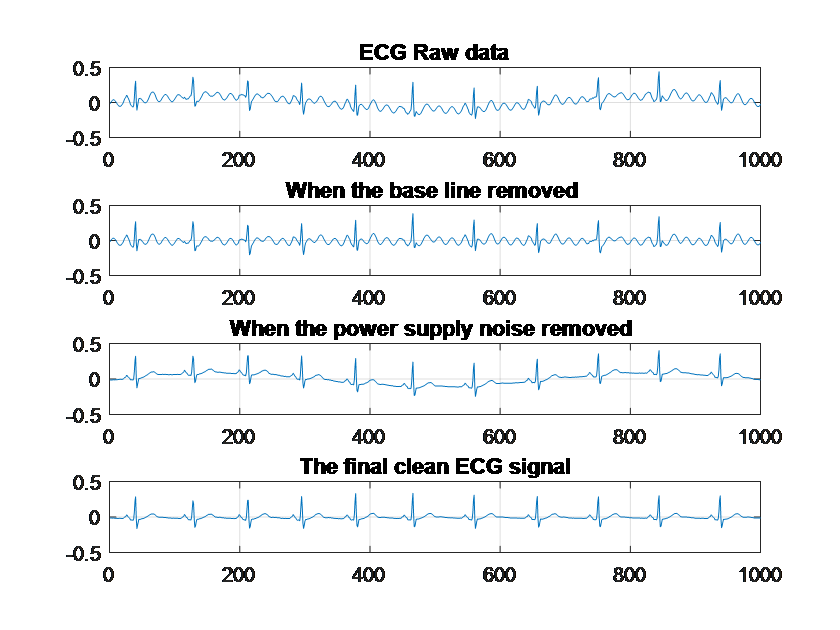
- The signal cleaning: in this stage, we have to remove all the noises and keeping only the useful part of the signal. There are two kinds of noises, the first one is related to the patient like the breathing, the baseline, the interference of the other physiological signals like the EMG, etc. the second type of noise is related to the patient itself. Such as the white noise, the power supply frequency, to remove all kinds of noises there are several methods, the classical filter like the high pass filter, the band pass filter and so on but also there is the wavelet method and the blind separation method. The most important thing is to remove only the noise components and keeping the desired part of the signal. We focus on that purpose because some filtering methods may destroy the useful part of the signal. The figures below illustrate different cleaning operations that were performed during this work during the cleaning process three kinds of filters were used, the notch filter to remove the power supply frequency, the “Detrend” function of MATLAB to delete the linear part of the baseline and the polynomial interpolation to remove the nonlinear component of the baseline[12].
- ECG features extraction: in our case, we extract only the heart beats, in order to detect in Realtime the state of the heart if it is beating in the normal range or not. for most of people the normal cardiac frequency range is between 60 and 100 beat per minute (Bpm).
- ECG signal Classification: this is the final stage of ECG signal processing in our case. That to say, after the cleaning and the features extraction we decide accordingly, it means to classify signals and we classify the suspected patient afterwards.
4. Results & Interpretation
Our platform of medical telemonitoring is designed for the Covid-19 suspected cases. In this regard it will inevitably reduce the over spread of that contagious virus. As described in the table below comparing the situation before and after our telemedicine platform:
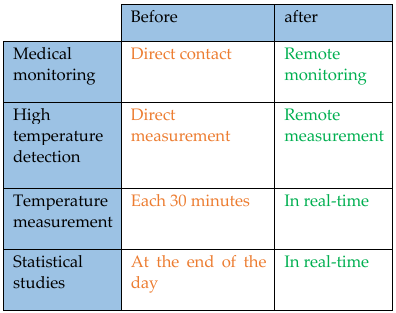
Table 4: Country statistical board
date | New cases | Recovered cases | deaths | recovered rate | Recomm-endation |
10/06/22 | 5000 | 3493 | 7 | 69% | Lock down |
11/06/22 | 3000 | 2900 | 2 | 96% | Partial lockdown |
5. Conclusion
In this paper all sides of the telemedicine were discussed to reduce as much as possible the over spread of Corona virus, primero starting by an overview of the digital solution, mentioning about the two parts; software and hardware. two advantages were highlighted, the real-time remote medical monitoring and the real-time statistics optimization as well.
In order to develop the POC (the proof of concept) of that solution, several didactic and academic items were. Such as the wireless shield for Arduino (NodeMcu) as a wearable network sensor node to acquire remotely the vital parameters of the suspected cases. For sure this last associated to the other sensors to enhance and confirm the feasibility of the project. Otherwise because of the covid situation there was no way to highlight the practical side of this research. In the same regard many interfaces were developed using LabVIEW, some of them are illustrated in this paper but others couldn’t be inserted like the bloc diagram of the LabVIEW program. The next step of this research work is to move to the manufacturing process of the project including all the parts software and hardware.
- G. N. Iyer, “On the Analysis of COVID19 – Novel Corona Viral Disease Pandemic Spread Data Using Machine Learning Techniques,” 4th International Conference on Intelligent Computing and Control Systems (ICICCS), 2020.
- Caricchio R, Gallucci M, Dass C Temple University COVID-19 Research Group, et al Preliminary predictive criteria for COVID-19 cytokine storm Annals of the Rheumatic Diseases 2021;80:88-95.
- Valerio V, Shen HC, Field E, et al POS1268 COVID-19 VACCINE HESITANCY AMONG RHEUMATOLOGY PATIENTS RECEIVING INFLUENZA VACCINEAnnals of the Rheumatic Diseases 2021;80:918-919.
- A. K. Tripathy, A. G. Mohapatra, S. P. Mohanty, E. Kougianos, A. M. Joshi and G. Das, “EasyBand: A Wearable for Safety-Aware Mobility during Pandemic Outbreak,” IEEE Consumer Electronics Magazine, vol. 9, no. 5, pp. 57-61, 2020.
- C. H. Costin, A. Pasarica, I. Alexa, A. C. Ilie, C. Rotariu and D. Costin, “Short-term Heart Rate Variability using wrist-worn pulse wave monitor compared to a Holter ECG,” E-Health and Bioengineering Conference (EHB), 2017.
- M. Protsiv, C. Ley, J. Lankester, T. Hastie, J. Parsonnet “Decreasing human body temperature in the United States since the Industrial Revolution,” eLife, vol. 9, p. e49555, 2020.
- F. Margret Sharmila, P. Suryaganesh, M. Abishek and U. Benny “Iot Based Smart Window using Sensor Dht11,” 2019 5th International Conference on Advanced Computing & Communication Systems (ICACCS), pp. 782-784, 2019.
- P. Kaur and L. Mathew “Design and development of a graphical user interface for real time monitoring and analysis of vital human body parameters,” 2016 IEEE 1st International Conference on Power Electronics, Intelligent Control and Energy Systems (ICPEICES), pp. 1-8, 2016.
- D. Parida, A. Behera, J. K. Naik, S. Pattanaik and R. S. Nanda, “Real-time Environment Monitoring System using ESP8266 and ThingSpeak on Internet of Things Platform,” 2019 International Conference on Intelligent Computing and Control Systems (ICCS), pp. 225-229, 2019.
- M. Touil, L. Bahatti and A. Elmagri «Telemedicine application to reduce the spread of Covid-19,» 2020 IEEE 2nd International Conference on Electronics, Control, Optimization and Computer Science (ICECOCS), pp. 1-4, 2020.
- G. Suprianto and Wirawan, “Implementation of Distributed Consensus Algorithms for Wireless Sensor Network Using NodeMCU ESP8266,” 2018 Electrical Power, Electronics, Communications, Controls and Informatics Seminar (EECCIS), pp. 192-196, 2018.
- S. Gupta, G. Shankar, K. Kumari and S. Kumari,, “Load frequency control using BAT algorithm,” 2016 IEEE 1st International Conference on Power Electronics, Intelligent Control and Energy Systems (ICPEICES), Delhi, India, 2016.
No related articles were found.