An Approach for PAPR Reduction in OFDM System using RCF Technique
(This article belongs to the Section Electronic Engineering (EEE))
Export Citations
Cite
Singh, J. (2022). An Approach for PAPR Reduction in OFDM System using RCF Technique. Journal of Engineering Research and Sciences, 1(10), 13–18. https://doi.org/10.55708/js0110003
Juhi Singh. "An Approach for PAPR Reduction in OFDM System using RCF Technique." Journal of Engineering Research and Sciences 1, no. 10 (October 2022): 13–18. https://doi.org/10.55708/js0110003
J. Singh, "An Approach for PAPR Reduction in OFDM System using RCF Technique," Journal of Engineering Research and Sciences, vol. 1, no. 10, pp. 13–18, Oct. 2022, doi: 10.55708/js0110003.
OFDM is one of the important modulation techniques for wireless communication which is the advanced version of FDM. Now-a-days congestion networking is growing like AI, IoT, 5G etc. so there is a need of high data rate with low BER. For such a network there is requirement of high-speed secured data transmission that is multicarrier technique OFDM. This modulation technique is useful for current and future scenario. One of the major issue in OFDM is high PAPR and this is happened due to large amount of input data bits. High PAPR results in distortion in bands and power inefficiency using power amplifier. RCF is the technique used in this paper to reduce the PAPR and analyze the results with and without applying PAPR reduction technique. In this paper, after application of 4 clip and filter SNR is improved along with decrement of CCDF of PAPR which is desired.
1. Introduction
Power efficiency and low BER is the high demand in the field of communication that requires high data rates, large BW, low congestion [1]. Multi carrier OFDM is the solution for 4G technologies and beyond 4G techniques like 5G or beyond 5G communications that provide high-speed secured data transmission [2]. Single carrier system is the oldest way in the field of transmission of data that compromising with distortion of signals and high cost of frequency selection. There is no need of compromising with bit error performance, OFDM is currently used as multi-carrier modulation scheme. In this scheme large number of sub-carriers are closely spaced and orthogonal to each other that carries modulated data over parallel data streams or sub-channels [3]. In OFDM, each sub-carrier is modulated in conventional way with low symbol rate. The BW of each subcarrier is so small that on adding the BW of subcarrier is smaller than conventional modulation BW hence it doesn’t suffer from frequency selective fading but extremely suffers from PAPR [4] The advantage of OFDM is that spectral efficiency increases as subcarriers are overlapped to each other such that they maintain orthogonality between each other [5]. Due to the presence of power amplifiers which is a non-linear element that distorts the signal [6].
The difficulty of OFDM is high PAPR that results in high bit error rate and this is happened due to variation in amplitude of large number of sub-carriers. This also results in increment of cost of the system.
The paper is organized as follows: system model which describes the important terms and method. To verify the terms and method simulation result are presented and finally conclusion is done at last.
2. System Model
2.1 About OFDM
In OFDM, complete channel bandwidth is divided into multiple sub-carriers which are orthogonal to each other OFDM is widely used in DAB and DVB as it has several advantages over traditional modulation schemes like spectral efficiency is high, tolerance to interference, robustness to channel fading.
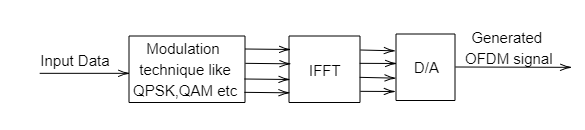
Figure 1 represents block diagram of transmitter of OFDM system. Input is given to modulation schemes like QAM, QPSK which is used to map the input data
for constellation representation. IFFT is used to multiplex the symbols over different sub-carriers by generating time domain OFDM samples which is defined as:
$$\mathbf{x}(t) = \sum_{m=0}^{N-1} X(m) \, e^{j 2\pi m f t}\tag{1}$$
where, X(m) = mth symbol
f = fundamental frequency
N=total number of symbols
B=total bandwidth, = B/N
Maximum frequency component of x(t) is given by:
$$f_{\text{max}} = \frac{B}{2}$$
Using Nyquist Rate, sampling rate = 2fmax = B
and sampling interval \(T = \frac{1}{B}\)
for nth instant sample
$$\mathbf{x}(t) = \sum_{m=0}^{N-1} X(n) e^{j 2 \pi m f t}\tag{2}$$
$$\Rightarrow \mathbf{x}(nT) = \sum_{m=0}^{N-1} X(m) e^{j 2 \pi n f_m t} = \sum_{n=0}^{N-1} X(m) e^{j 2 \pi m \left( \frac{B}{N} \right) \left( \frac{n}{B} \right) t}\tag{3}$$
$$\Rightarrow \mathbf{x}(n) = \sum_{n=0}^{M-1} X(m) e^{\frac{j 2 \pi m n}{N}}\tag{4}$$
This makes the system digital as each bit is transmitted at equally spaced time interval T which is illustrated as:
2.2. PAPR Reduction
PAPR of any signal in continuous time domain is defined as the ratio of peak value of instantaneous output power of signal to its average power. PAPR for signal let say x(t) is defined as:
$$\mathrm{PAPR}_{\mathbf{x}(t)} = \frac{p_{\text{peak}}}{p_{\text{av}}} = \frac{\max_{t \leq T} |\mathbf{x}(t)|^2}{p_{\text{av}}}\tag{5}$$
where 𝑝peak represents maximum output power and 𝑝av average output power of sample in OFDM symbol.
For discrete signal x(n), PAPR is given for length ‘L’ as:
$$\mathrm{PAPR}_{\mathbf{x}[n]} = \frac{p_{\text{peak}}}{p_{\text{av}}} = \frac{\max_{n \leq NL} |\mathbf{x}[n]|^2}{\mathbb{E}[|\mathbf{x}[n]|^2]}\tag{6}$$
In dB it given as:
$$\mathrm{PAPR}_{\mathbf{x}[n]} \text{ at dB} = \frac{p_{\text{peak}}}{p_{\text{av}}} = 10 \log_{10} \left( \frac{\max_{n \leq NL} |\mathbf{x}[n]|^2}{\mathbb{E}[|\mathbf{x}[n]|^2]} \right)\tag{7}$$
where. E[.] is the expectation operator, the PAPR of baseband signal is nearly half to passband signal [7].
PAPR is also defined in terms of CF which says that ratio of peak value of OFDM signal x(t) root-mean square value of the waveform. That is:
$$\mathrm{CF} = \frac{\max |\mathbf{x}(t)|}{\mathbb{E}[|\mathbf{x}(t)|^2]} = \sqrt{\mathrm{PAPR}}\tag{8}$$
Oversampling is used to approximate the continuous time domain OFDM signal into discrete time domain OFDM signal. This is done by performing LN point IFFT whereas (L-1) *N is the zero padding. Hence PAPR is computed for ‘L’ times oversampling and ‘N’ is the total number of subcarriers. x[n] is given as:
$$\mathbf{x}[n] = \frac{1}{\sqrt{N}} \mathbf{X}_k e^{\left( \frac{j2\pi kn}{LN} \right)}, \; 0 \leq n \leq (NL – 1)\tag{9}$$
CCDF is the complementary of CDF which is a tool for PAPR evaluation that is used for estimation of minimum number of redundancy bits [2]. CCDF for PAPR reduction of OFDM signal can be given as:
$$P(\mathrm{PAPR} > \mathrm{PAPR}_0) = 1 – (1 – e^{-\mathrm{PAPR}_0})^2\tag{10}$$
PAPR0 is the clipping level. This equation explains about the probability that PAPR0 of symbol block exceeds .
2.3. PAPR Distribution
Distribution of PAPR plays vital role in order to design and develop PAPR reduction technique effectively. It is also important for designing the whole OFDM system. PAPR distribution is used to calculate BER and achievable rate [8].
In OFDM, if real and imaginary part of x[n] are uncorrelated and orthogonal then data stream of input signal must be i.i.d. Real and imaginary part of input are i.i.d. for large number ‘N’ using central limit theorem that is Gaussian random variable each with zero mean and variance. [z]
$$\sigma^2 = \frac{\mathbb{E}[|x[n]|]}{2}$$
For ‘N’ OFDM signals, Gaussian probability distribution is given as:
$$\mathrm{P}[x(n)] = \frac{1}{\sqrt{2\pi\sigma^2}} \exp\left(-\frac{x^2[n]}{2\sigma^2}\right)\tag{11}$$
where 𝜎2 is variance of .
Rayleigh distribution is followed by the amplitude of OFDM signal and its PDF is given by:
$$\mathrm{P}[x(n)] = \frac{2|x(n)|}{\sigma^2} \exp\left( -\frac{|x(n)|^2}{\sigma^2} \right)\tag{12}$$
Chi-square distribution is followed by power of OFDM signal. CCDF is a probability that describes real-valued random variable X≥x
If F(y) is the CDF of OFDM signal then where y is the reference level i.e.,
F(y)=1-exp(y) then CCDF is given as:
$$\mathrm{P}(\mathrm{PAPR} > y) = 1 – \mathrm{P}(\mathrm{PAPR} \leq y) = 1 – F(y)^N = 1 – (1 – \exp(y))^N
\tag{13}$$
2.4. Factors Affected PAPR [9]
Number of subcarriers: Complex base band signal for one symbol in multi-carrier system can be expressed as:
$$\mathbf{x}(t) = \frac{1}{\sqrt{N}} \sum_{n=1}^{N} a_n e^{-w_n t}\tag{14}$$
where ‘N’ is the modulating symbol and also number of sub-carriers. X(t) tends towards Gaussian distribution for large number of MPSK. These subcarriers are out of phase a high PAPR is produced.
Order of Modulation: Due to high order of modulation, high data B.W. efficiency can be achieved for example QAM. PAPR is increased when signal get integrated while higher order of modulation. One of the advantage of OFDM is that sub-carriers can adopt channel condition as modulation works independently for these sub-carriers.
Constellation Shape
Constellation shape helps in reducing PAPR. This is done by additional processor associated with encoding and decoding.
Pulse Shaping
Pulse shaping is very popular in terrestrial communications specially for baseband signals which is used to decrease the BW of the transmitted signal. Due to this, overshoot problem arises which increases PAPR.
2.5. Clipping and filtering
Clipping and filtering is the easiest way for OFDM reduction. At a defined level, clipping limits the maximum amplitude of OFDM signal. It is the easiest way to implement such method.
In clipping method, some parts of the amplitude are clipped off which are above the defined level. Clipping equation is given as follows:
$$C(x) = \begin{cases} x, & |\!x|\leq Z \\ Z, & |\!x| > Z \end{cases}\tag{15}$$
where is the clipping level and also a positive number. Usually clipping is done at transmitter side. The correct estimation is required for clipping the OFDM signal and there are two parameters i.e., location and size of the clip. Clipping produces two problems into OFDM signals one is in band distortion and second one is out of band radiation. Filtering is one of the method which is used to reduce the out of band radiation.
2.5.1 Drawbacks of clipping and filtering method
- It produces in band signal distortion which degrades BER performance.
- It produces out-of-band radiation which enhances aliasing problem.
- Out of band radiation can be reduced by filtering process but peak re-growth arises.
To reduce the overall peak re-growth, repeated clipping and filtering is used which increases the overall cost of the system.
2.6. RCF Method
This technique is useful to cure the OOB distortion but in-band distortion can’t be removed. Input vector is first converted from frequency domain to time domain. ‘N’ is the number of subcarriers in each OFDM symbol. By adding zeros in the middle of the input vector, the input vector is extended. Through this interpolation is done at time domain signal [10]. When input signal is consisting of integral frequencies over FFT window then perfect trigonometric interpolation is obtained in case of OFDM.
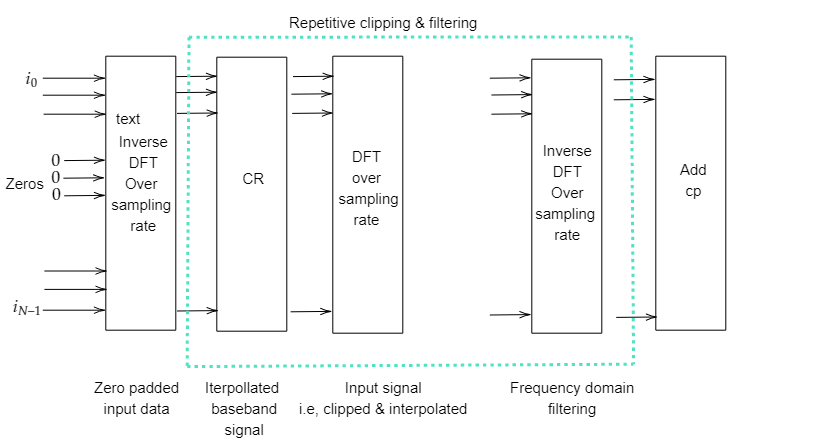
The time domain signal is clipped and described as follows:
$$C = \begin{cases} \sqrt{c_{\text{ratio}} \cdot \mathbb{E}[|x|^2]}, & |x|^2 > c_t \\ x, & |x|^2 \leq c_t \end{cases}
\tag{16}$$
Where is the output of the time domain signal. The above equation signifies that clipping is done in the amplitude of discrete time domain signal. Amplitude is reduced whenever the signal exceeds the clipping level without changing the phase.
ct is the threshold clipping level and it is given as:
$$c_t = c_{\text{ratio}} \cdot \mathbb{E}[|x|^2]\tag{17}$$
|𝑥|2 is the signal power, 𝐸[|𝑥|2] is the expected mean and
𝑐ratio is defined the ratio of clipping level to mean power of the unclipped baseband signal.
Frequency domain filtering is done after time domain filtering to reduce OOB distortion.
3. Simulation Result
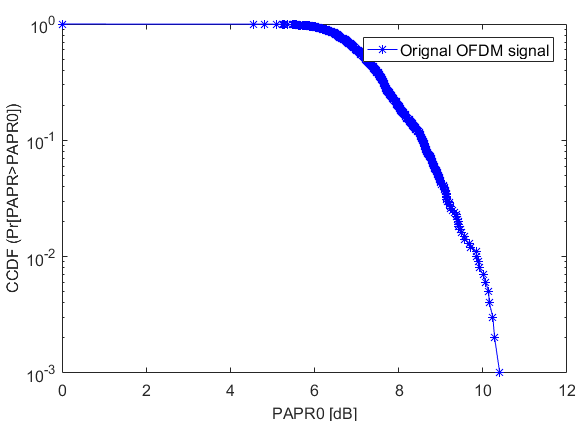
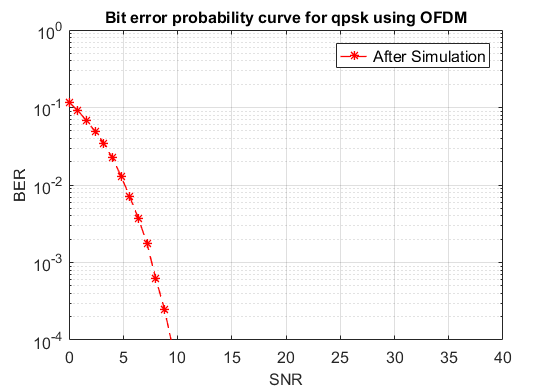
It is necessary to CCDF and BER of OFDM system when none PAPR technique is applied. From figure 5 and 6, without using PAPR technique CCDF of the system is equal to 10.95dB while PAPR is equal to 25.812 dB and SNR at BER 10-4 is 9.5612 dB
From above it is clear that PAPR of system is quite high. So to reduce the PAPR of OFDM system PAPR reduction technique is applied i.e., RCF and RFC. These method useful BER is improved by filter while PAPR is improved by clipping method.
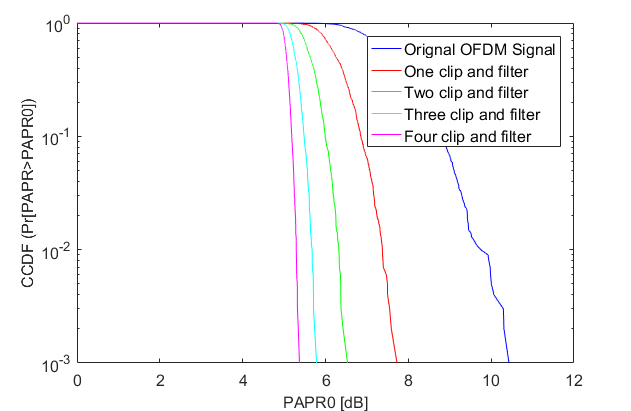
Table 1: CCDF and SNR
Technique | CCDF of PAPR | SNR |
One clip and filter | 7.681dB | 8.6718dB |
Two clip and filter | 6.6426dB | 9.412dB |
Three clip and filter | 5.818dB | 12.231dB |
Four clip and filter | 5.502dB | 14.335dB |
From figure 7, 8 and 9, It shows for CR=3 and I=2, PAPR is improving and SNR also increasing which is shown below SNR is improved when PAPR reduction technique is applied. It is also found SNR and CCDF of PAPR shows opposite relationships.
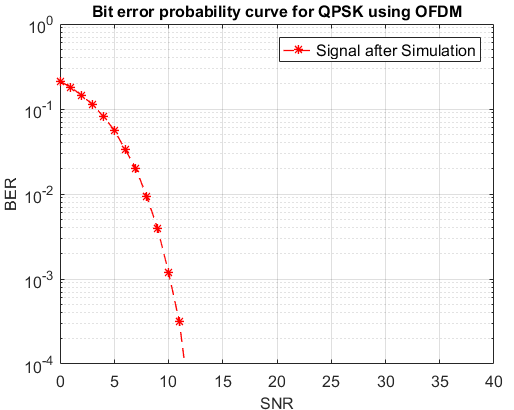
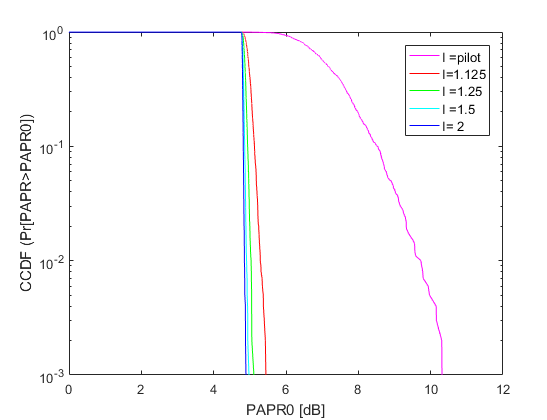
Table 2: CCDF of PAPR
I | CCDF of PAPR |
pilot | 11.365dB |
1.125 | 5.306dB |
1.25 | 4.968dB |
1.5 | 4.895dB |
2 | 4.776dB |
On increasing the values of ‘I’, PAPR of OFDM decreases except I=pilot. CCDF improves when I increase and CR decreases.
4. Conclusion
Performance of OFDM is degraded due to high value of PAPR. This drawback is minimized by RCF method. CCDF of PAPR of original is found to be 7.681dB with SNR 8.6718dB which is reduced by using repeated clipping method and it is reduced up to 5.502dB with increased SNR 14.335dB value also BER also improved along with. Reduction in PAPR helps in performance improvement of OFDM system.
- S. Ahmad, Mondala , Sagnik Chakraborty , Subhodeep Mondalc , Raunav Ghoshd , Manidipa Samantae , Piyali Mukherjeef, “Approach to reduce PAPR in Orthogonal Frequency Division Multiplexing Technique,” Turkish Journal of Computer and Mathematics Education Vol.12 No.10 (2021), 4480-4484
- Richard Musabe, Mafrebo B. Lionel , Victoire Mugongo Ushindi , Mugisha Atupenda, James Ntaganda and Gaurav Bajpai, “PAPR reduction in LTE network using both peak windowing and clipping techniques” Journal of Electrical Systems and Inf Technol (2019) 6:3. 10.1186/s43067-019-0004-1
- Vishal Ghode, Suresh Gawande, Satyarth Tiwari, “A review study on orthogonal frequency division multiplexing”, Paripex-indian journal of research, Volume-10, Issue-1, January-2021
- B. Kotade, A. B. Nandgaonkar, and S. L. Nalbalwar, “Peak-to-average power ratio reduction techniques in ofdm: A review and challenges,” in 2018 International Conference On Advances in Communication and Computing Technology (ICACCT), pp. 319–324, 2018.
- Martın-Sacrist D, Monserrat JF, Cabrejas Penuelas J, Calabuig D, Garrigas S, Cardona N (2009) On the way towards fourth-generation mobile: 3GPP LTE and LTE-advanced. EURASIP J Wirel Commun Net. https://doi. org/10.1155/200/354089
- Srikanth S, Kumarn V, Manikandan C, Murugesapandian. “Orthogonal frequency division multiplexing: is it the multiple access system of the future?.” AU-KBC Research center, Anna University, Chennai, India
- C. Choudhary, and V. Gupta “A Study of Performance Enhancement Schemes for Multicarrier Transmission,” International Journal of Computer Applications, vol. 68, no. 5, pp. 50-54, April 2013.
- H. D. Joshi. “Performance augmentation of OFDM system,” Ph.D. dissertation, Jaypee Univ. of engineering and Technology, India, May 2012.
- R.W. Bauml, R.F.H. Fischer, and J. B. Huber “Reducing the peak-to-average power ratio of multicarrier modulation by selected mapping,” IEEE Electronics Letters ,vol. 33, pp. 2056 – 2057, Oct 1996.