Assessment of Village-wise Soil Nutrients and their Effect on Sugarcane Productivity in Western Maharashtra, India

(This article belongs to the Special Issue on Special Issue on Multidisciplinary Sciences and Advanced Technology (SI-MSAT 2022) and the Section Agriculture Multidisciplinary (AGM))
Export Citations
Cite
Narvekar, C. and Rao, M. (2022). Assessment of Village-wise Soil Nutrients and their Effect on Sugarcane Productivity in Western Maharashtra, India. Journal of Engineering Research and Sciences, 1(10), 19–25. https://doi.org/10.55708/js0110004
Chhaya Narvekar and Madhuri Rao. "Assessment of Village-wise Soil Nutrients and their Effect on Sugarcane Productivity in Western Maharashtra, India." Journal of Engineering Research and Sciences 1, no. 10 (October 2022): 19–25. https://doi.org/10.55708/js0110004
C. Narvekar and M. Rao, "Assessment of Village-wise Soil Nutrients and their Effect on Sugarcane Productivity in Western Maharashtra, India," Journal of Engineering Research and Sciences, vol. 1, no. 10, pp. 19–25, Oct. 2022, doi: 10.55708/js0110004.
Soil fertility needs to be assessed to develop strategies for long-term agricultural productivity. A study has been undertaken at Shirol tehsil, Kolhapur district, Maharashtra state, India to evaluate the fertility status of soil using nutrient index approach. For the present study PH, organic carbon, and EC were chosen as potential markers of soil quality along with primary nutrient potash and phosphrous. Objectives of this research are i)To provide nutrient availability index, ii) To assess soil fertility status and sugarcane productivity in the study area. Based on the soil parameters analysis, it is found that the soil is fertile. Sugarcane is the most cultivated crop in this area and the productivity of sugarcane is observed to be higher in study area as compared to national productivity. The nutrient index values for PH, Organic carbon and Phosphorous were normal, EC was low, and Potash was high. It is also observed that all ten years of study potash is high. Productivity change as well as nutrient values change over a period of time tested with standard t- test approach.
1. Introduction
1.1. Soil nutrient
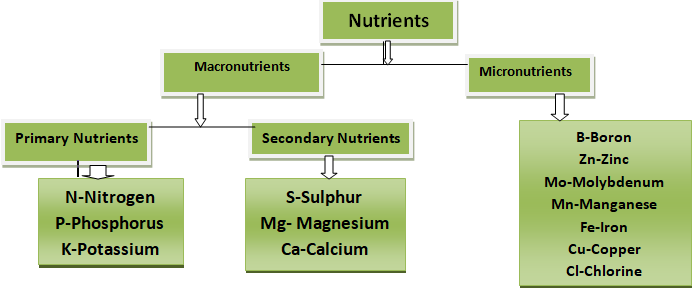
Nutrient management based on soil tests has become a major problem in attempts to boost agricultural productivity. The sustainability of Indian agriculture is a subject of growing concern due to declining soil fertility. In general, soil quality and soil health are synonymous with soil fertility, or the soil’s reserve of agricultural nutrients It is important to acquire a single number for each nutrient in order to compare the levels of soil fertility between different areas. Nutrient Index Value (NIV) is one of the approach [1]. Soil analysis aids farmers and agricultural producers in determining which fertilizers are required and in what quantities they should be applied to the plant to generate a profitable crop [2]. The 5th of December is designated as “World Soil Day.” India joins the rest of the world in recognizing the importance of soil and its role in our country’s overall growth and well-being. To produce crops, farming combines manufactured agricultural equipment, natural capital soil, and human capital such as farmer expertise. The presence of currently used pesticides in the agricultural regions is found to be of major concern in many countries, indicating the need for long-term monitoring programs, particularly in regions with intensive agricultural activities, to determine the fate and accumulation of currently used pesticides in reality [3, 4]. Soil fertility is a dynamic natural quality that changes as a result of both natural and human-induced influences. Figure 1 depicts the nutrient available in soil.
Soil chemical properties are one of the factors that influence soil fertility. The ability of the soil to naturally provide plants with the right kinds and amounts of nutrients is referred to as soil fertility [5,6,7]. Soil productivity refers to a soil’s ability to produce crops under specified management regimes and is measured in yields. Fertile soils are found in all productive soils [8-10].
A soil test is a chemical method for estimating the nutrient-supplying power of soil. The primary objective of soil testing is its ability to determine the nutrient status of the soil before the crop is planted. If the soil has an adequate supply of nutrients, it refers to the soil’s ability to support life, generate economically valuable crops and sustain soil health without deterioration [11].
The Physico-chemical parameters analyzed in this research are: PH-The most significant property of soil is its PH level. Its effects on all other parameters of soil are profound. Electrical conductivity is another essential feature of soil that is used to determine its quality. It is a metric for the number of ions in a solution. When the concentration of ions in a soil solution rises, so does its electrical conductivity. Phosphorus is an essential component of every living cell. It’s one of the most crucial macronutrients for plant development. Potassium is involved in a variety of plant metabolism events, including the generation of cellular structural components, photosynthetic regulation, and the production of plant sugars that are required for a variety of plant metabolic demands. The foundation of soil fertility is organic carbon in the soil. It releases nutrients for plant growth, helps to maintain soil structure and biological and physical health, and acts as a buffer against dangerous elements. Increasing soil organic carbon has two advantages: it aids in climate change mitigation and enhances soil health and fertility [12, 13]. Plants require thirteen vital nutrients as shown in Figure 1, which they obtain from the soil . Macronutrients are the six nutrients that plants require classified as primary nutrients N-P-K stands for Nitrogen, Phosphorus, and Potassium, and secondary nutrients are Calcium, Magnesium, and Sulphur. Micronutrients are the other nutrients that are only required at trace levels. Soil chemical properties are linked to properties that have a direct impact on plant nutrition.
1.2. Description of study area
In this research, five soil parameters are analysed for twenty villages as discussed in the second section, by calculating nutrient index values for the Shirol Tehsil, Kolhapur district, Maharashtra. Shirol Taluka of Kolhapur district is gifted by the presence of natural irrigation potential on account of five major rivers, i.e., Krishna, Panchaganga, Warana, Dudhganga, and Vedganga. The soil type here is alluvial. Normal rainfall is from June-October, with 1019.5 mm. The top three crops cultivated are sugarcane at 113.9 (‘000 ha), paddy rain-fed at 113.8 (‘000 ha), and groundnut at 57.4 (‘000 ha) . India is the world’s second-largest producer of sugarcane after Brazil. Sugarcane is grown in all of India’s states and at various times of the year.
1.3. Methods and material
Soil fertility Status in India and measure taken
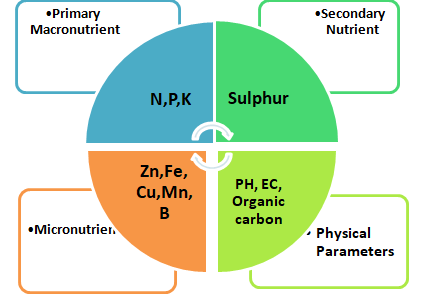
There are different types of soil in India, from the alluvial of the Indo-Gangetic plains to the dark red and black soils of the Deccan Plateau. The Government of India continues to have serious concerns about the health and quality of the soil. The Soil Health Card (SHC) programme launched in February 2015, is one of many soil health monitoring programmes being run by the Government of India. Under this programme, uniform standards are followed across all States for soil analysis. According to this plan, soil health condition is evaluated in relation to 12 significant soil factors, which depicted in Figure 2
State-wise Soil Nutrient Indices – Macro and Micro Nutrient for the Maharashtra State are as in Table 1 for two cycles. That clearly indicates potash is increased, nitrogen and Organic carbon are low.
Table 1: Maharashtra State Nutrient Indices
First Cycle- (2015-17) | Second Cycle (2017-19) | ||||
L | M | H | L | M | H |
B, Fe, S, Zn, OC, N | P, Cu, Mn | K | N, B, Fe, S, Zn | P, OC, Cu, Mn | K |
1.4. Agricultural Practices in the study area
In India, small and marginal farmers follow basic fertilizer recommendations for N, P, and K, which rarely match soil fertility needs and frequently ignore secondary and micronutrients [14-16]. Aiming to sustain soil health and agricultural output, the Indian government is pushing integrated nutrient management (INM).
2. Material
Soil testing data is made available for research purposes by Shree Dutta Sugar Factory Shirol. Sugar mill provide soil testing facility to farmers to motivate them to test their soil. Temporal time window is of ten years of data from the years 2010–2020. The data description is shown in Table 2.
Table 2: Descriptive Statistics of the Whole dataset
Descriptive | PH | EC | OC | P | K |
Mean | 7.51 | 0.65 | 0.75 | 27.84 | 543.96 |
Standard Error | 0.00 | 0.01 | 0.00 | 0.26 | 2.32 |
Median | 7.55 | 0.46 | 0.75 | 17.00 | 504.00 |
Mode | 7.50 | 0.30 | 0.60 | 7.50 | 1120.00 |
Standard Deviation | 0.41 | 0.92 | 0.30 | 26.59 | 239.12 |
Sample Variance | 0.16 | 0.84 | 0.09 | 707.06 | 57178.72 |
Kurtosis | 17.52 | 189.5 | 547.7 | 10.73 | 3.95 |
Skewness | -1.83 | 10.77 | 13.17 | 2.00 | 1.12 |
Range | 8.00 | 27.97 | 14.76 | 476.62 | 2689.70 |
Minimum | 0.60 | 0.03 | 0.04 | 0.38 | 0.30 |
Maximum | 8.60 | 28.00 | 14.80 | 477.00 | 2690.00 |
Sum | 79469 | 6888 | 7977 | 294494 | 5754524 |
Count | 10579 | 10579 | 10579 | 10579 | 10579 |
2.1. Method
The nutrition index (N.I) value is a measurement of the soil’s ability to give nutrients to plants. The nutrient index approach introduced by parker and adopted and modified by many researchers Nutrient index is used to evaluate the fertility status of soils based on the sample classification. Sample are divided into three categories, low, medium and high. Region wise nutrient index can be calculated using the following formula [17]:
Nutrient Index (N.I.) = (L × 1 + M × 2 + H × 3) / TOTAL
where,
L: Count of sample with low nutrient status.
M: Count of sample with medium nutrient status
H: Count of sample with high nutrient status
TOTAL: This is total number of samples taken for a given area.
The total number of samples analyzed in this research is 10579.
Table 2 presents the descriptive statistics for the all sample and corresponding parameters. For the period of study (2010-2020) year wise nutrient index is calculated for the soil parameters under study. Twenty sample villages from Shirol Tehsil, western Maharashtra were selected for assessing village-wise average parameters. Ten year parameter wise nutrient status in the study area is shown in Table 3-Table 6 and Figure 1 through Figure 5.
For selected village all farmers data used for calculation of village soil property status for ten years from 2010-2020.Yearly nutrient index is calculated combining all twenty village samples for that year, which is indicated in Table 7. Samples are classified as per Table 6. Figure 4 shows NIV trends over ten years. Table 6 gives overall soil nutrient status of study area.
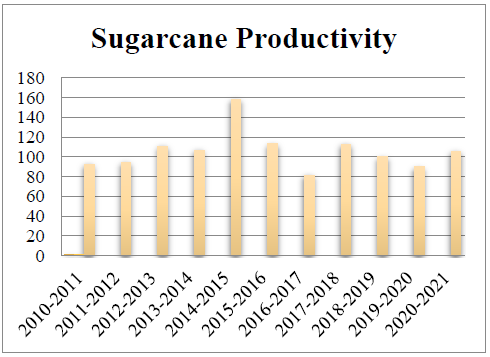
As sugarcane is dominating crop of the study area, sugarcane production for the same temporal window is used for finding the productivity of the region. Sugarcane production data is made available by Shree Dutta Sugar Factory Shirol [18]. Production is recorded with six features such as farmer name, gat number, area, irrigation mode, cane variety and compute type, etc. number of records are 287475, recorded from the year 2010 to 2020. By using this dataset village-wise sugarcane cultivated area and total production from that further derived feature is the productivity of a particular village. Study area productivity is calculated per year as shown in Figure 5, this data is derived from all village productivity. Soil parameters and sugarcane productivity analysis is done for same time window, so tried to see a correlation between nutrient index value and productivity. This study found a positive correlation but less. Compute type is a crop cultivation method based on the season which is impacting the production and maturity and also has an effect on production.
2.2. Classification of Nutrient Index Value
Based on the macronutrient Nutrient index value calculated for the study area, which is a fertility indicator of soil. Soil parameters and their nutrient indices for ten years are as shown in Table 7. Figure 4 clearly observe potash is excess during all the years this is tested with T-test for testing hypothesis H0 Potash in study area is above normal range, and accepted the null hypothesis. This could be due to excess fertilizer use. Electrical conductivity is towards lower border. Most of the soil samples are alkaline as PH is on the higher side. Organic carbon is observed normal, phosphorus is fifty percent normal, rest is below normal. Soil fertility status was calculated from all samples and labeled into three classes as per Table 6, and labels are shown in Table 8.
Table 3: Village-wise Ten Year Phosphorous status mg kg−1
Village Name | 2010-11 | 2011-12 | 2012-13 | 2013-14 | 2014-15 | 2015-16 | 2016-17 | 2017-18 | 2018-19 | 2019-20 |
AKIWAT | 10.81 | 10.89 | 14.55 | 28.00 | 21.10 | 32.16 | 17.84 | 11.05 | 57.68 | 51.99 |
ARJUNWAD | 14.30 | 10.59 | 15.62 | 16.80 | 21.33 | 18.74 | 14.12 | 9.55 | 37.88 | 58.57 |
BORGAON | 8.00 | 11.13 | 11.60 | 21.00 | 23.30 | 15.49 | 14.47 | 8.40 | 30.55 | 47.11 |
CHAND-SHIRADWAD | 10.67 | 6.89 | 11.76 | 17.50 | 16.50 | 43.01 | 12.97 | 7.10 | 29.51 | 61.34 |
CHINCHWAD | 11.02 | 14.43 | 16.58 | 23.53 | 21.10 | 25.52 | 7.01 | 6.36 | 42.88 | 50.84 |
DATTANAGAR | 10.21 | 15.70 | 13.43 | 18.00 | 38.00 | 32.99 | 11.64 | 6.42 | 32.28 | 56.03 |
JAMBHALI | 9.25 | 11.29 | 13.51 | 25.29 | 32.60 | 28.63 | 15.21 | 9.59 | 42.61 | 53.85 |
JANWAD | 5.00 | 8.88 | 12.28 | 18.18 | 44.20 | 15.32 | 14.71 | 6.21 | 30.04 | 64.17 |
KURUNDWAD | 11.37 | 12.71 | 12.94 | 20.56 | 24.23 | 33.88 | 13.59 | 10.58 | 53.24 | 55.50 |
MANGAVATI | 7.21 | 10.09 | 15.74 | 26.00 | 34.90 | 36.66 | 12.42 | 8.66 | 26.87 | 57.82 |
NANDANI | 16.21 | 13.59 | 14.77 | 13.57 | 21.74 | 36.15 | 13.91 | 11.20 | 36.34 | 54.93 |
RAJAPUR | 6.97 | 10.64 | 15.10 | 18.25 | 16.80 | 31.81 | 7.00 | 7.47 | 41.12 | 49.55 |
SHAHAPUR | 9.31 | 8.50 | 13.28 | 21.97 | 32.60 | 33.56 | 15.34 | 8.96 | 24.98 | 47.70 |
SHEDBAL | 6.83 | 5.78 | 5.95 | 19.25 | 18.60 | 14.36 | 8.95 | 7.89 | 33.62 | 55.30 |
SHIRATI | 11.12 | 10.36 | 15.08 | 19.89 | 16.10 | 26.22 | 18.34 | 8.36 | 29.18 | 60.24 |
SHIRDHON | 16.92 | 7.35 | 11.46 | 15.05 | 20.43 | 37.16 | 15.36 | 9.75 | 43.48 | 62.89 |
SHIROL | 10.24 | 10.17 | 13.60 | 22.74 | 22.62 | 25.23 | 17.23 | 9.45 | 41.79 | 66.71 |
TAKALI | 9.11 | 8.03 | 10.48 | 18.00 | 32.60 | 29.17 | 12.75 | 9.73 | 49.65 | 52.84 |
TERWAD | 15.80 | 14.14 | 7.68 | 21.67 | 10.00 | 16.15 | 12.85 | 7.98 | 40.66 | 44.67 |
UDGAON | 10.43 | 7.82 | 12.35 | 22.15 | 12.15 | 33.72 | 8.29 | 9.65 | 35.14 | 53.89 |
Table 4: Village-Wise Ten Year Potash Status Mg Kg−1
Village Name | 2010-11 | 2011-12 | 2012-13 | 2013-14 | 2014-15 | 2015-16 | 2016-17 | 2017-18 | 2018-19 | 2019-20 |
AKIWAT | 367 | 417 | 525 | 392 | 319 | 328 | 670 | 516 | 597 | 367 |
ARJUNWAD | 417 | 427 | 451 | 691 | 547 | 473 | 578 | 663 | 635 | 417 |
BORGAON | 277 | 319 | 358 | 414 | 706 | 454 | 453 | 519 | 545 | 277 |
CHAND-SHIRADWAD | 310 | 350 | 542 | 429 | 498 | 439 | 461 | 615 | 572 | 310 |
CHINCHWAD | 515 | 578 | 869 | 468 | 577 | 553 | 740 | 696 | 648 | 515 |
DATTANAGAR | 423 | 397 | 503 | 715 | 347 | 457 | 529 | 781 | 547 | 423 |
JAMBHALI | 335 | 415 | 477 | 565 | 480 | 433 | 709 | 725 | 654 | 335 |
JANWAD | 415 | 426 | 470 | 529 | 829 | 613 | 531 | 606 | 771 | 415 |
KURUNDWAD | 238 | 326 | 643 | 353 | 907 | 452 | 492 | 628 | 594 | 238 |
MANGAVATI | 324 | 366 | 459 | 479 | 631 | 421 | 664 | 558 | 485 | 324 |
NANDANI | 405 | 419 | 566 | 657 | 717 | 502 | 433 | 669 | 703 | 405 |
RAJAPUR | 498 | 684 | 570 | 573 | 755 | 494 | 567 | 624 | 623 | 498 |
SHAHAPUR | 278 | 504 | 339 | 347 | 862 | 484 | 398 | 770 | 661 | 278 |
SHEDBAL | 286 | 371 | 379 | 439 | 720 | 426 | 621 | 626 | 565 | 286 |
SHIRATI | 300 | 336 | 440 | 477 | 829 | 514 | 538 | 660 | 605 | 300 |
SHIRDHON | 454 | 339 | 563 | 607 | 717 | 468 | 580 | 668 | 682 | 454 |
SHIROL | 381 | 403 | 525 | 530 | 549 | 555 | 501 | 615 | 643 | 381 |
TAKALI | 437 | 391 | 454 | 376 | 577 | 443 | 596 | 640 | 566 | 437 |
TERWAD | 505 | 414 | 510 | 324 | 347 | 582 | 747 | 740 | 722 | 505 |
UDGAON | 433 | 457 | 460 | 405 | 535 | 531 | 605 | 604 | 666 | 433 |
Table 5: Village-wise Ten Year Organic Carbon % Status
Village-> Year | 2010-11 | 2011-12 | 2012-13 | 2013-14 | 2014-15 | 2015-16 | 2016-17 | 2017-18 | 2018-19 | 2019-20 |
AKIWAT | 0.55 | 0.67 | 0.57 | 0.90 | 0.87 | 0.75 | 0.68 | 0.78 | 0.67 | 0.86 |
ARJUNWAD | 0.64 | 0.71 | 0.58 | 0.62 | 0.61 | 0.72 | 0.91 | 0.84 | 0.77 | 0.73 |
BORGAON | 0.51 | 0.55 | 0.54 | 0.50 | 0.48 | 0.66 | 0.79 | 0.88 | 0.74 | 0.77 |
CHAND-SHIRADWAD | 0.53 | 0.65 | 0.48 | 0.38 | 0.60 | 0.56 | 0.60 | 0.79 | 0.68 | 0.81 |
CHINCHWAD | 0.60 | 0.81 | 0.72 | 0.65 | 0.69 | 0.74 | 0.84 | 0.84 | 0.81 | 0.86 |
DATTANAGAR | 0.50 | 0.54 | 0.65 | 0.55 | 0.90 | 0.72 | 0.84 | 0.83 | 0.75 | 0.74 |
DHARANGUTTI | 0.63 | 0.64 | 0.63 | 0.67 | 0.82 | 0.78 | 0.81 | 1.03 | 0.82 | 0.82 |
JAMBHALI | 0.71 | 0.70 | 0.66 | 0.63 | 1.92 | 0.73 | 0.87 | 0.86 | 0.92 | 0.84 |
JANWAD | 0.49 | 0.64 | 0.70 | 0.49 | 1.05 | 0.68 | 0.67 | 0.85 | 0.77 | 0.80 |
KURUNDWAD | 0.60 | 0.68 | 0.67 | 0.51 | 0.59 | 0.69 | 0.88 | 0.94 | 0.76 | 0.83 |
MANGAVATI | 0.66 | 0.59 | 0.61 | 0.57 | 0.81 | 0.72 | 0.94 | 0.76 | 0.69 | 0.75 |
NANDANI | 0.67 | 0.99 | 0.64 | 0.71 | 0.45 | 0.81 | 0.81 | 0.93 | 0.79 | 0.89 |
RAJAPUR | 0.57 | 0.60 | 0.56 | 0.64 | 0.48 | 0.68 | 0.65 | 0.66 | 0.72 | 0.81 |
SADALGA | 0.55 | 0.55 | 0.57 | 0.56 | 0.77 | 0.73 | 0.82 | 0.82 | 0.79 | 0.88 |
SHAHAPUR | 0.93 | 0.60 | 0.64 | 0.51 | 1.05 | 0.64 | 0.69 | 0.90 | 0.81 | 0.80 |
SHEDBAL | 0.45 | 0.62 | 0.58 | 0.53 | 0.78 | 0.65 | 0.81 | 0.75 | 0.74 | 0.88 |
SHIRATI | 0.63 | 2.53 | 0.75 | 0.62 | 0.84 | 0.82 | 0.82 | 0.80 | 0.81 | 0.85 |
SHIRDHON | 0.58 | 0.74 | 0.59 | 0.68 | 0.51 | 0.90 | 0.80 | 0.78 | 0.72 | 0.84 |
SHIRGUPPI | 0.72 | 0.58 | 0.54 | 0.58 | 0.45 | 0.49 | 0.81 | 0.73 | 0.86 | 0.75 |
SHIROL | 0.60 | 0.64 | 0.62 | 0.58 | 0.84 | 0.76 | 0.84 | 0.84 | 0.78 | 0.83 |
TAKALI | 0.64 | 0.61 | 0.70 | 0.51 | 0.60 | 0.62 | 0.83 | 0.87 | 0.75 | 0.70 |
TERWAD | 0.59 | 0.63 | 0.58 | 0.40 | 0.72 | 0.80 | 0.76 | 0.70 | 0.82 | 0.68 |
UDGAON | 0.33 | 0.64 | 0.64 | 0.65 | 0.57 | 0.87 | 0.91 | 0.91 | 0.85 | 0.83 |
Table 6: Nutrient Index Value- Classification.
Nutrient Class | Nutrient Index Value |
LOW | < 1.66 |
MEDIUM | 1.67 -2.33 |
HIGH | >2.33 |
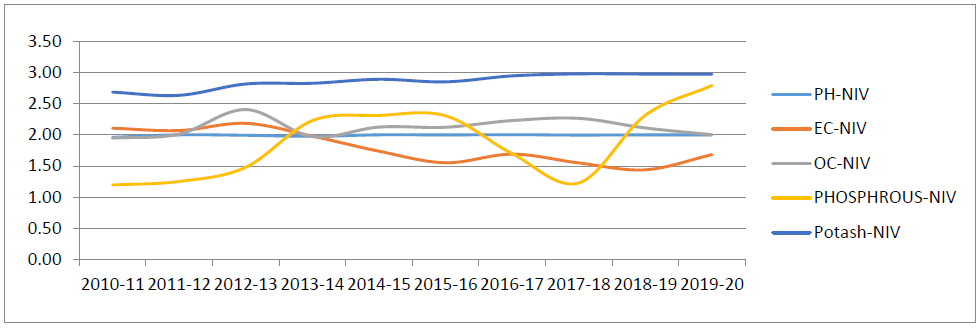
Table 7: Nutrient Indices for ten years
YEAR | PH-NIV | EC-NIV | OC-NIV | PHOSPHROUS-NIV | Potash-NIV |
2010-11 | 1.96 | 2.11 | 1.95 | 1.20 | 2.68 |
2011-12 | 2.00 | 2.07 | 2.01 | 1.25 | 2.63 |
2012-13 | 1.99 | 2.18 | 2.40 | 1.48 | 2.81 |
2013-14 | 1.98 | 1.98 | 1.97 | 2.23 | 2.83 |
2014-15 | 2.00 | 1.74 | 2.12 | 2.31 | 2.89 |
2015-16 | 2.00 | 1.55 | 2.12 | 2.30 | 2.85 |
2016-17 | 2.00 | 1.69 | 2.23 | 1.70 | 2.94 |
2017-18 | 2.00 | 1.55 | 2.26 | 1.23 | 2.98 |
2018-19 | 2.00 | 1.44 | 2.11 | 2.31 | 2.97 |
2019-20 | 2.00 | 1.68 | 2.00 | 2.79 | 2.97 |
2010-20 | 2.00 | 1.63 | 2.33 | 2.13 | 2.89 |
Medium is the acceptable range for many crops. We can say soil is fertile but needs proper nutrition management to avoid deficiency as well toxicity of soil.
Table 8: Percentage- NIV –Shirol Tehsil
Soil Property | L | M | H | NIV | Fertility Index |
PH | 0.53 | 99 | 0.09 | 2.00 | Medium |
EC-dsm-1 | 57 | 22 | 20 | 1.63 | Low |
OC % | 9 | 49 | 42 | 2.33 | Medium |
PHOS- mg kg−1 | 28 | 30 | 42 | 2.13 | Medium |
Potash- mg kg−1 | 0.72 | 10 | 89 | 2.89 | High |
Productivity column is added for unit area production. Average productivity for the period of study in the study area is 99.6, which is greater than Maharashtra state productivity.
3. Results and discussion
Dataset had outliers as well as missing values; those records are not considered for analysis. Based on available data and parameters following observations were noted. From Table 6 pH of soils is normal (99% Samples). Electrical conductivity was low (57 % samples). Organic carbon was found to be normal. The nutrient index value for major nutrients phosphorus normal and potash was found to be high. Average sugarcane productivity in India is 70-80, the average sugarcane productivity in Maharashtra is 80.72, , and the average productivity of the study area is 99.6. Hypothesis is tested with standard test. H0 – Productivity of the region is increasing. From test statistics H0 is rejected and Ha is accepted as in productivity there is not much change over a period of study. This indicates soil is fertile and productive. Soil type is Black Soil, and from the nutrient index observation it is fertile as well. Black soils can be used for a variety of crops because of their high moisture content, which makes them ideal for growing cotton. Black cotton soil is another name for it in common usage. However, a wide variety of other crops, including rice, sugar cane, wheat, jowar, linseed, sunflower, cereal crops, citrus fruits, tomatoes, tobacco, groundnut, any crops, and millets and oilseeds, can be cultivated on these soils.
4. Conclusions
Understanding the consequences of existing farming practices and assessing the suitability of these soils for future policy formulations will help to ensure that this resource gives farmers the most benefit. This research will facilitate improved decisions for most of the stakeholders of the agriculture industry such as farmers, agriculture managers, and government bodies involved in policy-making for improvement in the economic production of agricultural products. Soil fertility index will help in nutrient management and fertilizer application. The soil nutrient index provides an index of nutrient availability for fertilizer recommendation and evaluation of soil fertility. According to soil fertility crop recommendation is possible. Soil health leads to the health of plants which gives healthy nutritious food for all living beings, so healthy life on the planet.
Acknowledgement
The authors are highly grateful to Shree Dutta Sugar Factory, Shirol, and the soil testing laboratory, for providing the necessary data to carry out this research and thankful to Thadomal Shahani Engineering College, Bandra, Mumbai, India.
- Singh, G., Sharma, M., Manan, J. & Singh, G.,” Assessment of soil fertility status under different cropping sequences in District Kapurthala”, Journal of Krishi Vigyan, Vol 5(1),PP 1-9,2016, DOI:10.5958/2349-4433.2016.00023.4
- Archana, A., Sankari, V. S., & Nair, S. S.” An economically mobile device for the on-site testing of soil nutrients by studying the spectrum”. Materials Today: Proceedings 2021 doi.org/10.1016/j.matpr.2021.05.620
- Sabzevari, S., & Hofman, J. ” A worldwide review of currently used pesticides’ monitoring in agricultural soils”, Science of The Total Environment, 2021 doi.org/10.1016/j.scitotenv.2021.152344
- Rammoorthy, B., Bajaj, J.” Available N, P and K status of Indian soils”. Fertilizer news 14(8), 24–26- 1969.
- Kashiwar, S. R., Kundu, M. C., & Dongarwar, U. R. “Assessment and mapping of soil nutrient status of Sakoli tehsil of Bhandara district of Maharashtra using GIS techniques”, J Pharmacogn. Phytochem. 2019a, 8(5), 1900-1905, 2019
- Gedamu MT. “Assessment of soil quality index for agricultural purpose in agamsa sub-watershed”, Ethiopia. AGBIR. 2021;37(2):102-107.
- Idowu, J., Ghimire, R., Flynn, R., and Ganguli, A. (2019). “Soil Health: Importance, Assessment and Management”, Cooperative Extension Service, College of Agriculture, Consumer and Environmental Sciences, Circular 694B aces.nmsu.edu/pubs. Available online at: http://aces.nmsu.edu/pubs/_circulars/CR694B/welcome/html (accessed December 9, 2021).
- Pandiaraj, T., Srivastava, P. P., Das, S., & Sinha, A. K. Assessing soil fertility status of tasar host plants growing soils in Purulia district of West Bengal state. Journal of Pharmacognosy and Phytochemistry, 7(2), 2966-2970.,2018, DOI: 10.54026.203587108
- Kashiwar, S. R., Kundu, M. C., & Dongarwar, U. R. “Soil fertility appraisal of Bhandara block of Maharashtra using geospatial techniques”, IJCS, 8(2), 2570-2576 ,2020 DOI:10.22271/chemi.2020.v8.i2am.9136
- Hermiyanto, B., Winarso, S., & Kusumandaru, W,” Soil Chemical properties index of tobacco plantation land in Jember District.”,Agriculture and Agricultural Science Procedia, 9, 181-190, 2016, doi: 10.1016/j.aaspro.2016.02.118
- Rana, S. S.,” Principles and Practices of Soil Fertility and Nutrient Management”, Department of Agronomy, Forages and Grassland Management, CSKHPKV, Palampur, 2012.DOI: 10.13140/RG. 2.2. 30430.02888).
- Montgomery, David R., and Anne Biklé. “Soil health and nutrient density: beyond organic vs. conventional farming.” Frontiers in Sustainable Food Systems 5 (2021): 699147.
- Pathak, H.,” Trend of fertility status of Indian soils”, Current Advances in Agricultural Sciences, 2(1), 10-12, 2010 ,Corpus ID: 53540356
- Parker, F. W., Nelson, W. L., Winters, E., & Miles, I. E, “The broad interpretation and application of soil test informatio”. Agronomy Journal, 43(3), 105-112, 1951, DOI: 10.2134/AGRONJ1951.00021962004300030001X
- Reddy, A. (2018). Impact study of soil health card scheme. National Institute of Agricultural Extension Management (MANAGE), Hyderabad-500030, 106. DOI:10.31220/osf.io/n3d2m
- Krishna, N.R., P. Chandravamshi and Ashok, L.B. 2017. Soil Fertility Status of Major Nutrients, Micronutrients and Mapping in Nicchapura-2 Micro Watershed of Davanagere District, Karnataka.Int.J.Curr.Microbiol.App.Sci. 6(9): 1178-1186. doi: https://doi.org/10.20546/ijcmas.2017.609.142
- ICAR_CRIDA_NICRA,2017.https://mospi.gov.in/documents/213904/0/b14_Chapter+2+%282%29.pdf/432d7ade-8bea-52eb-9eb1-ffebba9c475b?t=1612935861353. http://dattasugar.co.in/