Using Interaction Geography to Explore Building Occupant Behaviors in Virtual Reality: A Pilot Study

(This article belongs to the Special Issue on Special Issue on Computing, Engineering and Sciences (SI-CES 2022-23) and the Section Construction and Building Technology (CBT))
Export Citations
Cite
Vo, H. and Huesemann-Odom, P. (2022). Using Interaction Geography to Explore Building Occupant Behaviors in Virtual Reality: A Pilot Study. Journal of Engineering Research and Sciences, 1(11), 1–7. https://doi.org/10.55708/js0111001
Hoa Vo and Peter Huesemann-Odom. "Using Interaction Geography to Explore Building Occupant Behaviors in Virtual Reality: A Pilot Study." Journal of Engineering Research and Sciences 1, no. 11 (November 2022): 1–7. https://doi.org/10.55708/js0111001
H. Vo and P. Huesemann-Odom, "Using Interaction Geography to Explore Building Occupant Behaviors in Virtual Reality: A Pilot Study," Journal of Engineering Research and Sciences, vol. 1, no. 11, pp. 1–7, Nov. 2022, doi: 10.55708/js0111001.
The sole focus of current occupant behavior research on environmental and contextual factors (i.e., physical attributes) in buildings is a missed opportunity. Psychological, physiological, social, time, and random factors also influence building occupants. In this pilot study (n=10), the authors used Interaction Geography to capture human movements across space and time in a Virtual Reality (VR) museum to dissect building occupant behavior. Results indicated that study majors (i.e., psychological) and personal connections (i.e., social) with the space affected how participants explored and spent time in the VR museum.
1. Introduction
Building occupant behaviors are the direct indicators of how well the built environment (e.g., interior spaces) promotes human physical and psychological well-being. The current approach to comprehending said behaviors focuses on occupant assessments of the physical design or subjective ratings of indoor environmental quality (IEQ) factors such as acoustics, cleanliness, and furnishings [1]. Occupancy evaluations exemplify this approach by asking occupants to rate their satisfaction with IEQ factors on survey-based Likert-scale items (e.g., 1 = dissatisfied; 7 = satisfied) [2]. This approach may seem like an objective way to measure IEQ; however, the following problems cloud the resulting data. First, retrospective data collection relies on occupants’ memories of a space. Subjects might mis-remember or fail to recall their experience with the building [3]. Therefore, their ratings of IEQ factors are inadequate and incomplete reflections of their real-time experiences which dictate their behaviors in the building. Second, the tendency to reduce cognitive load means that occupants frequently select the middle choice of complex multiple-choice questions [4].
These biases challenge researchers who study the built environment to develop more comprehensive methods for assessing occupants’ behaviors. One exemplary method is implementing agent-based simulation (ABS), autonomous computational agents interacting with one another and their surroundings [5], to predict occupant behaviors in buildings. ABS is most effective in modeling behavioral patterns in hypothesized scenarios to schedule working shifts, regulate energy usage, evacuate for emergencies, and so on [6–8]. One caveat of using ABS in the built environment is that the computational system disregards the complexities underlying occupant behaviors (e.g., age, gender, and psychological state) [6]. This argument also applies to sensor-based and GPS-enabled data collection, with a heavy emphasis on the physical characteristics of the building, not the psychological aspects of occupants [9], [10].
Interaction geography, a novel approach to describing, representing, and interpreting human interactions with their environments across space and time [11], offers one solution to these challenges. Current implementations of interaction geography in the built environment include assessing occupant travel patterns in a museum [12] and in teacher-student-interactions in the classroom [13], [14]. Such implementations are limited, yet growing interest in interaction geography is evident through multiple studies focusing on the movements of building occupants [15–17]. However, tracking movements is an intensive and time-consuming data collection process that uses wearable sensors or camera recordings [12], [17].
This paper presents a time-and-cost efficient approach to exploring building occupant behavior via movements using Virtual Reality (VR) technology. In a pilot study, the authors analyzed the movements of 10 participants in a virtual museum to examine the extent to which interaction geography further the current understandings of building occupant behavior with the research question:
“What insights can Interaction Geography offer to the understanding of participant behavior in a VR museum?”
The authors, thus, explored movement patterns (obtained via Interaction Geography) to identify how participants interacted with a building setting via real-time data.
2. Literature Review
2.1. Building Occupant Behavior Research
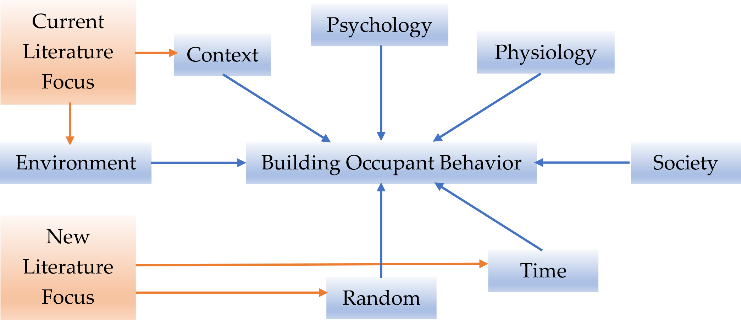
Building occupant behavior is under the influences of environmental, contextual, psychological, physiological, social, time, and random factors (Figure 1) [18]. Lighting, temperature, and indoor air are environmental factors. Building features such as orientation and construction are contextual; gender, age, and occupation are psychological; individual perceptions of temperature are physiological, cultural groups and organizational regulations are social factors [19]. Time-related events (e.g., working shifts) and random movements are influential as well [20]. Studies on building occupant behavior focus on environmental and contextual factors due to their quantifiable nature. For instance, researchers operationalize environmental factors as Indoor Environmental Quality (IEQ) variables that are measurable using satisfaction surveys (e.g., pre-and post-occupancy evaluations) and real-time devices (e.g., light meters, sensors) [21].
In the typical approach of post-occupancy evaluation (POE), occupants will complete a survey nine to twelve months after moving into a building. The two components that make up POE include (i) subjective perceptions (i.e., comfort and satisfaction) and (ii) physical measurements (i.e., building features) [9]. Both components contain IEQ variables such as temperature, light, noise, privacy, view, decoration, cleanliness, and so on. Occupants use Likert ratings to indicate their subjective perceptions of IEQ variables and their impacts. For example, the Building Use Studies (BUS) survey includes 7-point rating scales (e.g., uncomfortable to comfortable) for 11 IEQ variables (e.g., thermal, acoustic, appearance) [22]. Among IEQ variables, noise, air quality, light, and thermal are most influential to building occupants [1], [23].
Regarding physical measurements, devices like meters and sensors help researchers estimate how IEQ variables might influence building occupants over time. Energy and water consumption plus IEQ variables such as thermal, lighting, air quality, and acoustics make up most of this component [10]. Electricity usage (e.g., applicant loads), window, fan, and air conditioning operation are occupant behaviors of interest within residential and commercial buildings; these studies dominate the corresponding literature [19]. In [18], the authors discussed the current state of building occupant behavior through the following environmental and contextual factors (i.e., IEQ variables): window, lighting, shading, and air conditioning (AC). The focus on this subset of factors/variables is reasonable as professionals (e.g., engineers, architects, designers) and stakeholders (e.g., managers, owners) are concerned with the social and financial costs of energy consumption and life cycle of buildings. The authors in [24] also projected a decline in energy purchasing power of $11,258,2019 by 2099, implying that low-income populations would suffer from the inability to consume energy in response to climate change (i.e., global warming). According to the authors in [25], residential buildings that withstand a wide temperature fluctuation (e.g., from – 20°C to + 30°C) are costly, especially with a deficit in Gross Domestic Product (e.g., – 2% in 2017) due to global warming. Said costs explain why environmental and contextual factors (i.e., IEQ variables) predominate the current state of building occupant behavior research (Figure 1).
Viewing building occupant behavior as stochastic (i.e., random) with the variants between occupants that evolve over time represents a research paradigm shift [15]. Recent additions to POE include visual records, data of building structure/service/system, window sensors, GPS-tracked mobility, and so on [10]. In [6] the authors utilized an agent-based simulation (ABS) model and sensor-based data to predict probabilities of window operation in commercial buildings. This model reduces stochastic uncertainties by cross-referencing multiple IEQ variables like temperature, air, and humidity, in a single behavior: opening a window. However, the ABS model did not take into account the complex occupant interactions in real-world settings and the underlying psychological factors.
2.2. Interaction Geography
Interaction Geography is the comprehensive analysis of audiovisual data of interactions via sociocultural and social lenses [11]. Originating from interaction analysis in Computer Supported Collaborative Learning (CSCL), this approach converts and presents selective subsets of verbal and physical behaviors into transcripts so researchers can comprehend social events from insider perspectives [26]. The transcript is not merely a record of audiovisual data but a portrait that captures the emotions, behaviors, and potential intentions of people who engage in a social event [27]. Transcripts are vital to interaction analysis, but their production techniques have evolved little over the years. Language-processing software such as Microsoft Word is typically used to produce transcripts that include conversations and gestures or multimodal transcription [28]. Through the “presentation of text,” researchers preserve data integrity by not correcting “particulars” or “tiny things” that might reveal the sociocultural backgrounds or underlying thoughts of the event in participants [27], [29].
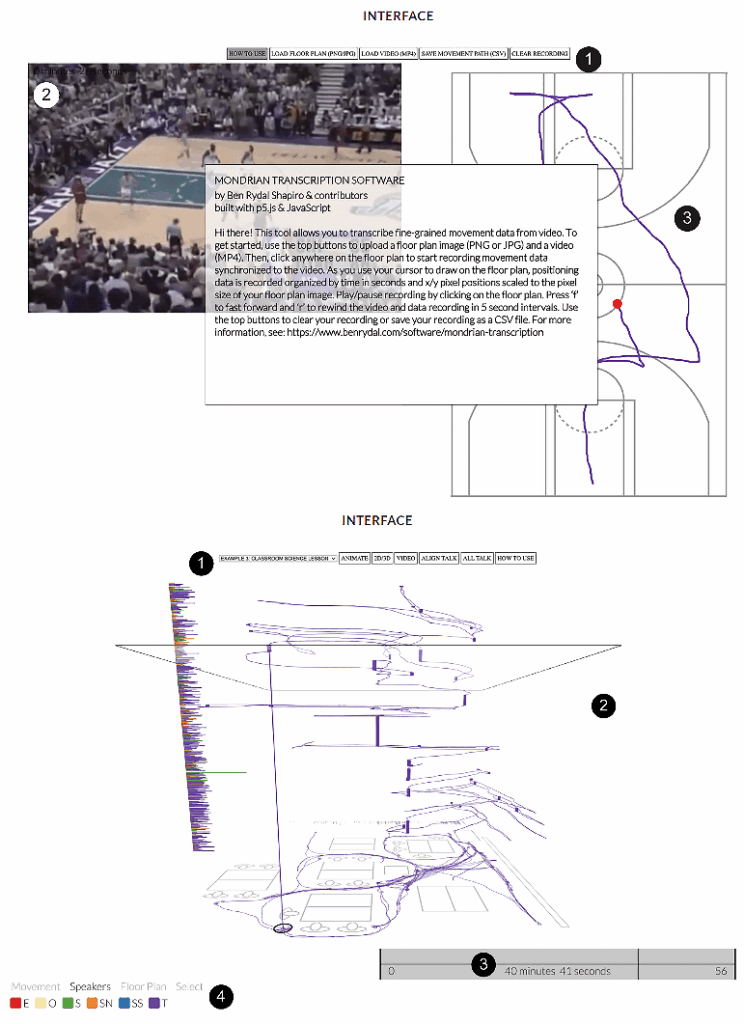
However, language-based transcription is inadequate to represent the intrinsic complexity of social behaviors. Interaction Geography combines qualitative analysis with time geography (i.e., time-space coordination of human behaviors in social events) to analyze audiovisual data [30], [31]. In [11], the author offered a cutting-edge method for Interaction Geography with two key components (Figure 2). First, via Mondrian Transcription web-based software, the author extracted and encoded participant movements and conversations over space and time from audiovisual data. This process resulted in a spreadsheet containing the pixel positions and movement transcripts of participants. Mondrian Transcription is among the earliest tools that transcribe movements and conversations (i.e., pixel positions and timed verbal exchanges). Second is Interaction Geography Slicer (IGS), a tool that syncs transcripts of movements and conversations with specific time frames in audiovisual data. IGS, therefore, enables exploratory analyses and dynamic visualizations of Mondrian transcription [26].
One application of Interaction Geography in buildings was to study museum visitor traveling patterns [12] and classroom interactions of teachers and students [13]. In [12], the authors analyzed 22 case studies with 72 hours of audio and video recordings of museum visitors to determine their movements, interactions, and technology use. The data illustrated how “visitors’ personal and social history, prior knowledge, and relationship to one another” influenced their choice of navigation and experience in a museum setting. In [13], the authors analyzed audiovisual excerpts of teacher-student interactions in two classrooms. Results indicated that the teachers developed repetitive circulation patterns around projector and tables. Their travel patterns also fluctuated during classroom hours, depending on the changes in instructional content. The findings raised concerns regarding how teachers should monitor their classroom movements and interactions to ensure effective teaching. Interaction Geography, thus, is helpful for the stochastic paradigm in building occupant behavior research as it reveals the randomness underlies occupants’ behavior across space and time.
3. Methodology
In this paper, the authors proposed a novel application of Interaction Geography in building occupant behavior research using Virtual Reality (VR). Like the authors in [12], we also chose a museum setting to explore occupant behaviors across time and space. VR technology enabled a time- and cost-efficient simulation of a museum and therefore was fundamental for piloting occupant behavior study in the chosen setting.
3.1. VR Museum Session
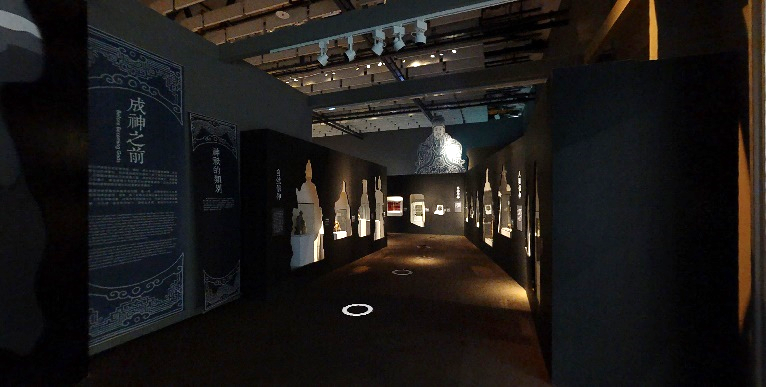
This pilot study utilized a public VR museum (Figure 3) from the Matterport website (https://matterport.com/) [32]. Participants ( ) each attended a VR session, which included 10 minutes of training and 20 minutes (or more) of exploring the VR museum. Using Meta Quest 2 headsets, the authors recorded VR sessions (in video and audio) as participants explored the virtual building space. Using the hand controllers, participants moved through the space by pointing at the white circles on the floor. The participants, however, could not interact with the artifacts (e.g., statues) and spatial elements (e.g., door) in the virtual museum as they are only 360-degree photographs.
3.2. Interaction Geography Transcription
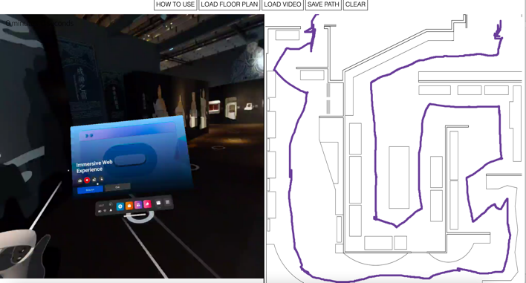
Mondrian Transcription (https://www.benrydal.com/software/mondrian-transcription) [12] helped transcribe recorded movements and interactions into pixel positions on a scale diagram that illustrates space arrangements in a building (i.e., a floor plan). The museum floor plan and the audiovisual recordings of the VR sessions were uploaded to Mondrian Transcription’s web-based interface (Figure 4) for manual tracing. Both files were then visible next to each other on a computer screen. By hovering the mouse cursor over the floor plan, the authors displayed a path that followed the participants’ movements as shown in the recording. The authors accurately traced the time-specific movements using the keyboard to play, rewind, and pause the recording. Analysis results included a traced floorplan demonstrating a two-dimensional (2-D) movement path and a spreadsheet logging every step of the participant in the space with x- and y-coordinates. The authors repeated this process with all recordings.
IGS (https://www.benrydal.com/software/igs) [12] was another process the authors used to visualize the traced movement paths of participants over time. We uploaded Mondrian Transcription transcripts (i.e., the spreadsheets with x- and y-coordinates) and the corresponding VR recordings to this web-based interface. IGS synchronized all movements and conversations of each participant following a timeline that equaled the length of each recording. This process resulted in an animated floor plan illustrating the 2-D movement path over a corresponding three-dimensional (3-D) conversation timeline. Hovering the cursor on top of the animated floor plan allowed the authors to rewind and analyze participant movements and conversations at a specific point in time.
4. Results
Participants ( ) in this pilot study were all college students in the 18 – 34 age group, with 67 % female and 33 % male. This was a convenient sample of volunteers who dedicated their time to participate in this study without compensation. Table 1 summarizes the demographics and logistics of all participants.
Table 1: Demographics and Logistics of Participants
ID No. | Time in VR | Use VR | Major |
P_1 | 12 minutes | Monthly | Design |
P_2 | 15 minutes | Yearly | Design |
P_3 | 20 minutes | Never | Design |
P_4 | 28 minutes | Never | Non-design |
P_5 | 17 minutes | Never | Non-design |
P_6 | 14 minutes | Never | Non-design |
P_7 | 14 minutes | Never | Non-design |
P_8 | 12 minutes | Never | Non-design |
P_9 | 30 minutes | Never | Design |
P_10 | 12 minutes | Monthly | Design |
4.1. Participant Behavior in a Virtual Space
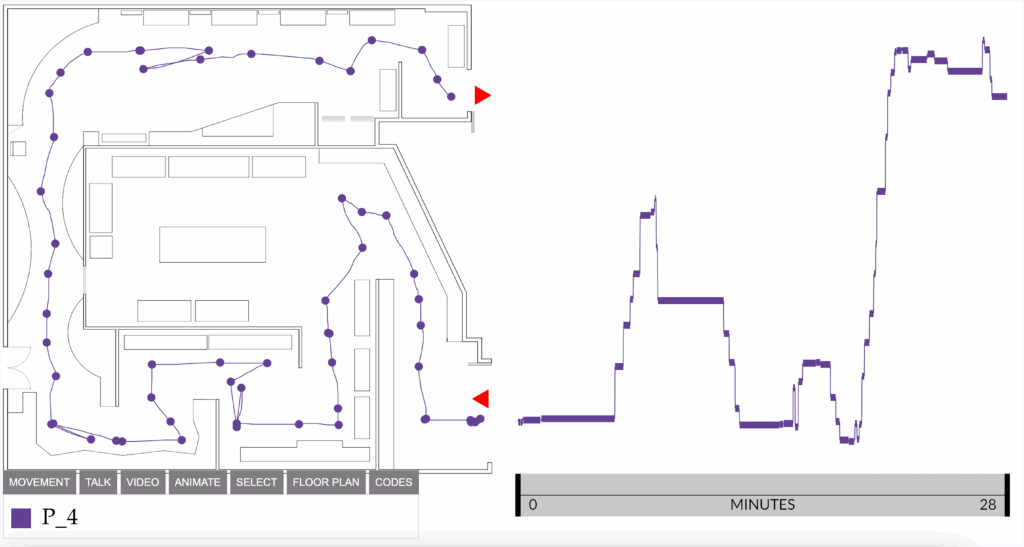
Most participants (70%) had minimal prior exposure to VR technology, and the average time they spent exploring the virtual museum was around 17 minutes. Participants all completed the VR session from start to finish. The floor plan (Figure 5) indicates the entrance (i.e., the upper red arrow) and the exit (i.e., the lower red arrow), with representations of objects (i.e., artifacts), display cases, and furniture in the VR museum. Although the white circles predetermined the VR museum navigation, participants were free to skip circles, come back, and stay for a certain amount of time at specific points. Such behaviors reflected how participants behaved in the VR museum regarding the space arrangement (e.g., whether display cases with the artifacts captured participant attention as planned by the interior designer). Figure 5 below illustrates the fourth participant’s (P_4) movements across space and time. P_4’s travel path is depicted on the museum floor plan, and the adjacent timeline displays the periods they spent in each area of the space throughout their recording. For 28 minutes, P_4 (a non-design major) traveled across the VR museum yet entirely skipped the central exhibition with multiple display cases and artifacts. This observation is one of the behavior discrepancies among participants. The section below summarizes notable findings from the movements across space and time of all participants in this pilot study. Instead of discussing the movements across space and time of each participant, the authors stacked the travel paths of those with the same background (i.e., design vs. non-design) together for a better comparison.
4.2. Movement Density and Personal Background
The authors analyzed all the transcripts and organized them into two categories based on movement density: design and non-design major participants. To give a comprehensive view of the results, the authors overlaid the traced paths of participants together on the floor plan for each category. Figure 6 depicts the paths of five participants who major in design (P_1, P_2, P_3, P_9, and P_10).
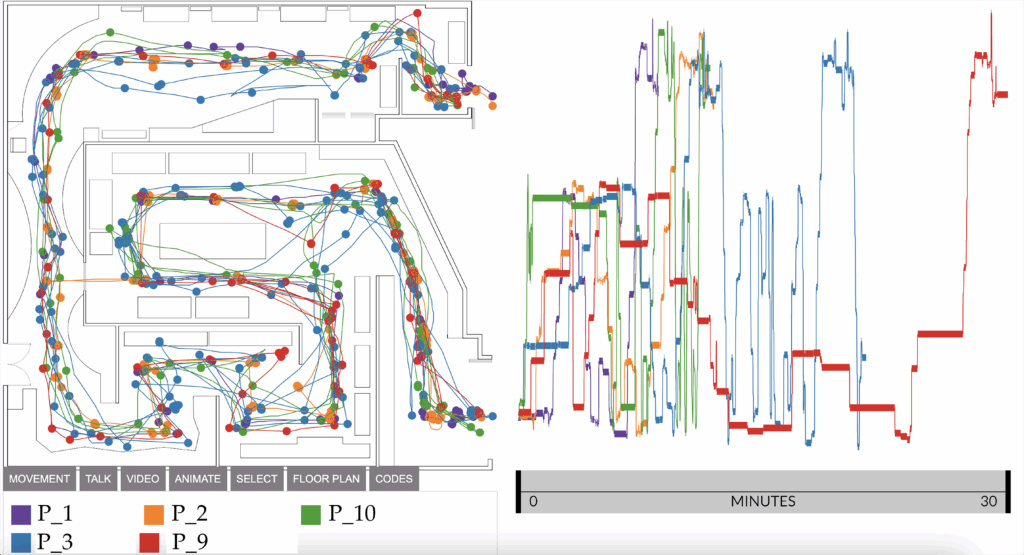
- Design-major participants had intense movement density; as shown in Figure 6, these participants spent more time at the entrance and exit (as shown in multiple traced points). They also returned to specific spots (as their paths overlapped several times). None of them skipped the central exhibition, and all followed the intended design of the floor plan.
- P_2 discovered the door that led directly to the central exhibition while exploring the lower part of the central exhibition. P_2 then crossed the door to a hallway previously visited and went back to the central exhibition to complete the upper part (the orange path in Figure 6). Notably, P_2 indicated only yearly use of VR, which is less prior experience than P_1 and P_10 indicated. The other participants all navigated from the entrance toward the long hallway leading to the central exhibition and ended at the exit.
- The synchronized timeline on the right of Figure 6 also reveals time durations spent throughout the VR museum. P_1 and P_3, for example, spent more time exploring at the beginning (about one-fourth and one-half of their time, respectively) but later skimmed through the space. Meanwhile, P_2, P_9, and P_10 divided their time more evenly across the VR museum.
Figure 7 illustrates the paths of five participants who were in non-design majors (P_4., P_5, P_6, P_7, and P_8). Their behavior showed some differences compared to their design counterparts.
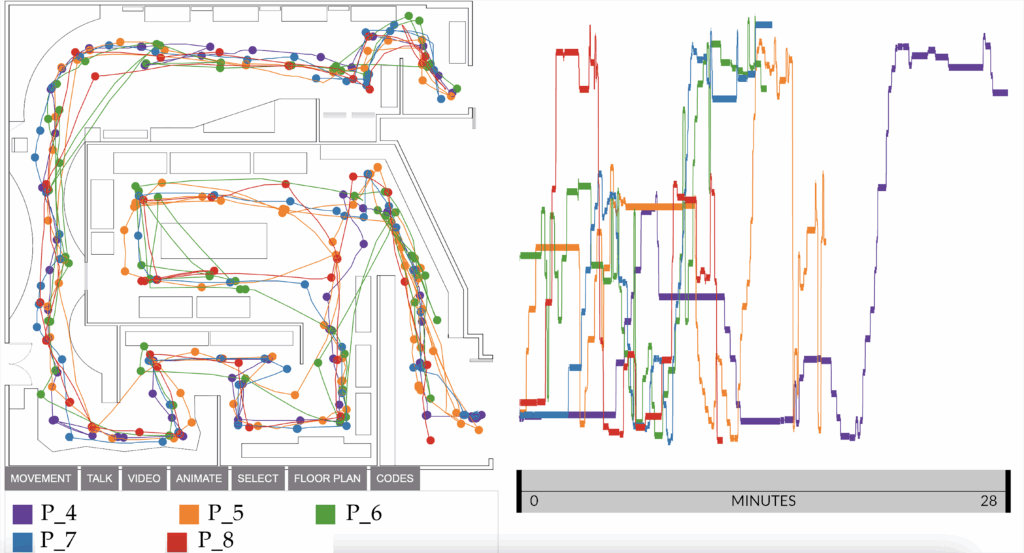
- The movement density was less condensed for non-design participants. Figure 7 shows that non-design participants spent equal time throughout the VR museum (i.e., as shown in the straightforward and less-overlapped paths). P_4, as a notable case, even skipped the central exhibition altogether (Figure 5). Especially, no participant ever noticed the door connecting the hallway and the central exhibition.
- The traced paths also differed from one participant to another. For instance, P_4 had the most straightforward path that started at the entrance and flowed through the hallway to the exit. P_5, on the contrary, explored the VR museum twice using the same path. P_6 repeatedly visited the upper left curved display in the hallway, the left upper corner display cases in the central exhibition, and three display cases at the end of the museum (as shown in the overlaps in the green traced path). P_7 showed a similar travel path to those of the design participants (i.e., following the intended navigation of the floor plan) yet visited each spot only once. P_8 revisited the first half of the VR museum yet skimmed through the last half. This participant also explored the central exhibition counterclockwise, thus, differing from the rest. It’s worth noting that all non-design participants had never used VR technology before.
- The synchronized timeline on the right of Figure 7 also reveals time durations spent in the VR museum. P_4 and P_5, for instance, spent more time exploring at the beginning (about one-half of their time) and moved faster at the end. P_6, P_7, and P_8 divided their time into small durations evenly spanned over the exploration.
5. Conclusion
Participants all finished the VR museum with an average time of 17 minutes from start to finish, except P_4, who skipped the central exhibition. Prior experience in VR technology, therefore, was not an influential factor in participant behavior. Similar to the authors in [12], this pilot study also found that “personal history” and “prior knowledge” (i.e., design vs. non-design majors) affected how participants navigated and experienced the virtual museum.
First, design-major participants explored the space more thoroughly than their non-design counterparts. They also spent extended time at the entrance and exit, where there were artifacts, signs, and display cases; revisited specific spots; and examined the central exhibition equally as the hallway. P_2 even found the door leading directly to the central exhibition, possibly due to their design knowledge (i.e., the psychological factor of occupation) which helped them navigate and engage with the space more effectively. The non-design participants paid less attention to the space, as evidenced by their behavior: for example, they did not go back to check artifacts and display cases along the paths, and P_4 skipped the central exhibition altogether. Said behaviors raise concerns about whether all occupants perceived space design intentions equally.
Second, either design or non-design participants explored the VR museum at their own pace. Some spent more time in the beginning and rushed at the end; others spent equal time periods in the whole space. This observation shows an underlying social factor relating to personal interests and connection to certain artifacts or display cases. The degree of personal interest one has with the space might affect their behaviors [12].
One limitation of this pilot study is that each participant explored the VR museum independently, which does not account for social interactions between them. Moreover, the VR museum is a 360-degree-captured environment or a compilation of multiple 2-D images of a real space. Participants could not interact with artifacts, display cases, and furniture. Future research will use an interactive VR environment so that participants can interact with the objects in their surroundings. The authors hope to gain further insights into occupant behavior via Interaction Geography and more sophisticated VR technology.
Conflict of Interest
The authors declare no conflict of interest.
Acknowledgment
The authors thank James Amann and the student workers at the Creative Media Industries Institute, Georgia State University for their hospitality and support. This study is supported by the 2022 Summer Research Fund for faculty from Welch School of Art and Design, College of the Arts, Georgia State University.
- L. T. Graham, T. Parkinson, S. Schiavon, “Lessons learned from 20 years of CBE’s occupant surveys”, Buildings and Cities, vol. 2, no. 1, pp. 166–184, 2021. http://doi.org/10.5334/bc.76
- C. D. Roa, S. Schiavon, T. Parkinson, “Targeted occupant surveys: A novel method to effectively relate occupant feedback with environmental conditions”, Building and Environment, pp. 107129, 2020. https://doi.org/10.1016/j.buildenv.2020.107129
- K. A. Young, “Direct from the source: the value of’think-aloud’data in understanding learning”, Journal of Educational Enquiry, 2005. http://hdl.handle.net/10453/6348
- C. D. Darker, D. P. French, “What sense do people make of a theory of planned behaviour questionnaire? A think-aloud study”, Journal of health psychology, vol. 14, no. 7, pp. 861–871, 2009. doi: 10.1177/1359105309340983
- C. Macal, M. North, “Introductory tutorial: Agent-based modeling and simulation”, Proceedings of the winter simulation conference 2014, pp. 6–20, 2014. https://doi.org/10.1109/WSC.2014.7019874.
- M. Jia et al., “A systematic development and validation approach to a novel agent-based modeling of occupant behaviors in commercial buildings”, Energy and Buildings, vol. 199, pp. 352–367, 2019. https://doi.org/10.1016/j.enbuild.2019.07.009
- S. Norouziasl, A. Jafari, C. Wang, “An agent-based simulation of occupancy schedule in office buildings”, Building and Environment, vol. 186, pp. 107352, 2020. https://doi.org/10.1016/j.buildenv.2020.107352
- K. R. Rozo et al., “Modelling building emergency evacuation plans considering the dynamic behaviour of pedestrians using agent-based simulation”, Safety science, vol. 113, pp. 276–284, 2019. https://doi.org/10.1016/j.ssci.2018.11.028
- P. Li, T. M. Froese, G. Brager, “Post-occupancy evaluation: State-of-the-art analysis and state-of-the-practice review”, Building and Environment, vol. 133, pp. 187–202, 2018. https://doi.org/10.1016/j.buildenv.2018.02.024
- D. Sanchez Leitner, N. Christine Sotsek, A. de Paula Lacerda Santos, “Postoccupancy evaluation in buildings: Systematic literature review”, Journal of Performance of Constructed Facilities, vol. 34, no. 1, pp. 03119002, 2020. . https://doi.org/10.1061/(asce)cf.1943-5509.0001389
- B. R. Shapiro, “What About Interaction Geography to Evaluate Physical Learning Spaces?”, Teacher Transition into Innovative Learning Environments, pp. 167–179, 2021. https://doi.org/10.1007/978-981-15-7497-9_14
- B. R. Shapiro, R. P. Hall, D. A. Owens, “Developing & using interaction geography in a museum”, International Journal of Computer-Supported Collaborative Learning, vol. 12, no. 4, pp. 377–399, 2017. https://doi.org/10.1007/s11412-017-9264-8
- B. R. Shapiro, B. Garner, “Classroom interaction geography: visualizing space & time in classroom interaction”, Journal of Research on Technology in Education, pp. 1–15, 2021. https://doi.org/10.1080/15391523.2021.1927265
- G. Fernandez-Nieto et al., “Classroom Dandelions: Visualising Participant Position, Trajectory and Body Orientation Augments Teachers’ Sensemaking”, CHI Conference on Human Factors in Computing Systems, pp. 1–17, 2022. https://doi.org/10.1145/3491102.3517736
- S. Carlucci et al., “Modeling occupant behavior in buildings”, Building and Environment, vol. 174, pp. 106768, 2020. https://doi.org/10.1016/j.buildenv.2020.106768
- M. Arslan, C. Cruz, D. Ginhac, “Understanding occupant behaviors in dynamic environments using OBiDE framework”, Building and environment, vol. 166, pp. 106412, 2019. https://doi.org/10.1016/j.buildenv.2019.106412
- N. Haidar et al., “Towards a new graph-based occupant behavior modeling in smart building”, 2019 15th International Wireless Communications & Mobile Computing Conference (IWCMC), pp. 1809–1814, 2019. https://doi.org/10.1109/IWCMC.2019.8766569
- F. Stazi, F. Naspi, M. D’Orazio, “A literature review on driving factors and contextual events influencing occupants’ behaviours in buildings”, Building and Environment, vol. 118, pp. 40–66, 2017. https://doi.org/10.1016/j.buildenv.2017.03.021
- E. Delzendeh et al., “The impact of occupants’ behaviours on building energy analysis: A research review”, Renewable and sustainable energy reviews, vol. 80, pp. 1061–1071, 2017. https://doi.org/10.1016/j.rser.2017.05.264
- S. Chen et al., “The impacts of occupant behavior on building energy consumption: A review”, Sustainable Energy Technologies and Assessments, vol. 45, pp. 101212, 2021. https://doi.org/10.1016/j.seta.2021.101212
- C. Shen, K. Zhao, J. Ge, “An overview of the green building performance database”, Journal of Engineering, vol. 2020, 2020. https://doi.org/10.1155/2020/3780595
- Arup, “BUS methodology.” https://busmethodology.org.uk/ . (accessed: 05-Oct-2021).
- I. A. Sakellaris et al., “Perceived indoor environment and occupants’ comfort in European “modern” office buildings: The OFFICAIR study”, International journal of environmental research and public health, vol. 13, no. 5, pp. 444, 2016. https://doi.org/10.3390/ijerph13050444
- A. Rode et al., “Estimating a social cost of carbon for global energy consumption”, Nature, vol. 598, no. 7880, pp. 308–314, 2021. https://doi.org/10.1038/s41586-021-03883-8
- N. Stern, J. E. Stiglitz, The social cost of carbon, risk, distribution, market failures: An alternative approach, vol. 15, , National Bureau of Economic Research Cambridge, MA, USA, 2021. https://files.static-nzz.ch/2021/4/26/7e32b21f-81b9-4033-907c-7aaeba85e7a5.pdf
- A. Mathur, B. R. Shapiro, “Interactive Transcription Techniques for Interaction Analysis”, 16th International Conference of the Learning Sciences (ICLS), pg. 19-26, 2022. https://scholarworks.gsu.edu/ltd_facpub/46
- A. Hepburn, G. B. Bolden, Transcribing for social research, Sage, 2017.
- J. Bezemer, D. Mavers, “Multimodal transcription as academic practice: A social semiotic perspective”, International Journal of Social Research Methodology, vol. 14, no. 3, pp. 191–206, 2011. https://doi.org/10.1080/13645579.2011.563616
- G. Jefferson, “Glossary of transcript symbols with an introduction”, Pragmatics and Beyond New Series, vol. 125, pp. 13–34, 2004.
- T. Hägerstrand, “Reflections on “what about people in regional science?””, Papers of the Regional Science Association, vol. 66, no. 1, pp. 1–6, 1989. https://doi.org/10.1007/BF01954291
- B. Jordan, A. Henderson, “Interaction analysis: Foundations and practice”, The journal of the learning sciences, vol. 4, no. 1, pp. 39–103, 1995. https://doi.org/10.1207/s15327809jls0401_2
- Matterport Inc., “Matterport.” https://matterport.com/ . (accessed: 03-Sep-2022).