SimulatorBridger: System for Monitoring Energy Efficiency of Electric Vehicles in Real-World Traffic Simulations

(This article belongs to the Special Issue on Special Issue on Multidisciplinary Sciences and Advanced Technology (SI-MSAT 2024) and the Section Transportation Science & Technology (TST))
Export Citations
Cite
Almutairi, R. , Berg, G. and Morgan, G. (2024). SimulatorBridger: System for Monitoring Energy Efficiency of Electric Vehicles in Real-World Traffic Simulations. Journal of Engineering Research and Sciences, 3(6), 33–40. https://doi.org/10.55708/js0306004
Reham Almutairi, Giacomo Berg and Graham Morgan. "SimulatorBridger: System for Monitoring Energy Efficiency of Electric Vehicles in Real-World Traffic Simulations." Journal of Engineering Research and Sciences 3, no. 6 (June 2024): 33–40. https://doi.org/10.55708/js0306004
R. Almutairi, G. Berg and G. Morgan, "SimulatorBridger: System for Monitoring Energy Efficiency of Electric Vehicles in Real-World Traffic Simulations," Journal of Engineering Research and Sciences, vol. 3, no. 6, pp. 33–40, Jun. 2024, doi: 10.55708/js0306004.
The increasing popularity and attention in Vehicular Ad-hoc Networks (VANETs) have prompted researchers to develop accurate and realistic simulation tools. Realistic simulation for VANETs is challenging due to the high mobility of vehicles and the need to integrate various communication modalities such as Vehicle-to-Infrastructure (V2I) and Vehicle-to-Vehicle (V2V) interactions. Existing simulators lack the capability to simulate VANET environments based on IoT infrastructure. In this work, we propose SimulatorBridger, a novel simulator that bridges IoTSim-OsmosisRES with SUMO, a traffic simulator, to simulate VANET environments with integrated IoT infrastructure. Our study focuses on analyzing the generated dataflows from V2I and V2V interactions and their impact on vehicle energy efficiency. Even though On-Board Units (OBUs) appear to have insignificant energy demands compared to other vehicle energy consumptions such as electric motors or auxiliary systems (HVAC, lights, comfort facilities), we found a near-perfect correlation between the intensity of communication dataflows and the battery consumption. This correlation indicates that increased communication activity can contribute to an increase in overall energy consumption. Furthermore, we propose future research directions, including traffic rerouting based on battery consumption optimization, which can be efficiently tested using our simulation platform. By including communication energy costs in the design of energy-efficient vehicular networks, these insights contribute to a deeper understanding of energy management in VANETs
1. Introduction
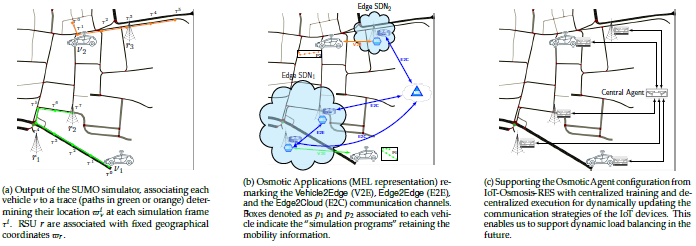
The advancement of technology leads us towards a new area of communication connecting two or more vehicles to exchange data within an IoT ecosystem. This drives us through a new VANET (Vehicular Adhoc Network) framework making the conventional transport system safer, full of infotainment, convenient, and smart. In VANET research, re- searchers aim to develop a simulator platform that provides quick and cost-efficient transmission of data for passenger safety and comfort. As described earlier, VANET simulators consist of two components: Traffic Simulators (software environments that generate vehicle movements in trace files) and Network Simulators (used to test the performance of networking protocols). The network simulators are used to build communication topologies, evaluate network protocols, and exchange routing information between the nodes after importing the traces of mobility models generated by traffic simulators. These mobility models, which are the depiction of real-world scenarios, are called traces and contain the simulated infrastructure and event information such as vehicle speed, type, origin, destination, arrival time, arrival rate, maximum density, number of lanes, speed limits, capacity, intersection type, queuing, service distribution, service rate, traffic signs, location, etc. Green and orange paths in Figure 1a provide a minimalistic view of these traces where only the vehicle’s geographical position is considered. The traces generated with the mobility generator, microscopic or macroscopic [1, 2], are imported into the network simulator and generate a vehicular program: boxes surrounding paths in Figure 1b provide a depiction of the vehicular programs associated with simulated IoT agents.
1.1. Objective and motivation
We have used IoTSim-OsmosisRES [3] as the IoT simulator for our proposed coupling platform, as it is the only IoT simulator considering energy management, a variety of power sources, and network infrastructure, while others can neither simulate floating weather conditions, nor renewable energy sources. However, the current implementation of the IoT simulator, IoTSim-OsmosisRES assumes IoT de- vices to be in fixed locations. So, IoT device mobility is not supported. Hence, we propose a new simulator Sim- ulatorBridger that couples a state-of-the-art IoT simulator (IoTSim-OsmosisRES [3]) with a traffic simulator (SUMO [4]) to simulate VANET environments. This proposed simulator is designed to meet these goals: coupling the IoT simulator IoTSim-OsmosisRES with the traffic simulator, SUMOU, enhancing IoTSim-OsmosisRES capabilities to be able to simulate moving IoT devices and to support battery information associated to the IoT devices (vehicles).
Our proposed simulator allows a smooth integration of mobility, IoT devices, heterogeneity, and battery management in highly heterogeneous and dynamic environment. Still, we demonstrate that our architecture has sufficient flexibility to bridge any possible traffic simulator using a plug-and-play approach. We provide all the necessary functionality for the accurately couple simulators that can meet the complexity of traffic environments by using the most recent IoT simulator and the first simulation framework that offers unified modelling and simulation of complex IoT applications over heterogeneous edge-cloud environments. Preliminary results (§5) remark the partial correctness of our simulator, as the vehicular battery consumption distribution follows the same trend as packet distribution. By limiting the communications to exchanging one single packet between the cloud and the IoT node, we also show that the number of communications follows a similar distribution to the former. We finally show that increasing the number of packets travelling in the network increases the overall time required by the network to process these, as bottlenecks might occur in the network simulator infrastructure. Future work will focus on testing different communication policies aiming to decrease the packet processing overhead within the network. These preliminary fidelity results remark the adequacy of using the simulator as a digital twin for a realistic urban mobility scenario, thus allowing any policy-maker to test disparate network configuration and traffic distributions to minimise network communication overload.
1.2. Use Case Scenario
The recent Car-as-a-Service paradigm [5] has remarked the possibility of using the cars’ IoT sensors not only for the personal purposes of travellers but, with the driver’s agreement, for the benefit of the entire community. As most modern cars are equipped with navigation systems and video cameras, cars can collect videos and images of their surroundings and geo-tag such information. This might will constitute a communication bottleneck degrading the overall communication performance [9]. To achieve success in these situations, the traffic load needs to be balanced [10] to reduce communication delays. Given that the traffic flow might be redirected at run-time, this motivates the representation of each RSU as a specific Edge [3]. The exploitation of Osmotic Computation [11] eases communication flow management, thus dynamically establishing new streams. This also motivates the definition of a simulator bridging traffic simulation to network communication systems.
2. Design of the Simulator
Our framework twins traffic simulation and IoT simulation. Thus, it incorporates well-known models for road traffic micro-simulation with a comprehensive selection of models of network protocols. By running the vehicular generator, we collect all the vehicular geographical information and the position of the Edge node (§2.1). This is required to set up the network topologies associated with each Edge node and determine the vehicular program to be injected into the IoT devices in the IoT simulator (§2.2). At each simulation time, each IoT device will query a centre to determine whether the IoT device shall to establish communication with the cloud through an edge device or not (§2.3). Upon confirmation, the IoT device directly contacts the MEL router associated with the edge node of choice, establishing communication between the IoT device and the cloud through one of its hosts (§2.4).
2.1. Vehicular Data Collection
First, the simulator collects the mobility information generated by the traffic generator. This simulator might be configured by setting the begin τb and the end τe simulation time, as well as a temporal granularity δ defining the sampling rate of the vehicular information. This allows do determine the time at the i-th simulation step for each vehicle ν as the following relation:
$$\tau_{\nu}^{i} = \left\{ \begin{array}{ll} \tau_{\nu}^{i-1} \, \delta & i > 0 \\ \tau_{b} & \text{oth.} \end{array} \right.$$
At the end of the traffic generation, the VANET simulator returns a list of pairs associating each simulation time τi to a geographical location ϖi for each vehicle ν. Figure 1a provides a graphical depiction of such traces, highlighted in either green or orange. From the network topology, we might also infer the geographical position of each RSU of interest r alongside its position ϖr and its communication radius ρr. This operation is performed by a simulator wrap- per, which provides a standard interface for generating the data of interest in a uniform representation independently from the specific traffic simulator of choice.
2.2. Software Defined Network Configuration
The next step assumes that each vehicle ν is associated with just one single IoT device potentially communicating with the cloud infrastructure. We collect the sequence of pairs
\([(\tau_{\nu}^{0}, \varpi_{\nu}^{0}), \ldots, (\tau_{\nu}^{n}, \varpi_{\nu}^{n})]\) as a vehicular program ν that will be injected within the IoTOsmosis-RES simulator.
This will allow the IoT device to update its position at each instant of the SUMO simulation time in the network simulator. Fig. 1b represents such vehicular programs as minimizations of the traces represented in Fig. 1a.
Contextually, we define Software-Defined Wide Area Networks for the RSU nodes. To do so, we first define an undirected graph G V, E, where the vertices V list the RSU nodes r obtained from the VANET simulator, and the edges establish a communication channel between two distinct RSU r and r′ if and only if they can both communicate between each other:
$$\forall r, r’ \in V.\ (r, r’) \in E \leftrightarrow r \ne r’ \land \|\varpi_r – \varpi_{r’}\| \le \min(\rho_r, \rho_{r’})$$
For each strongly connected component of such graph, we establish a distinct Edge SDN with an associated Datacenter and Software-Defined Network Controller, where each RSU is described as an Edge device associated with at least one host. Each light blue cloud in Fig. 1b represents a distinct Edge SDN, for which only the Edge nodes are remarked. We also set up a Cloud network towards which each IoT device will communicate to send the sensed data, as well as an SDWAN network bridging each Edge SDN to a Cloud SDN. Both these structures are engulfed in the white cloud in Fig. 1b. Last, we completely set up the edge connectivity between these networks by setting up Edge2Edge and Edge2Cloud communication links. VehicleToEdge links will be established at simulation time.
2.3. Osmotic agents module
The osmotic agents’ module is exploited for simulating network discovery procedures and determining each IoT device which should be the best edge node for establishing the communication. This cannot be necessarily determined at the local level, as each IoT device has only the information of which edges it can communicate with, but it doesn’t know which is going to be the best neighbouring agent towards which establish the first-mile communication towards for reaching the cloud. An IoT device acts as an reinforcement agent, which sends the information about the observed environment to the central agent. In particular, each IoT device sends its geographical position, while the geographical position of each edge device is known a priori. We implemented two specific types of central agents:
- NearestCentralAgent: for each querying IoT device, the central agent will always respond with the nearest Edge device to the IoT that is within mutual signal This strategy does not require any alteration to the SDN Routing Policy of each Edge Network, which might still exploit the SHORTESTPATHMAXI- MUMBANDWIDTH discussed in [12].
- FlowDataCenterAgent: after associating each IoT device to a possible edge device, the agent runs a multi- source and multi-target minimum-cost flow problem for establishing the best strategy to minimize the channel communication. This algorithm will then return for each IoT device the best edge device. This also requires updating the SDN Routing Policy Maximum- FlowRoutingPolicy associated with each network via its SDN Controller, thus returning the paths calculated by the Central Agent.
Upon reception of a non-empty edge device, the IoT will generate a novel Osmotic Application and start communication towards the cloud through the elected edge node. Figure 1c illustrates the bidirectional communication flow between IoT or SDN Rounters and the Central Agent.
2.4. Dynamic Adaptive Routing
In osmotic computing, each IoT device directly interacts with MicroELements (MEL) software components that might be instantiated anywhere in a given network associated to Edges [3]. To faithfully represent real communication scenarios, an IoT device must directly establish communication with a precise edge node [13]: the Adaptive Routing in [3] was further extended to directly select the MEL associated with a given edge node instead of picking one in a round- robin fashion. As IoT-OsmosisRES further associates a MEL to one or more hosts, the routing algorithm picks one of the hosts running the MEL as its first-mile communication point. Contextually, the host establishes the communication channel with the cloud network indicated by the IoT device, thus starting the communication.
3. mplementation in Java
The proposed simulator, SimulatorBridger, is programmed using the Java programming language, and it is avail- able in Github 2. The NetworkTopology.java class in the SimulatorBridger-IOTSimOsmosisRES module is crucial for setting up the network layer in the simulation. It generates a topological network, which is used to simulate latency in network traffic. The IoTDevice.java class represents IoT devices within the IoTSimOsmosisRES framework. The CloudletScheduler class is responsible for scheduling tasks in the cloud. And EdgeDeviceManager class is managing edge devices.
The implementation of the SimulatorBridger platform contains several modules and a large number of Java source files. Here’s an overview of its structure:
SimulatorBridger-core component contains shared dependencies and core functionalities used across the project. It serves as the foundational codebase that other modules in the project rely on.
SimulatorBridger-traffic-information-collector involves running the traffic simulator and collecting data from it. It processes the output of the simulation, identifying IoT nodes and Edge nodes. The Edge nodes are used for interactions by the IoT nodes.
SimulatorBridger-central-agent-planner provides a theoretical omniscient algorithm capable of scheduling time as required. Depending on the network simulator chosen, it also generate potential network connectivity information based on the IoT and Edge information provided by the simulation.
SumoOsmosisBridger is an example that bridges all the simulations together with Dynamic IoTSimOsmosisRES simulator. It illustrates how the components can be integrated in a seamless manner.
Each of these components plays a specific role in integrating and processing traffic data within the IoTSimOsmosisRES environment. The process starts with data collection and processing, followed by planning and scheduling using the central agent planner, and finally, the integration of all these elements through the SumoOsmosisBridger to work with Dynamic IoTSimOsmosisRES. This integration allows for a comprehensive simulation environment that can handle complex IoT and traffic data scenarios.
4. Dataset and Experiment Setup
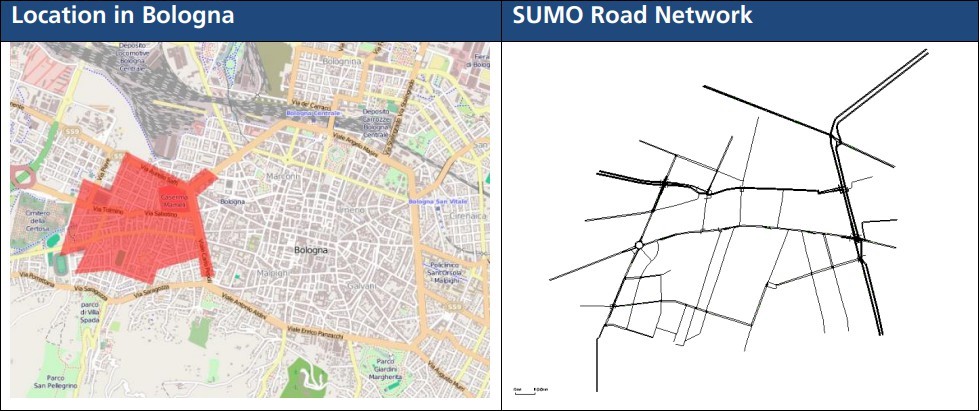
This section covers running the Bologna dataset 3, through our proposed simulator, where vehicles have an embedded IoT device and RSU are Edge nodes associated to MELs. Fig. 3 shows the SUMO network of this dataset. The dataset has 16 RSUs and 239 vehicles. The Bologna scenario includes the area around the football stadium and was set up to simulate the mobility of big events such as football matches or concerts.
Our experiments orchestrate a traffic simulator (SUMO) with a network simulator (IoTOsmosis-RES) with each simulation second in the former corresponding to a second in the latter. We arbitrarily set the IoT battery consumption rate to 1.02% when a vehicle communicates with a MEL. We assumed embedded IoT devices cannot be re-charged to better analyse the simulator’s correctness by correlating the number of packets sent by an IoT device with its battery consumption. When a vehicle was near an RSU in the traffic simulator, we scheduled a new communication between the IoT device embedded in the vehicle and the Cloud via the Edge node representing the RSU in the network simulator. This schedule is selected according to the granularity δ of the traffic simulator: in our scenario, this is set to start every 1 second. In this time frame, the IoT device in the vehicle sends one single packet. The simulation time for these plots begins at the start of the traffic simulator and ends when the last MEL has successfully sent all the packets to the cloud.
Our simulator assumes each RSU is an Edge device containing multiple MELs. As per the previous discussion, the network simulator was extended to establish direct communication between IoT and Edge devices by resolving an available MEL associated with the Edge device. A round-robin policy selects an available MEL in the Edge node to ease each MEL’s workload. For this experiment, the maximum simulation time of IoTOsmosis-RES was 3898.4s, corresponding to 100% of the simulation, starting at the
same time, the maximum time for the SUMO simulator was 186.7s (τe), with vehicles no longer able to enter the urban environment after around 55% of the overall traffic simulator time, or 100s. From this, as the number of vehicles in the simulation decreases, the number of starting communications will also decrease, resulting in a normal distribution for both the number of communicating vehicles
and the number of packets sent. The traffic simulation takes less than 5% of the total simulation time. This is due to packet network delays which delayed communication patterns even though the IoT devices sent no new packets. We consider all communications between an IoT vehicle and a MEL.
5. Analysis and Results
In this section, we analyze and discuss the key findings from the Bologna dataset experiment conducted on the SimulatorBridger platform. The results of our simulation are meticulously examined, focusing on critical performance metrics and the effectiveness of various strategies implemented throughout the process. This analysis not only highlights the successes and challenges encountered but also provides valuable insights into the practical implications and potential improvements for future iterations.
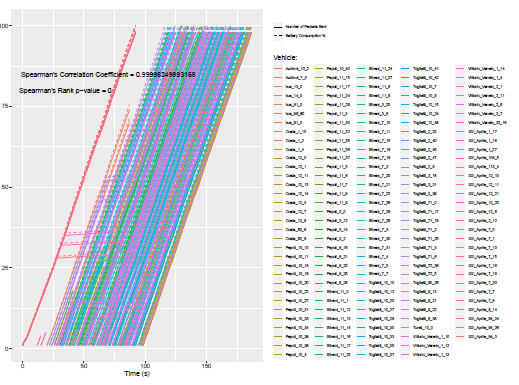
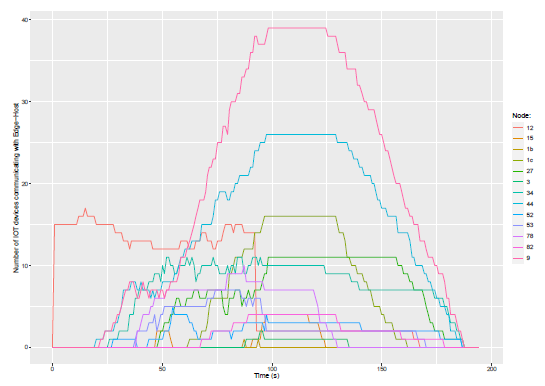
Fig 4 shows that each of the 163 embedded IoT devices (in distinct colours) shows an almost perfect correlation be- tween the number of packets sent (solid line) and its battery consumption (dashed). The Spearman correlation between those for each vehicle is almost 1 , with a p-Value of 0 , thus indicating a very strong correlation between these two. From Fig 5, for most of the RSUs the number of connected to each has an approximate normal-like distribution, with most plateauing after the 100s mark, which is at about the 55% mark in VANET simulation time mentioned earlier. A maximum number of 39 IoT devices were connected to a single MEL and its Edge node at any time. This figure also explicitly shows vehicles starting at an RSU, as Edge#12 has 15 connected vehicles from the very beginning of the simulation. This figure also shows the simulation time used for these plots, the simulation time starts at time 0 seconds and then stops around 190 seconds once all the RSUs have no more connected vehicles. Next, we tested if there was a strong correlation between the number of vehicles in the simulation within a given time interval, with the overall battery consumed within that same time interval, as common-sense suggests that an increase of the number of the vehicles should match an increase of communications be- tween a IoT and Edge devices, thus reflecting in an increase of the overall battery consumption. We found no strong correlation between these two aspects as, even though more vehicles lead to an increase of communications, this does not necessarily entail that either more communications should take place (e.g., vehicles might not be in a region covered by RSUs) or even that all vehicles have the same number of communications within the same time interval.
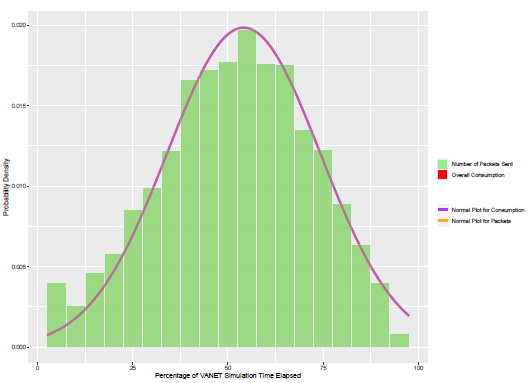
Following this, any potential correlation between packets sent from vehicles and the overall battery consumption was investigated. Fig 6 shows the probability density of the overall battery consumed by all vehicles in the simulation (within each 5% time interval of simulation time), along with probability density of the number of packets sent by all vehicles (always within each 5% time interval of simulation time). From Fig 6 both sets of data not only closely follow a normal distribution, but also are closely correlated with each other, as both distributions and both normal plots completely overlap one another. These two variables correlating with each other was expected, as in the current simulator setup, the packets being sent are responsible for the battery consumption, and the fact that we found these two variables do in fact correlate indicates that the simulation is behaving as expected. Fig 6 shows a spike occurring at the 35 − 45% for both the overall consumption and the number of packets sent. This spike can be explained in terms of Fig 7 showing the distribution of the communications starting within each traffic and VANET simulation time interval: this spike is also present for the number of starting communications within this same time interval. Given the current simulator settings of a vehicle sending a single packet as a result of communication with an RSU, this likefor-like behaviour of communications and packets sent is not only expected but demonstrates the simulator is functioning correctly. The reason more packets were sent and therefore why more battery was consumed in this time interval is due to more communications occurring within this time interval. Fig 7 also validates our preliminary hypothesis observing that the number of starting communications should drop after a 55% elapse of the Sumo simulation time.
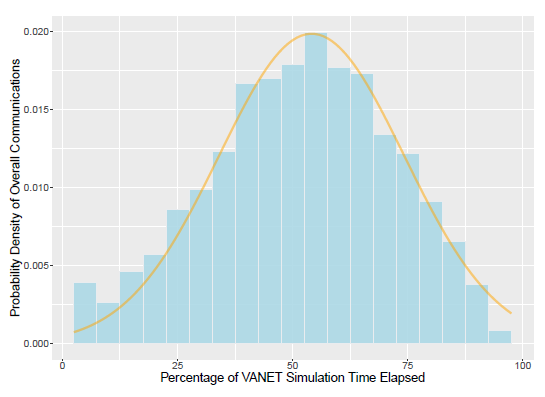
We might also observe another spike at the beginning of the simulation where the influx of traffic starts entering the simulation while approaching RSUs, thus justifying the increase of the overall number of communications. The explanation for the initial drop-off between the first two intervals, 0 − 5% and 510%, can be explained with the first interval being artificially high as a node is placed very close to where vehicles initially join when the simulation starts. This behaviour can also be seen on Fig 5 as Edge#12 having 15 connected vehicles just 1 second into the simulation.
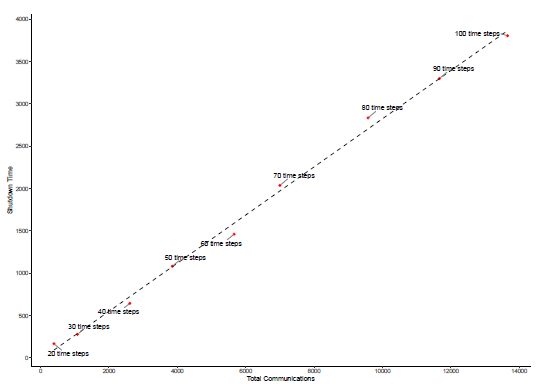
From Fig 8 vehicles at the start of the simulation enter from the most southwestern entrance, which, when factoring in the 100 m radius of communication of the nodes, explains how vehicles are able to connect to Edge#12 (i.e. the light blue Node 12 in the bottom left of the plot). After 190 seconds in the simulation, the Sumo simulation stops, and therefore we observed no vehicles connected to any of the RSUs. In fact, the IoTOsmosis-RES still has to wait for all the Edge nodes to send their packets to the cloud while receiving an acknowledgement for this. The discrepancy between the end of the traffic simulator and the Network simulator also matching the end of the VANET simulator has been cut off for the sake of legibility. This processing of all the packets by the network infrastructure therefore takes over 3700 seconds: we refer to this as shutdown time. Fig 9 shows how this shutdown time is affected by the number of total communications in the simulator: the more time steps in the simulation, or the longer vehicles are allowed to navigate in the traffic simulator, the more the communications between vehicles and RSUs take place. This matches the intuition that more time for potential communications entails an increase in the number of communications. The more relevant result from this figure with respect to the shutdown, however, shows that more communications lead to a longer and longer shutdown time.
Hence, the effectiveness of SimulatorBridger was validated through both simulation and experimental tests using the Bologna dataset. The simulation results demonstrated a near-perfect correlation between packet transmission and battery consumption, with a Spearman correlation coefficient close to 1 and a p-value of 0, indicating strong statistical significance. Experimental tests mirrored these findings, showing similar trends and validating the simulator’s ac- curacy in modeling real-world communication patterns and their impact on energy usage. Minor discrepancies between the simulation and experimental data were observed, primarily due to real-world variances such as sensor inaccuracies and environmental factors. Statistical tests confirmed that both datasets followed similar distributions, with most errors within acceptable limits. Overall, the strong alignment between simulation and experimental results underscores the reliability of SimulatorBridger. These findings demonstrate the robustness of SimulatorBridger and its value as a tool for studying and optimizing vehicular networks.
Finally, the results offer significant improvements over previous simulation benchmarks. The correlation analysis between packet transmission and battery consumption reveals a Spearman correlation coefficient close to 1, indicating a strong relationship between communication activity and energy usage. Enhanced traffic flow and load balancing capabilities are achieved through dynamic management of communication loads among RSUs, resulting in smoother traffic flow and reduced bottlenecks. The scalability of the simulator is demonstrated by its ability to manage extensive simulations, addressing the scalability issues faced by earlier systems. Additionally, the detailed energy management features, considering various power sources and their consumption rates, set SimulatorBridger apart from traditional models that often overlooked these aspects. These findings affirm the simulator’s effectiveness in providing a robust platform for studying and optimizing vehicular network performance and energy efficiency.
6. Conclusion and future works
Due to the high mobility of vehicles in VANETs, realistic simulation is a challenging task. This paper proposes a novel simulator, SimulatorBridger, by bridging the IoT net- work simulation with the traffic simulation. The efficacy of SimulatorBridger is validated using a case study for urban roads in Bologna city. Results show the various capabilities of SimulatorBridger in terms of vehicular network lifetime, vehicle battery, and energy consumption. According to our results, SimulatorBridger is also scalable in terms of vehicle count and simulation time. Notably, SimulatorBridger simulates VANET based on IoT infrastructure, a capability not present in existing VANET simulators, providing a more comprehensive and integrated approach to vehicular network simulation. Furthermore, our framework can be easily extended to support a load balancing scheme between traffic lights, thus minimising load imbalances in the communication network while improving energy management and implementation time. A cooperative approach for load balancing among the network might be used when the traffic light receives more requests than the maximum number, resulting in high traffic or load. Also, vehicular network lifetime is increased by reducing energy consumption which is necessary to balance energy in traffic lights. In addition, the simulator we propose combines IoTSim-OsmosisRES with any potential traffic simulator. Then for future work, a different traffic simulator can be used in conjunction with IoTSim-OsmosisRES. Fig. 9 suggests that the network infrastructure is severely affected by the communication delays by the way it processes and transmits the packets received from the IoT devices to the cloud. Our future work will identify the specific causes of the long shutdown times and alleviate any problems in the infrastructure to reduce the shutdown time of the simulation. For instance, we will try whether different packet routing policies or network configurations might help mitigate such problems. In conclusion, our study demonstrates the impact of communication dataflows on the battery consumption of IoT devices in vehicles, highlighting a significant correlation that is crucial for understanding overall energy efficiency in VANETs. The findings validate the effectiveness of SimulatorBridger in providing accurate simulations of VANET environments based on IoT infrastructure. Future research could explore traffic rerouting strategies based on battery optimization criteria, leveraging the capabilities of our proposed simulator.
Conflict of Interest The authors declare no conflict of interest.
- B. Boukenadil, “Importance of realistic mobility models for vanet network simulation”, arXiv preprint arXiv:1410.2450, 2014.
- J. Harri, F. Filali, C. Bonnet, “Mobility models for vehicular ad hoc networks: a survey and taxonomy”, IEEE Communications Surveys & Tutorials, vol. 11, no. 4, pp. 19–41, 2009, doi:10.1109/SURV.2009.090403.
- T. Szydlo, A. Szabala, N. Kordiumov, K. Siuzdak, L. Wolski, K. Al- wasel, F. Habeeb, R. Ranjan, “Iotsim-osmosis-res: Towards autonomic renewable energy-aware osmotic computing”, Software: Practice and Experience, vol. 52, no. 7, pp. 1698–1716, 2022, doi:10.1002/spe.3084.
- P. Á. López, M. Behrisch, L. Bieker-Walz, J. Erdmann, Y. Flötteröd,
R. Hilbrich, L. Lücken, J. Rummel, P. Wagner, E. WieBner, “Micro- scopic traffic simulation using SUMO”, “ITSC”, pp. 2575–2582, IEEE, 2018, doi:10.1109/ITSC.2018.8569938. - A. Dahlinger, B. Ryder, F. Wortmann, “Car as a sensor. paying people for providing their car data”, “Proceedings of the 5th International Conference on Internet of Things, Seoul, South Korea”, 2015, doi: 10.3929/ethz-b-000106154.
- R. A. Eaton, R. H. Joubert, E. A. Wright, “Pothole primer – a public administrator’s guide to understanding and managing the pothole problem”, Special Report Vol. 81–21, US Army Corps of Engineers – Cold Regions Research & Engineering Laboratory, 1989.
- M. H. Asad, S. Khaliq, M. H. Yousaf, M. O. Ullah, A. Ahmad, “Pot- hole detection using deep learning: A real-time and ai-on-the-edge perspective”, Advances in Civil Engineering, vol. 2022, p. 9221211, 2022, doi:10.1155/2022/9221211.
- M. Saleem, S. Abbas, T. M. Ghazal, M. Adnan Khan, N. Sa- hawneh, M. Ahmad, “Smart cities: Fusion-based intelligent traf- fic congestion control system for vehicular networks using ma- chine learning techniques”, Egyptian Informatics Journal, 2022, doi: 10.1016/j.eij.2022.03.003.
- N. Baranasuriya, V. Navda, V. N. Padmanabhan, S. Gilbert, “Qprobe: Locating the bottleneck in cellular communication”, “CoNEXT”, 2015, doi:10.1145/2716281.2836118.
- J. Kang, X. Chen, D. Wu, Y. T. Xu, X. Liu, G. Dudek, T. Lee, I. Park, “Hierarchical policy learning for hybrid communication load balanc- ing”, “ICC 2021 – IEEE Int. Conf. on Communications”, pp. 1–6, 2021, doi:10.1109/ICC42927.2021.9500379.
- M. Villari, M. Fazio, S. Dustdar, O. Rana, R. Ranjan, “Osmotic com- puting: A new paradigm for edge/cloud integration”, IEEE Cloud Computing, vol. 3, no. 06, pp. 76–83, 2016, doi:10.1109/MCC.2016.124.
- K. Alwasel, D. N. Jha, E. Hernandez, D. Puthal, M. Barika, B. Varghese, S. K. Garg, P. James, A. Zomaya, G. Morgan, et al., “Iotsim-sdwan: A simulation framework for interconnecting distributed datacen- ters over software-defined wide area network (sd-wan)”, Journal of Parallel and Distributed Computing, vol. 143, pp. 17–35, 2020, doi: 10.1016/j.jpdc.2020.04.006.
- S. Häger, S. Böcker, C. Wietfeld, “3d self-motion tracking services: Coalescence of mmWave beam orientations and phase information”, “2022 IEEE FNWF”, 2022, doi:10.1109/FNWF55208.2022.00009.
- L. Bieker, D. Krajzewicz, A. Morra, C. Michelacci, F. Cartolano, “Traf- fic simulation for all: a real world traffic scenario from the city of bologna”, “Modeling Mobility with Open Data: 2nd SUMO Confer- ence 2014 Berlin, Germany, May 15-16, 2014”, pp. 47–60, Springer, 2015, doi:10.1007/978-3-319-15024-6_4.