Improving Distribution Power System Efficiency using Power Loss Reduction by Installing the Distributed Generations
 , Muhammad Ahmed2, Arsalan Masood1, Muhammad Naqi Raza1 and Tariq Kamal3
(This article belongs to the Section Electrical Engineering (ELE))
Export Citations
Cite
Asghar, U. , Hassan, S. Z. , Ahmed, M. , Masood, A. , Raza, M. N. and Kamal, T. (2024). Improving Distribution Power System Efficiency using Power Loss Reduction by Installing the Distributed Generations. Journal of Engineering Research and Sciences, 3(9), 1–15. https://doi.org/10.55708/js0309001
Usman Asghar, Syed Zulqadar Hassan, Muhammad Ahmed, Arsalan Masood, Muhammad Naqi Raza and Tariq Kamal. "Improving Distribution Power System Efficiency using Power Loss Reduction by Installing the Distributed Generations." Journal of Engineering Research and Sciences 3, no. 9 (September 2024): 1–15. https://doi.org/10.55708/js0309001
U. Asghar, S.Z. Hassan, M. Ahmed, A. Masood, M.N. Raza and T. Kamal, "Improving Distribution Power System Efficiency using Power Loss Reduction by Installing the Distributed Generations," Journal of Engineering Research and Sciences, vol. 3, no. 9, pp. 1–15, Sep. 2024, doi: 10.55708/js0309001.
The current scenario of Pakistan's power sector stipulates the financial and technical viability of the utility companies to meet the escalating demands for electricity. Financial resources are required for the generation of electricity; which Pakistan cannot afford in the present situation. Pakistan have a huge potential for renewable energy resources; different areas across the country have a good irradiation value of solar energy. Through distributed generation arrangement, electricity can be generated near the consumer, e.g., a solar panel array or a small wind turbine, so that line losses of the distribution system decrease and voltage drop can be improved, and customers can also benefit through investing in DGs. This research aims at a comprehensive investigation of 07 High loss and tube well-dominated rural distribution feeders emanating from 132 KV Zafarwal Grid Station in Zafarwal, so that 1 MW Solar Distributed Generation study can be implemented for its impact on the high voltage Grid Station and optimization using the latest software tools like Arc GIS for geo database and GPS device for collection of real-time data from the field and Synergee Electric Software for load flow studies for PV and further optimization in the distribution network. The results of this research show that the optimal placement of solar PV on distribution lines introduces a power source near the load center, resulting in a reduction of voltage drop up to 3.5% and 35.21 % reduction in line losses. This decrease in voltage drop will lead to an improvement in power quality for users. It is recommended that before going to increase the level of distributed generation in the system a standard procedure should be developed, and it must be ensured that the inverter used by various consumers should not be allowed beyond a certain level of Harmonic contribution.
1. Introduction
The global energy demand is expected to evolve as countries try to lower-carbon energy sources to reduce greenhouse gas emissions and combat climate change [1–3]. In particular, the adoption of renewable energy sources is expected to increase in the coming decades as technology improves and costs continue to decline. According to the International Energy Agency, the top three sources of global electricity generation in 2020 were coal (27%). Natural gas (24%) and renewables (25%) include hydropower, wind, solar, and other sources. The remaining 24% of global electricity was generated from nuclear power, oil, and other sources [4].
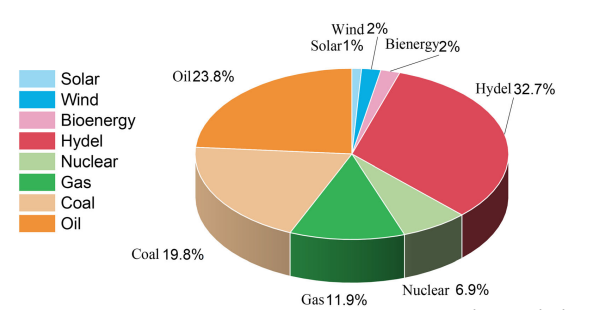
Energy is the lifeblood that drives households, companies, and industries in Pakistan, making it a vital component of the nation’s economy. This industry uses a wide variety of energy sources, such as nuclear power [5], hydroelectricity [6], renewable energy, and fossil fuels [7]. The capacity of production of electricity in Pakistan is shown in Figure 1. Historically, an extensive reliance on petroleum-based products such as oil and natural gas has resulted in issues such as shortages of energy and price instability. Still, the country is aggressively pursuing a more sustainable and equitable energy mix. Plans include the construction of hydroelectric plants to tap through the country’s tremendous potential, encouraging the use of renewable energy sources such as solar and wind energy, and the enforcement of laws that will encourage private investment.
An effective and robust energy sector is ensured by continuous efforts in policy formation, infrastructure development, and diversification, even in the face of obstacles such as circular debt and inefficient infrastructure. A strong energy industry has a profound socioeconomic impact that cannot be exaggerated, since it directly affects Pakistan’s population growth, economic well-being, and overall development trajectory [9]. Maintaining economic development requires a sustainable, diversified, and stable energy supply, which is why it is so important to prioritize it as the nation navigates its energy environment. The energy sector in Pakistan is diverse, with a mix of traditional fossil fuel sources such as coal, natural gas, and oil, as well as renewable energy sources such as hydropower, solar, and wind. Pakistan’s energy mix has historically relied heavily on fossil fuels, particularly natural gas and oil. However, the government has been working to increase the share of renewable energy in the energy mix, to generate 30% of the country’s electricity from renewable sources by 2030. In recent years, Pakistan has made significant progress in expanding its hydropower capacity and has also made significant investments in solar and wind energy [10], [11].
The country’s electricity sector is primarily managed and regulated by the National Electric Power Regulatory Authority (NEPRA). Pakistan has faced significant challenges in meeting the growing electricity demand, and the country has historically suffered from chronic power shortages and frequent power outages [12], [13]. In recent years, Pakistan’s government has implemented several initiatives to improve the reliability and sustainability of the power system, including investing in new power generation capacity, upgrading and expanding the transmission and distribution networks, and promoting the adoption of renewable energy sources. Despite these efforts, many people in Pakistan still lack access to reliable electricity, particularly in rural areas [14].
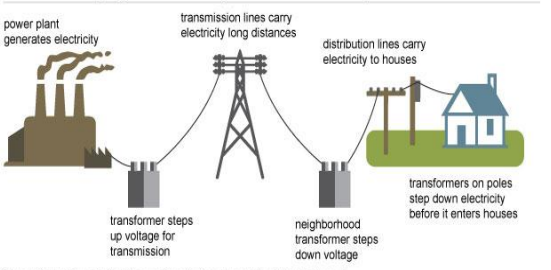
A power system is a network made up of essential parts that cooperate to generate, transmission, and redistribute electrical energy. Power plants use a variety of energy sources, including nuclear, renewable, and fossil fuels, to generate electricity. Energy losses are reduced by high-voltage lines and substations, which enable the efficient flow of electrical power across the system. The distribution component guarantees that power is delivered to end users, such as homeowners, businesses, and industrial consumers, by using transformer and lower-voltage wires. Protection mechanisms preserve the electrical network against faults, while control centers keep an eye on and oversee system operations, balancing supply and demand. The load is represented by consumers, who use electricity for a variety of purposes. Energy storage facilities and technologies for smart grids improve system efficiency, and grid interconnections increase reliability [15]. The distribution network is the part of the power system that delivers electricity from the transmission system to the end user. It is made up of lower-voltage lines and equipment that distribute electricity to customers over a smaller geographic area, typically a city or region [16].
The distribution network is typically owned and operated by a utility company, which is responsible for maintaining the network and ensuring that electricity is delivered to customers reliably and safely. GEPCO is responsible for operating and maintaining the distribution network in its service area, including the transmission and distribution lines, substations, and other electrical equipment that are used to deliver electricity to customers. GEPCO is also responsible for billing customers for the electricity that they consume and for providing customer service and support [17]. An overview of the main components and sections of power systems is shown in Figure 2 [18].
2. Methodology
2.1. Contributions
Net Metering is a significant shift towards renewable energy adoption in the Pakistan, but effective management still presents challenges. The research focuses on enhancing the performance of distribution network power systems by reducing power loss through Distributed Generation (DG). This approach optimizes energy distribution and contributes to sustainability by minimizing wastage.
Drawing from a case study of GEPCO, the study evaluated the feasibility and impact of DG installation on reducing power losses. The insights can be applied to all Distribution Companies (DISCOS) in the country, allowing for broader implementation and advancing energy sustainability goals.
2.2. Problem Statement
Our country is suffering from a lack of electricity. Approximately more than 60% of electricity is produced through thermal energy. Thermal power is not only expensive, but it also pollutes the environment. Most of the countries have shifted towards renewable resources. China had a total installed solar PV capacity of 131.1 GW, India 18.3 GW, UK 12.7 GW, France 8 GW, Australia 7.2 GW and Spain 5.6 GW, whereas Pakistan had an installed solar capacity of only 730 MW and Pakistan has a potential of 2.334 million MW of electricity per year through the photovoltaic and solar thermal system [6]. The other problem is that our installed systems are old and power losses in our transmission and distribution system result in decreased available electricity and an increase in voltage drop. According to the power division Ministry of Energy Report 2021-22, all the discos in Pakistan have 16.85% line losses [7].
The following research focuses on enhancing the efficiency of the GEPCO distribution system, which bears a significant amount of daily electric power loss without cause and a huge economic loss. Therefore, improving the electrical system’s efficiency through power loss reduction is necessary. Therefore, for a more efficient distribution system, it is required to upgrade the structure of the distribution transformer in such a way that it would offer minimum power losses, high reliability, and be environmentally friendly, having excellent performance in full load conditions.
2.3. Criteria for Selection of 11KV feeder for DG Placement
For the technical feasibility of 11 kV feeder lines, different criteria are considered for the selection of feeders for Solar PV initiative sizing of Solar PV and optimum location of Solar PV placement on selected feeders. Details of the criteria considered for this study are discussed below:
2.3.1. Distribution Line Losses
Lengthy and high line loss feeders are selected so that after the placement of DG, the distribution line losses will decrease. It is an important criterion for selection of feeders for 11 kV solarization.
2.3.2. Reduction in Voltage Drop
11kV distribution feeders having higher voltage drop are expected to be reduced from optimal placement of solar PV on 11kV feeders. This criterion is used for the selection of a feeder and optimal site for 11 kV solarization.
2.4. Feeder Categories
2.4.1. Residential Feeder
Residential feeders are in the load centres alongside the populated areas. These feeders are usually not very long but have higher loads.
2.4.2. Agricultural Feeder
Agricultural feeders are usually away from the populations. Lengths of these feeders are usually much longer as the feeding points are spread out in large areas.
2.4.3. Industrial Feeder
Industrial Feeders are usually dedicated feeders for one industry with a large load or an area with a group of small industries.
An agricultural Rural and Tube-well dominated feeder is selected for Solarization on account of the availability of open land in rural areas and lengthy feeders resulting in high line loss and low voltage profile.
2.5. Peak Loading of Feeder in winter
11 kV Solarization initiative is taken to promote decentralized and distributed solar generation requiring no reinforcement of the existing distribution network. The size of the proposed Solar PV is selected such that the power generated is utilized locally without flowing back toward the transmission/ distribution system. Therefore, peak winter load is used for the selection of feeders and sizing of Solar PV.
3. Zafarwal Grid Stations
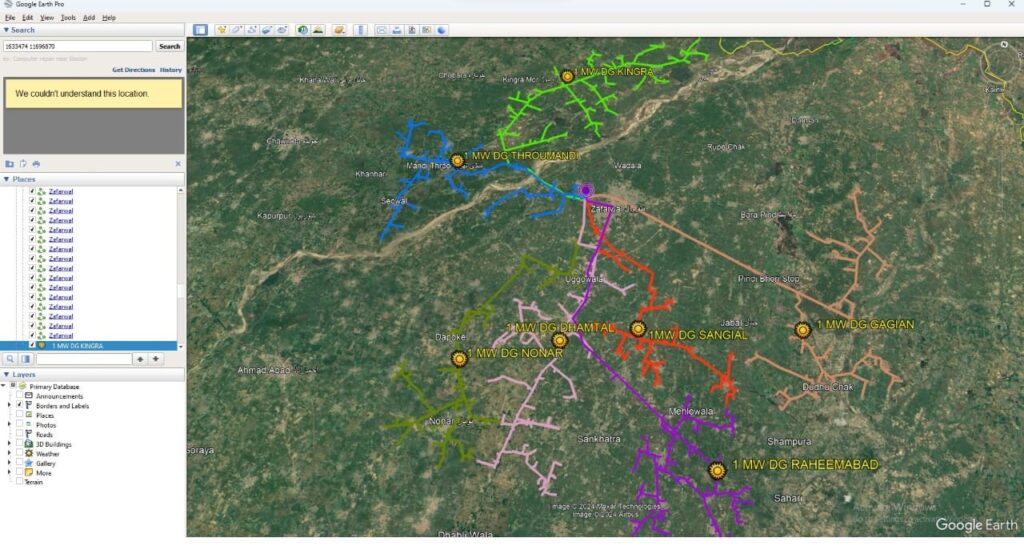
The main purpose of considering the above 100 A winter loading is that the power generated is utilized locally without flowing back toward the transmission/ distribution system. Therefore, peak winter load is used for the selection of feeders. These 11 kV feeders are emanating from 35 No. 132 kV G/Stations. To make this research work viable, 132 kV Zafarwal Grid station is selected as a case study whose 07 Number Feeders are suitable and fulfill the criteria for DG placements.
Table 1: Zafarwal Grid Station Feeders [19]
Month | 11KV Raheem Abad feeder | 11KV Nonar | 11KV Thoro Mandi | 11KV sangial | 11KV Dhamthal | 11KV Gagian | 11KV Kingra |
01/12/2022 | 100 | 100 | 110 | 105 | 115 | 110 | 120 |
01/11/2022 | 100 | 90 | 90 | 70 | 100 | 110 | 100 |
01/10/2022 | 160 | 140 | 180 | 140 | 200 | 180 | 190 |
01/09/2022 | 245 | 210 | 240 | 220 | 260 | 230 | 250 |
01/08/2022 | 220 | 225 | 270 | 230 | 160 | 245 | 290 |
01/07/2022 | 240 | 215 | 260 | 240 | 260 | 270 | 330 |
01/06/2022 | 230 | 245 | 305 | 340 | 390 | 330 | 290 |
01/05/2022 | 200 | 220 | 240 | 200 | 265 | 280 | 280 |
01/04/2022 | 180 | 230 | 230 | 190 | 250 | 280 | 290 |
01/03/2022 | 120 | 140 | 160 | 120 | 170 | 180 | 190 |
01/02/2022 | 70 | 90 | 90 | 70 | 100 | 100 | 100 |
01/01/2022 | 80 | 85 | 110 | 80 | 110 | 100 | 110 |
01/01/2022 | 80 | 85 | 110 | 80 | 110 | 100 | 110 |
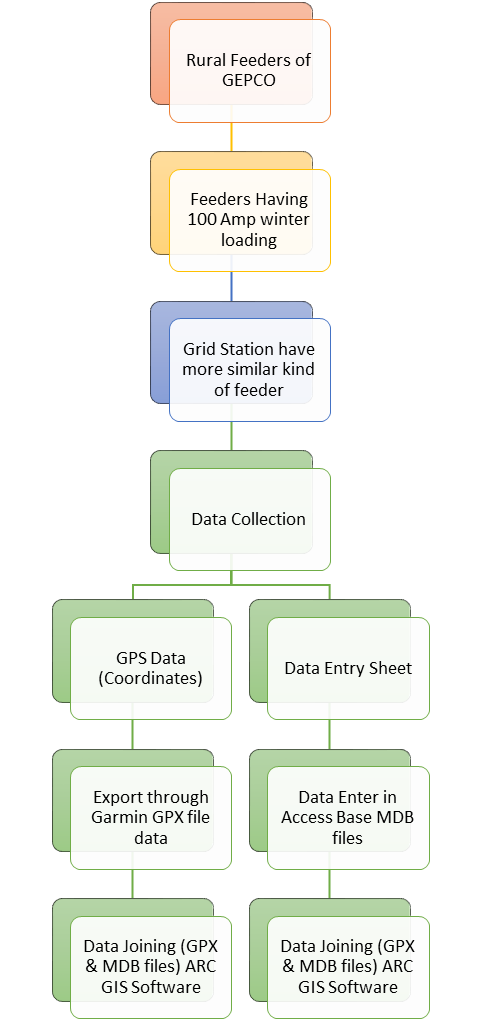
3.1. Data Collection
The required data carried out for the simulation has been collected from the 11-kV distribution network of GEPCO. The collected data is from 132 kV Zafarwal Grid station located in the vicinity of Narowal. The grid has been selected on the basis that it is a high loss and has a higher voltage drop, which is feeding to rural area tube well-dominated feeders. Most feeders are Agricultural. Data is collected through GPS device and Data sheet [20].
3.2. GPS Data (Coordinates)
GPS devices are used to take the waypoints of the poles. It captures signals from multiple satellites and uses the information to calculate the device’s latitude, longitude, altitude, and sometimes speed and direction.
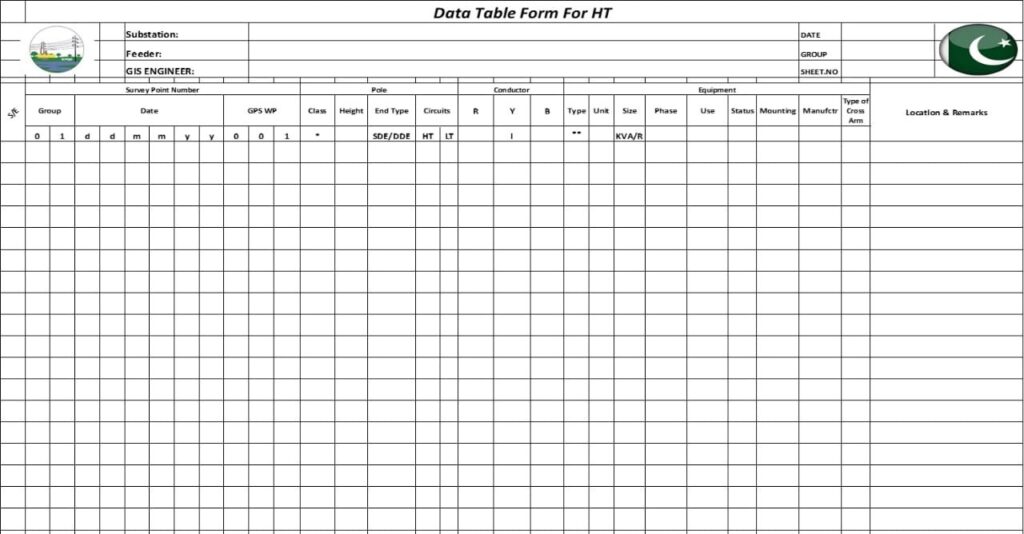
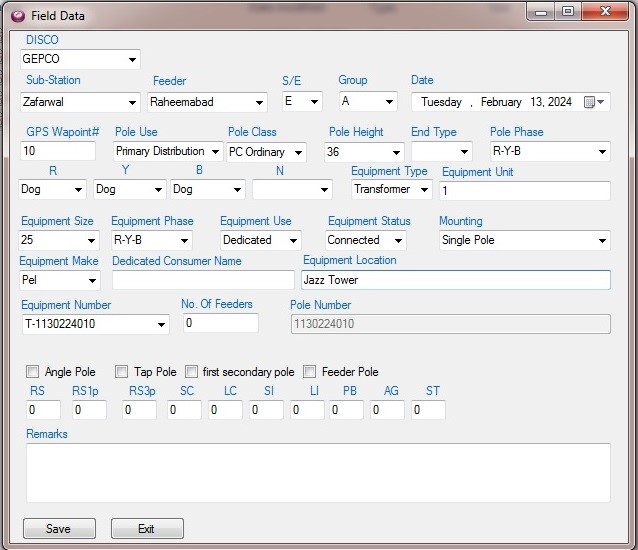
3.3. Data Entry Sheet
Details of waypoints/poles in entered on the Data entry sheet i.e. Date, group, waypoint number, pole height, conductor type, pole height, transformer detail, and number of circuits, etc. The Data entry sheet is shown in the figure 3.
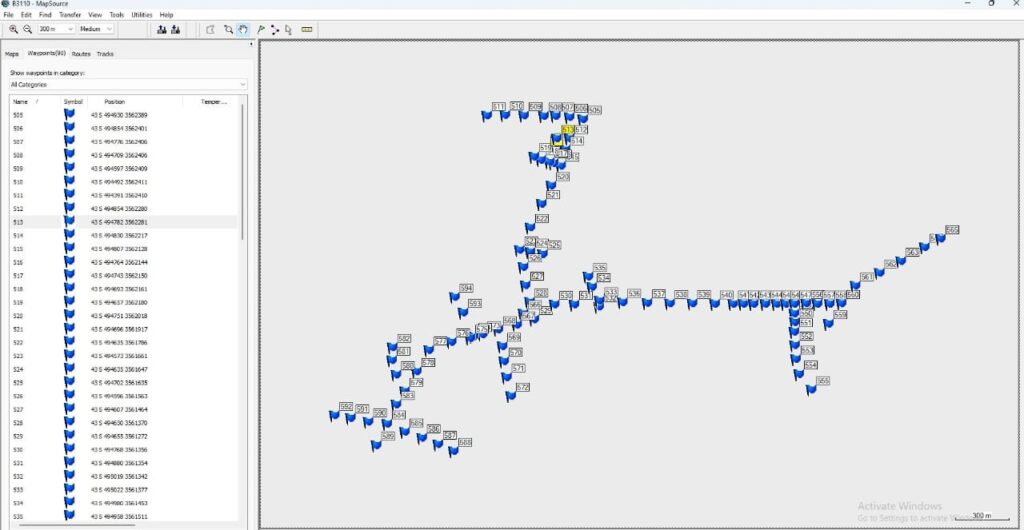
3.4. Export through Garmin GPX file data
GPS data is exported through map source software from the GPS device into a GPX file for data joining purposes through Arc GIS software. The figure 4 shows the waypoints on map source software.
3.5. Data Entry of Data sheet
Data is entered in Access Base MDB files through data entry operators as mentioned on the data entry sheet for joining purposes through Arc GIS software. The figure 5 shows the view of data entry software like feeder name, group, date, grid station transformer detail, etc.
3.6. ARC GIS Software, Data Joining (GPX & MDB files)
Updated and latest GIS mapping of 11 kV feeders is crucial for accurate analysis and design of Solarization. Therefore, GIS mapping is considered as an input file for Synergee Electric software to conduct load flow studies and selection of optimal locations for placement of Solar PV generation.
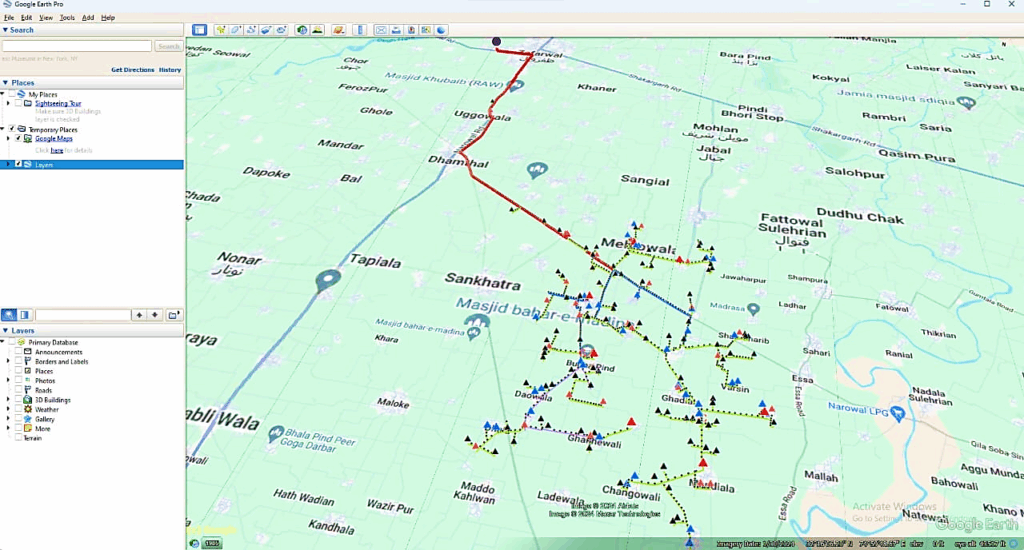
A geographic information system (GIS) is a system that creates, manages, analyzes, and maps all types of data. GIS connects data to a map, integrating location data (where things are) with all types of descriptive information (what things are like there) [21]. This provides a foundation for mapping and analysis that is used in science and almost every industry. GIS helps users understand patterns, relationships, and geographic context here we use GIS software for joining data both GPX data collected through a GPS device and MDB data collected through a data entry sheet [22]. The figure 6 and figure 7 shows the GIS map of the 11 kV Raheemabad feeder emanating from 132 kV Zafarwal G/Station. GIS software provides us with different output files here we take two types of files MDB & KML files.
3.7. MDB & KML files
Arc GIS provides us with input files for synergee electric software for load flow studies and further DG placement. KML files are used to view the selected 11KV feeders on Google Maps to check the availability of land.
The figure 6 shows the Google view using the KML file at Google map of the 11 kV Raheem Abad feeder emanating from 132 kV Zafarwal G/Station.
3.8. Availability of Open Land
Site verification of selected feeders will be carried out through a physical visit to the site to ensure the DG placement at selected 11 kV feeders of 132 kV Zafarwal G/Station and predicts that open land is available at the site. Further after collecting the coordinates physically sites were also verified.
3.9. Site Verification
Installation of solar panels requires a large area of flat and clean land for installation; therefore, availability of excess open land (greater than 2.5 Acres for each 1MW Solar Park) is ensured while selecting feeders and sizing of Solar PV. The figure 7 shows the Google view of the 11 kV Raheem Abad feeder and shows that open land is available at the site.
The Flow Chart diagram of our research work is shown in Figure 9. All the steps of flow charts are explained in detail.
4. Data Joining (GPX & MDB files) ARC GIS Software
4.1. Modelling of Data
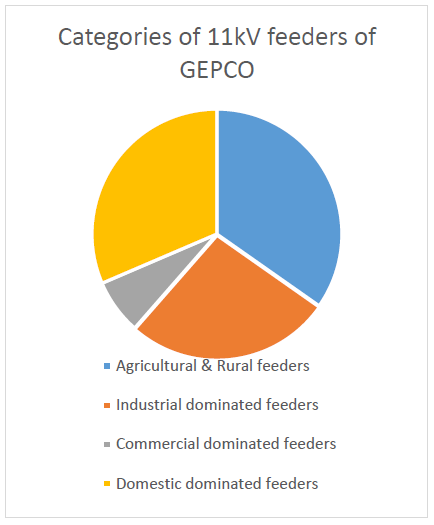
GEPCO has more than 60 no 132 kV Grid stations with 970 11 kV outgoing feeders. These feeders serve the public according to their requirements of load and area. There are four major categories of these feeders: Agricultural and rural feeders, Industrial dominated feeders, Commercial dominated feeders, and Domestic dominated feeders. Detail of these feeders is mentioned below mention Table 2.
SR. # | Description | Number of Feeders |
1 | Agricultural & Rural feeders | 337 |
2 | Industrial dominated feeders | 259 |
3 | Commercial dominated feeders | 69 |
4 | Domestic dominated feeders | 305 |
Total Number of 11kv Feeders | 970 | |
GEPCO has a total of 970 feeders, and the main categories are Domestic feeders 305, commercial feeders 69, Industrial feeders 259, and Agricultural and rural dominated 337. Feeders are shown in Figure 10. The agricultural & rural-dominated feeders are considered for research work because 2.5-acre land is required for 1MW for placement of the DGs. These agricultural rural feeders are very lengthy, and they have a high line loss and high voltage drop.
The scrutiny will be further narrowed by considering the winter (Dec-2022) peak loading above 100 Amp, which resulted in a list of 137 candidate feeders from 337 agricultural & rural-dominated feeders. DG placement initiative is taken to promote decentralized and distributed solar generation, requiring no reinforcement of the existing distribution network. The main purpose of considering the above 100 A winter loading is that the power generated is utilized locally without flowing back toward the transmission/ distribution system. Therefore, peak winter load is used for the selection of feeders. These 11 kV feeders are emanating from 35 No. 132 kV G/Stations. To make this research work viable, 132 kV Zafarwal Grid station is selected as a case study whose 07 Number Feeders are suitable and fulfill the criteria for DG placements.
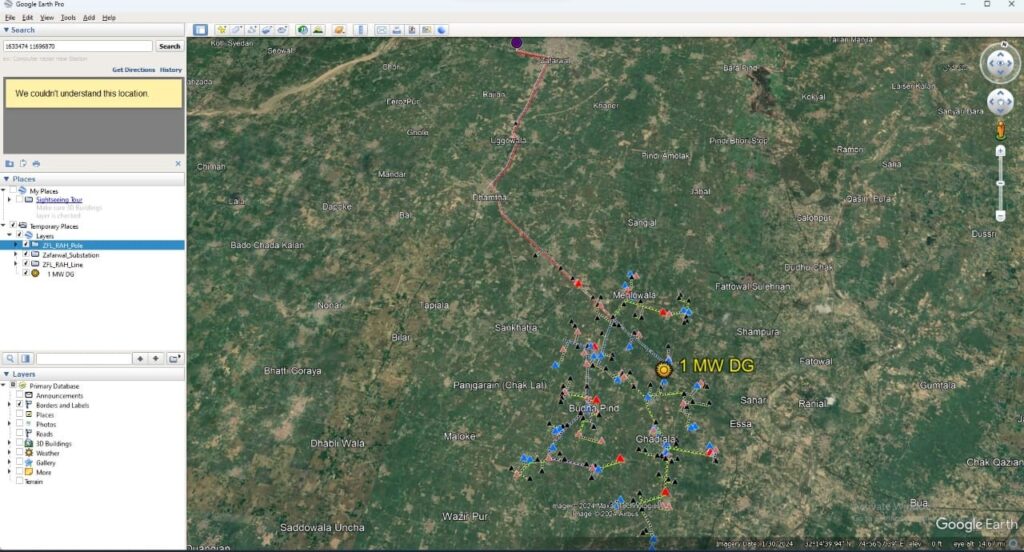
Figure 11 show the combined Loading detail for the year 2022 of 07 No. 11 kV feeders emanating from 132 kV Zafarwal G/Station) Maximum Summer loading in Amps and winter loading in December in Amps are shown. Real-time data is collected after a field survey of the selected feeders after a pole-to-pole survey through GPS devices and the waypoints of the poles with their details like height type and No of circuits on the poles.
After completion of the site survey and completion of data entry, the entered data detail is attached with waypoints through Arc GIS Software for a geographical database of the electric network. Arc GIS gives us two types of files one for Synergee Electric software that is known MDB file and other one is KMZ file which is used to view real time data at Google Earth [12].
4.2. Load Flow Analysis
Load flow studies by using MDB file of 11kV feeders under consideration is performed using “Synergee Electric” software of DNV GL based on GIS mapping, under following four scenarios as shown in figure 13.
The percentage voltage reduction is computed in Table 3 [23] and savings of electricity per KWh in Pakistani Rupees is computed in Table 4 [24].
4.3. Electricity Price
Every distribution feeder contains transformers of commercial and domestic categories therefore rates of electricity per unit would be different for both types. GEPCO determined the Tariff rate for FY 2022-23 mentioned in the table 5 average rate of the Domestic load unit is Rs.23 and for commercial load fixed unit rate is Rs.60 hence average electricity price for overall loads can be considered as Rs.41.5 and would be used in the economic loss calculations.
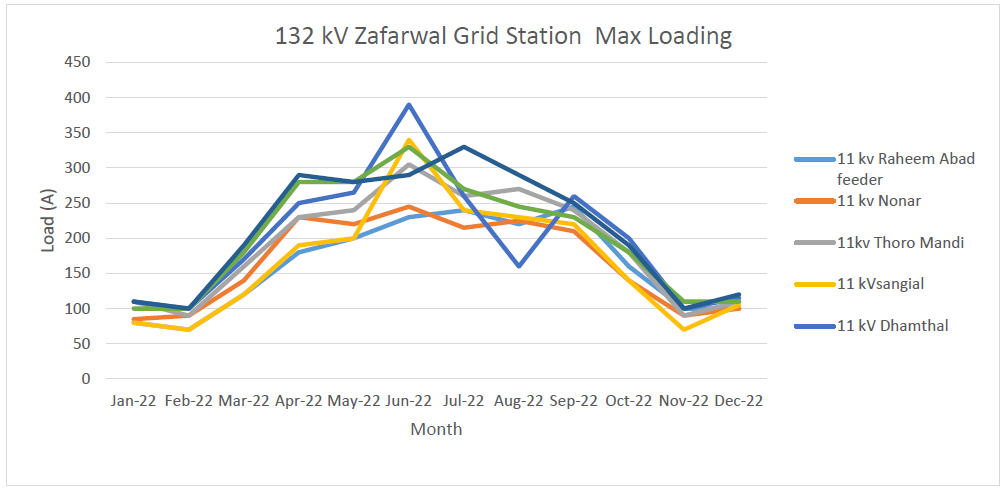
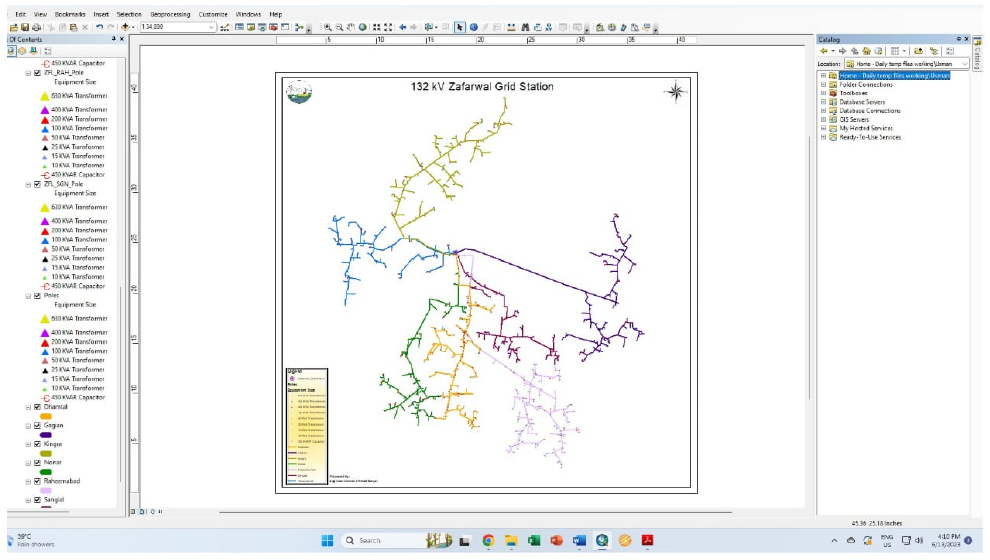
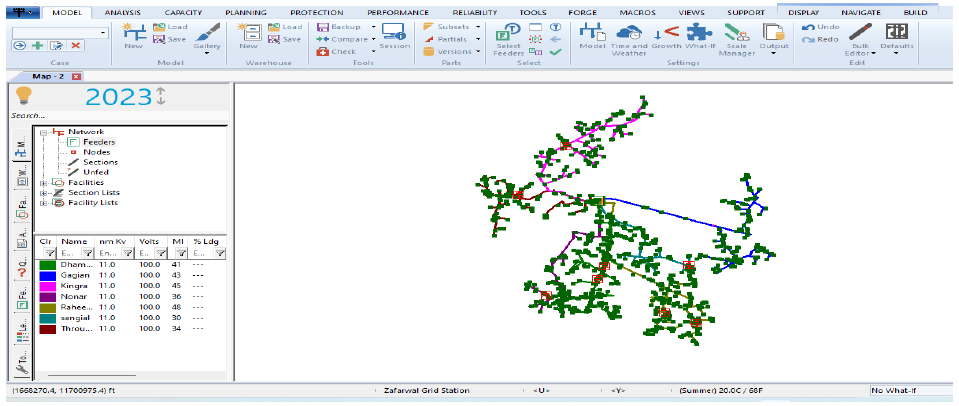
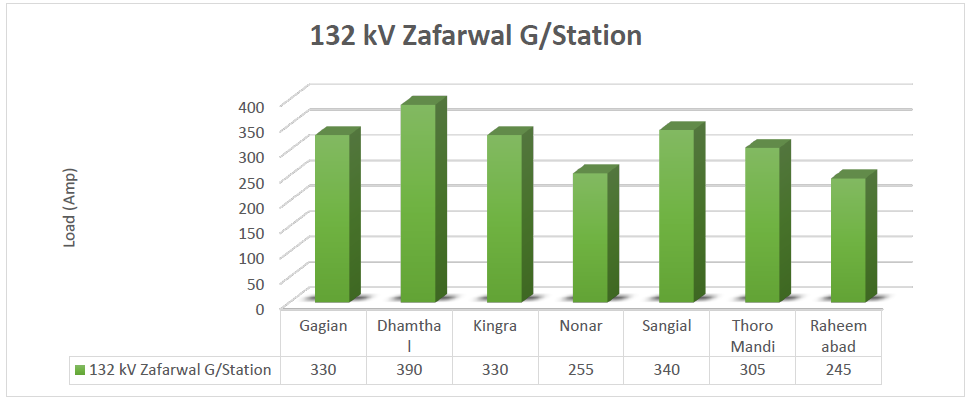
Table 3: Solar PV installations on Rural & Tube well Dominated Feeder emanating from 132 kV Zafarwal Grid Station.
Sr. No | Name of Grid Station | Feeder Name | HT Length | Maximum Load in amp | PV Size | Load flow analysis Winter without PV | Load flow analysis Winter with PV | Savings KW | % V.D Reduction | ||
(km) | (Winter) | (MW) | kW Loss | V.D (%) | kW Loss | V.D (%) | |||||
1 | 132KV Zafarwal | Throumandi | 55.02 | 110 | 1 | 64 | 6.2 | 17 | 3.61 | 47 | 3 |
2 | Nonar | 56.97 | 100 | 1 | 94 | 7.5 | 17 | 3.07 | 77 | 4 | |
3 | Dhamthal | 65.98 | 115 | 1 | 47 | 4.7 | 16 | 3.35 | 31 | 1 | |
4 | Kingra | 71.73 | 120 | 1 | 185 | 13.7 | 63 | 8.91 | 122 | 5 | |
5 | Singial | 47.52 | 105 | 1 | 76 | 10 | 29 | 4.46 | 47 | 6 | |
6 | Gagian | 69.71 | 110 | 1 | 96 | 7 | 45 | 5.35 | 51 | 2 | |
7 | Raheemabad | 76.18 | 100 | 1 | 112 | 9.2 | 33 | 4.74 | 79 | 4 | |
674 | 8.3 | 220 | 4.8 | 454 | 3.5 | ||||||
Table 4: DGs installations on Rural & Tube well Dominated Feeders emanating from 132 kV Zafarwal Grid Station.
Sr. No | Name of Grid Station | Feeder Name | HT Length (km) | PV Size (MW) (MW) | Load factor | Load flow analysis Summer without PV | Load flow analysis Summer with PV | Savings KW | Savings KW % | % V.D Reduction | Savings (kWh) | ||||
kW Loss | V.D (%) | Annual Loss ( kWh) | kW Loss | V.D (%) | Annual Loss ( kWh) | ||||||||||
1 | 132KV Zafarwal | Throumandi | 55.02 | 1 | 40 | 498 | 21.2 | 1012095 | 316 | 18.4 | 642213 | 182 | 36.55 | 2.83 | 369882 |
2 | Nonar | 56.97 | 1 | 40 | 604 | 24.2 | 1227521 | 334 | 19.5 | 678795 | 270 | 44.7 | 4.64 | 548726 | |
3 | Dhamthal | 65.98 | 1 | 40 | 528 | 18.8 | 1073065 | 384 | 17.8 | 780411 | 144 | 27.27 | 1.02 | 292654 | |
4 | Kingra | 71.73 | 1 | 40 | 1426 | 43.6 | 2898088 | 918 | 37.5 | 1865670 | 508 | 35.62 | 6.11 | 1032419 | |
5 | Singial | 47.52 | 1 | 40 | 906 | 29.1 | 1841282 | 568 | 25 | 1154358 | 338 | 37.31 | 4.11 | 686924 | |
6 | Gagian | 69.71 | 1 | 40 | 871 | 26 | 1770151 | 636 | 24.6 | 1292556 | 235 | 26.98 | 1.42 | 477595 | |
7 | Raheemabad | 76.18 | 1 | 40 | 662 | 33.1 | 1345396 | 404 | 28.5 | 821057 | 258 | 38.97 | 4.62 | 524339 | |
5495 | 28 | 11167598 | 3560 | 24.5 | 7235059 | 1935 | 35.21% | 3.50% | 3932539 | ||||||
Table 5: Average Rates of KWh Units for Domestic & Commercial consumers
S/No | Description | Price (Rs)/Kwh |
A | Average Domestic Tariff rate determined FY 2022-23 | 23.00 |
B | Fixed Commercial Tariff rate determined FY 2022-23 | 60.00 |
C | Average Rate for Domestic/ Commercial consumers= (A+B)/2 | (23+60)/2=41.5 |
4.4. Calculations of Economic Loss and Pay Back Time Period
For calculating the economic loss first, we need to calculate the KWH losses with & without DG (PV) installation. After calculating the power loss in KWH multiply it by unit price which gives the annual economic loss of the selected feeders.
For example, for selected feeder’s annually economic loss with & without DG (PV) placement can be calculated as
Annual Economic loss in Million for 07 feeders = (Annual Power loss for 07 feeders x Average unit Rate) / 1000000 | (1) |
Annual loss in Million for 137 feeders = (Annual Power loss for 07 feeders / 07 x 137 x Average unit Rate) / 1000000 | (2) |
Annual Power loss without DG (PV) placement.
Annual Power loss for 07 feeders without DG (PV) placement=11167598 KWh | (3) |
Annual Economic loss in Million for 07 feeders= (11167598 x 41.5) / 1000000=463.4 PKR | (4) |
Annual loss in Million for 137 feeders = ((11167598 /7 x 137) x 41.5) / 1000000)=9070.0 PKR | (5) |
Annual Power loss with DG (PV) placement.
Annual Power loss for 07 feeders with DG (PV) placement = 7235059 KWh | (6) |
Annual Economic loss in Million for 07 feeders = (7235059 x 41.5) / 1000000 = 300.25 PKR | (7) |
Annual loss in Million for 137 feeders = ((7235059 /7 x 137) x 41.5) / 1000000) = 5876.32 PKR | (8) |
Cost of DG (PV) including installation & operational charges.
Cost per watt including installation & operational charges = 90 PKR/watt | (9) |
Cost for 1 feeder 1 MW PV in Million = (90 x106) / 106 = 90 Million | (10) |
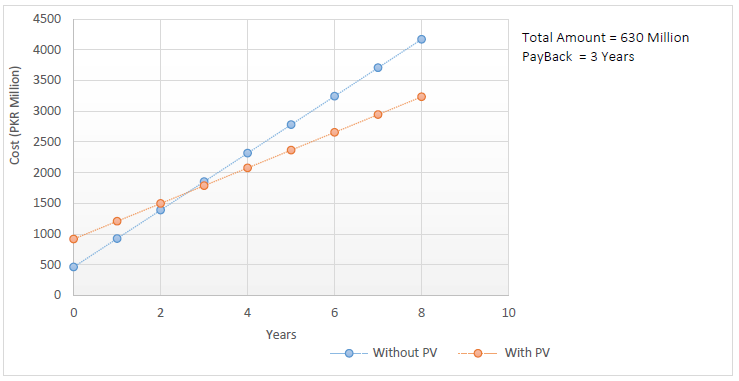
Cost for 7 feeders 7 MW PV in Million = 7 x (90 x106) / 106 = 630 Million | (11) |
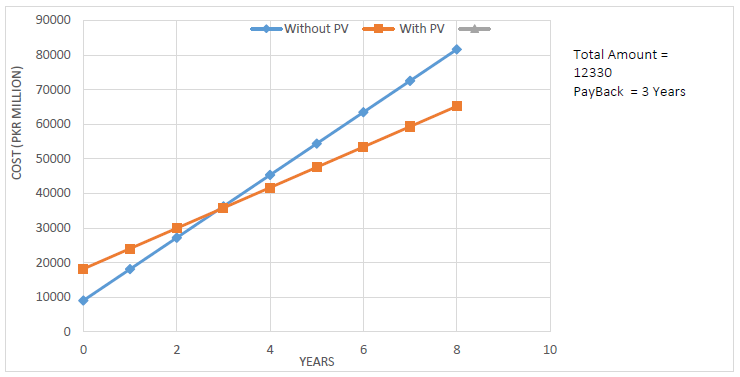
Cost for 137 MW PV in Million = 137 x (90 x106) / 106 = 12330 Million | (12) |
For finding the payback time of DG (PV) placement start with the initial price of DG (PV) placement and then add the cost of Annual Power loss of selected feeders. Repeat the process for both categories with & without DG (PV) placement and plotting the graph for a minimum 08 years will give the payback time of DG (PV) placement. Payback periods for selected feeders of GEPCO are given below
5. Conclusion
Currently, the power sector of Pakistan is facing the major challenge of controlling line losses and electricity theft, due to which load shedding is being applied on high-loss feeders. On the other hand, overall losses in power distribution systems are not only dropping the efficiency of the power system but also causing massive economic losses for the power distribution companies. According to the literature review, the power generation of Pakistan was 41557MW till 2022, of which 58% of power is generated from thermal resources as the cost of thermal generation is very high compared to other types of generations; therefore, for providing electricity to the consumers at affordable rates, Government of Pakistan has to bear the extra cost of thermal generation as compared to hydel & renewable generation. In such a situation, it is required to produce cheap electricity by installing new hydel & renewable energy projects; however, due to the present economic crisis in the country, it is difficult to attain the financial resources for hydel generation. Hence, the best strategy for the optimization of the power system is to encourage the public sector to invest and contribute to distribution loss reduction by installing DGs (Solar PV). Through their investment, they save the electric power losses and get financial benefits.
Installation of DGs (Solar PV) not only reduces the emission of greenhouse gases but also minimizes the losses of the distribution system by up to 35 % and improves the voltage drops also increases the quality of the distribution system through continuity of supply as compared to our conventional generation & distribution system.
Actual results presented in this research have shown that annual line losses of the GEPCO network for 07 feeders before DGs (Solar PV) are 11167598 KWh and voltage drops are 28.0%; after DGs (Solar PV), the losses are reduced to 7235059 KWh and voltage drops are 24.5 %. In short, 3932539 KWh units can be saved, and voltage drop can be reduced up to 3.5%. If we take the average unit rate as PKR 40.00/KWh, then we can save 157.3 Million PKR/Anum for these 07 No feeders if GEPCO implements this and if we enhance our research area till the other rural 137 feeders mentioned earlier in Chapter 04, then 3078.62 Million PKR can be saved through the installation of DGs (Solar PV) in our distribution system.
In light of the results obtained from the loss analysis and economic analysis, it is recommended that GEPCO and all the distribution companies in Pakistan should place the DGs (Solar PV) in their distribution system to achieve the goal of a highly efficient energy system in the country.
Acknowledgement
I would like to express sincere gratitude to my parent department GEPCO and faculty of Electrical department under University of Sialkot for their guidance, motivations, ideas, and immense knowledge during the research process. They are always very helping in solving my reservations/ confusions and guided me to the completion of this study. On top of that, they are tolerant and progressive persons. This thesis could not be completed, without their continuous guidance, encouragement and support.
- M. C. V Suresh, J. B. Edward, “A hybrid algorithm based optimal placement of DG units for loss reduction in the distribution system”, Applied Soft Computing, vol. 91, 106191–106191, 2020, doi:https://doi.org/10.1016/j.asoc.2020.106191.
- R.-E. Precup, T. Kamal, S. Z. Hassan, Solar Photovoltaic Power Plants, Springer Singapore, 2019.
- R.-E. Precup, T. Kamal, S. Z. Hassan, Advanced Control and Optimization Paradigms for Wind Energy Systems, Springer Singapore, 2019.
- J. L. Holechek et al., “A Global Assessment: Can Renewable Energy Replace Fossil Fuels by 2050?”, Sustainability (Switzerland), vol. 14, no. 8, 1–22, 2022, doi:10.3390/su14084792.
- Q. Wang, R. Li, G. He, “Research status of nuclear power: A review”, Renewable and Sustainable Energy Reviews, vol. 90, no. February, pp. 90–96, 2018, doi:10.1016/j.rser.2018.03.044.
- W. Wan et al., “Analyzing the Impact of Streamflow Drought on Hydroelectricity Production: A Global-Scale Study”, Water Resources Research, vol. 57, no. 4, 2021, doi:10.1029/2020WR028087.
- H. Hou et al., “Exploring the Role of Fossil Fuels and Renewable Energy in Determining Environmental Sustainability: Evidence from OECD Countries”, Sustainability (Switzerland), vol. 15, no. 3, 2023, doi:10.3390/su15032048.
- N. Abas et al., “Techno-Economic Feasibility Analysis of 100 MW Solar Photovoltaic Power Plant in Pakistan”, Technology and Economics of Smart Grids and Sustainable Energy, vol. 7, no. 1, 2022, doi:10.1007/s40866-022-00139-w.
- B. Sultana et al., “Review on reliability improvement and power loss reduction in distribution system via network reconfiguration”, Renewable & Sustainable Energy Reviews, vol. 66, pp. 297–310, 2016, doi:https://doi.org/10.1016/j.rser.2016.08.011.
- Z. Nishtar, J. Afzal, “History of Emerging Trends of Renewable Energy for Sustainable Development in Pakistan.”
- G. M. Mufti et al., “Comparative analysis of the effects of renewable energy integration on the utility grid system”, 2018 International Conference on Computing, Mathematics and Engineering Technologies (iCoMET), 1–5, 2018, doi:10.1109/ICOMET.2018.8346415.
- P. R. Satpathy, R. Sharma, “Power loss reduction in partially shaded PV arrays by a static SDP technique”, Energy, vol. 156, 569–585, 2018, doi:https://doi.org/10.1016/j.energy.2018.05.131.
- G. M. Mufti et al., “Evaluating the Issues and Challenges in Context of the Energy Crisis of Pakistan”, Indian Journal of Science and Technology, vol. 9, no. 36, 1–7, 2016, doi:10.17485/ijst/2016/v9i36/102146.
- M. Arif et al., “Solar-Biogas Microgrid: A Strategy for Development of Rural Communities in Pakistan”, SSRN Electronic Journal, 2022, doi:10.2139/ssrn.4039931.
- S. Giannelos et al., “Modelling Smart Grid Technologies in Optimisation Problems for Electricity Grids”, Energies, vol. 16, no. 13, 2023, doi:10.3390/en16135088.
- M. Farrokhabadi et al., “Microgrid Stability Definitions, Analysis, and Examples”, IEEE Transactions on Power Systems, vol. 35, no. 1, 13–29, 2020, doi:10.1109/TPWRS.2019.2925703.
- N. Hatziargyriou et al., “Definition and Classification of Power System Stability – Revisited & Extended”, IEEE Transactions on Power Systems, vol. 36, no. 4, 3271–3281, 2021, doi:10.1109/TPWRS.2020.3041774.
- U. Shahzad, “A Review of Challenges for Security – Constrained Transmission Expansion Planning”, Journal of Electrical Engineering, Electronics, Control and Computer Science, vol. 7, no. 24, pp. 21–30, 2021.
- R. S. Rao et al., “Power Loss Minimization in Distribution System Using Network Reconfiguration in the Presence of Distributed Generation”, IEEE Transactions on Power Systems, vol. 28, no. 1, 317–325, 2013, doi:https://doi.org/10.1109/tpwrs.2012.2197227.
- K. Mahmoud, N. Yorino, A. Ahmed, “Optimal Distributed Generation Allocation in Distribution Systems for Loss Minimization”, IEEE Transactions on Power Systems, vol. 31, no. 2, 960–969, 2016, doi:https://doi.org/10.1109/tpwrs.2015.2418333.
- B. Ismail et al., “A Comprehensive Review on Optimal Location and Sizing of Reactive Power Compensation Using Hybrid-Based Approaches for Power Loss Reduction, Voltage Stability Improvement, Voltage Profile Enhancement and Loadability Enhancement”, IEEE Access, vol. 8, pp. 222733–222765, 2020, doi:https://doi.org/10.1109/access.2020.3043297.
- A. A. A. El-Ela et al., “Optimal capacitor placement in distribution systems for power loss reduction and voltage profile improvement”, Iet Generation Transmission & Distribution, vol. 10, no. 5, 1209–1221, 2016, doi:https://doi.org/10.1049/iet-gtd.2015.0799.
- A. Ehsan, Q. Yang, “Optimal integration and planning of renewable distributed generation in the power distribution networks: A review of analytical techniques”, Applied Energy, vol. 210, 44–59, 2018, doi:https://doi.org/10.1016/j.apenergy.2017.10.106.
- A. Bayat, A. Bagheri, R. Noroozian, “Optimal siting and sizing of distributed generation accompanied by reconfiguration of distribution networks for maximum loss reduction by using a new UVDA-based heuristic method”, International Journal of Electrical Power & Energy Systems, vol. 77, 360–371, 2016, doi:https://doi.org/10.1016/j.ijepes.2015.11.039.
No related articles were found.