Comparing the Performance of Recycled Calcined Bauxite vs. Locally Available Aggregate as Components in High Friction Surface Treatment Applications

(This article belongs to the Section Civil Engineering (CVE))
Export Citations
Cite
Deef-Allah, E. , Broaddus, K. and Abdelrahman, M. (2024). Comparing the Performance of Recycled Calcined Bauxite vs. Locally Available Aggregate as Components in High Friction Surface Treatment Applications. Journal of Engineering Research and Sciences, 3(11), 41–59. https://doi.org/10.55708/js0311004
Eslam Deef-Allah, Korrenn Broaddus and Magdy Abdelrahman. "Comparing the Performance of Recycled Calcined Bauxite vs. Locally Available Aggregate as Components in High Friction Surface Treatment Applications." Journal of Engineering Research and Sciences 3, no. 11 (November 2024): 41–59. https://doi.org/10.55708/js0311004
E. Deef-Allah, K. Broaddus and M. Abdelrahman, "Comparing the Performance of Recycled Calcined Bauxite vs. Locally Available Aggregate as Components in High Friction Surface Treatment Applications," Journal of Engineering Research and Sciences, vol. 3, no. 11, pp. 41–59, Nov. 2024, doi: 10.55708/js0311004.
For safe driving, the proper level of pavement friction must be maintained. The capacity of a pavement surface to offer friction to vehicles during cornering maneuvers or crucial braking is improved by high friction surface treatment. Calcined Bauxite is the most often utilized high friction aggregate. Calcined Bauxite, a byproduct, was the priciest aggregate relative to other locally accessible aggregates due to its restricted availability. Bauxite is one source of aggregate that when recycled (processed) has high friction properties. The researchers therefore assessed the frictional performance of Calcined Bauxite compared to five alternatives: Meramec River Aggregate, Rhyolite, Earthworks, and two byproducts (Flint Chat and Steel Slag). These alternatives were collected because they were locally available and less expensive when compared to Calcined Bauxite. The dynamic friction, the British pendulum, and the aggregate image measurement system were among the performance tests. The impact of aggregate sizes (#4 – #6 and #6 – #8) on British pendulum number (BPN) values was examined for Calcined Bauxite and three alternatives (Meramec River Aggregate, Rhyolite, and Steel Slag). Aggregates of larger size exhibited higher BPNs than smaller-size aggregates with differences in values ranging from 0.8 to 7. The correlation between the coefficients of friction measured by the dynamic friction tester and the number of polishing cycles was examined, and it revealed an exponential relationship. Alternatives to Calcined Bauxite can be screened using percentages of texture and angularity indices changes following Micro-Deval abrasion. Meramec River Aggregate, Flint Chat, and Steel Slag were effectively recommended alternatives for Calcined Bauxite.
1. Introduction
Friction, also known as skid resistance, refers to the force generated when a vehicle’s tire slides down a paved surface without spinning [1]. Friction between pavement and vehicle’s tires can shorten braking distance and reduce vehicle-related collisions, particularly during wet weather [2,3]. The complicated phenomena of friction on a roadway are influenced by a variety of elements, including the environment, traffic, and materials. Different macro- and micro-textures are produced by material characteristics (such as aggregate size and shape), which contribute to variations in friction. It has been demonstrated that at low speeds, good pavement micro-texture is critical for friction, whereas, at high speeds, good pavement macro-texture is more significant [2,4]. When pavement surfaces lose their friction, surface treatments are introduced as a cure to increase friction and prolong pavement life [5]. One of these surface treatments is known as high friction surface treatment (HFST), which is widely utilized in the United States [5,6].
High friction surface treatment was introduced as a remedy for locations with friction deficits, inadequacies of horizontal curves with tiny radii, and modest superelevation rates [5,6], or places where relocating immovable objects to expand visibility is difficult [5,7]. It was found that HFST is a safety application comprised of a resin layer that bonds the pavement with a 3 to 4 mm high-angularity, high-abrasion, high-texture, and polish-resistant aggregates (such as Calcined Bauxite, Slags, Flint/Chert, or Granite) [5,6,8–12]. Calcined Bauxite is one of the high-friction aggregates that is frequently utilized in the HFST.
Calcined Bauxite is currently the predominant aggregate utilized in Missouri for HFST applications. Bauxite is mined largely for its aluminum content. The ore is refined using the Bayer process, in which it is treated with sodium hydroxide at high temperatures and pressure to produce alumina (aluminum oxide). After alumina extraction, the alumina is calcined to form aluminum metal. This is accomplished by heating alumina in rotary kilns or fluidized bed calciners to temperatures of 1000–1500 degrees Celsius. During this process, some of the alumina may be transformed into Calcined Bauxite. In this situation, whereas alumina is the primary product of Bauxite processing, Calcined Bauxite is considered a byproduct of alumina calcination. With over 3.7 billion tons of Bauxite reserves, China is a major producer [13]. The top producers of Calcined Bauxite are China, Australia, Guinea, Jamaica, Brazil, and India [6,14]. As of 2023, China is the world’s third-largest producer of Bauxite, accounting for over 22% of global production. Calcined Bauxite typically has a bulk density of around 3 gm/cm3, an alkali content of less than 0.4%, and an alumina content of more than 82% [5,14,15]. This type of aggregate is stable, dense, and very pure, making it suitable for a variety of applications such as abrasives, anti-skid protections, and surface treatments [5,6].
The Missouri Department of Transportation (MoDOT) has been using HFST since 2013 to enhance wet crash locations and to increase friction on the pavement where traffic has worn down surface particles [16]. When analyzing the performance of HFST application, the main objective is frictional performance, which is determined by the aggregates’ micro-textures and the surfaces’ macro-textures [8,17]. Aggregate micro-texture is influenced by its shape (texture and angularity), whereas aggregate macro-texture is determined by its gradation, compaction degree, and mixture design [17–21]. To determine the aggregates’ shape (angularity and texture) both after and before abrasion in the Micro-Deval device, Texas A&M University created the aggregate image measurement system (AIMS) [17,22–24]. The two-dimensional form of the aggregates is used to establish their shape, the wavelet analysis method is used to analyze grayscale images to determine the surface texture, and the irregularity of a particle’s surface is used to estimate the angularity of the aggregate [17]. The British pendulum assesses the aggregates’ resistance to polishing after and before a 10-hour polishing session using the British accelerated polishing equipment named the British wheel. The British pendulum F-scale is used for the 1.25-inch-wide slider, whereas the main (primary) scale is utilized for the 3-inch-wide slider, which is utilized for flat surfaces [25]. Furthermore, a dynamic friction tester (DFT) is used to investigate the friction of aggregates after and before polishing with a three-wheel polishing device (TWPD) [26].
Using the Micro-Deval test, the abrasion resistances of Steel Slag and Calcined Bauxite with a 9.5-mm nominal maximum aggregate size were assessed [25]. Compared to the percentage of mass losses for Calcined Bauxite, the mass loss percentage for Steel Slag was 17% greater. Additionally, they investigated the polish value of Steel Slag and Calcined Bauxite, with aggregate sizes of 1–3 mm and 6.3–9.5 mm, both after and before polishing. The initial polish value and 10-hour polish value values rose with decreasing aggregate size. The finding was explained by the researchers due to the preparation process: As opposed to the 6.3–9.5 mm aggregate size, the smaller aggregate size (1–3 mm) was too small to be put individually in a single layer. As a result, there was more variation between the 1–3 mm samples. Additionally, the polish values for Steel Slag were lower than those for Calcined Bauxite. The researchers [25] did advise using Steel Slag as an aggregate substitute for Calcined Bauxite, though. Other researchers [26] compared seven friction aggregates with Calcined Bauxite and examined how well they performed in terms of friction. Based on the DFT results, none of the seven frictional aggregates had friction similar to that of Calcined Bauxite. The researchers determined that friction aggregates exhibited comparable friction losses in cycles ranging from 70k to 140k. Furthermore, a circular texture meter (CTM) was used to assess the impact of aggregate size—Calcined Bauxite, Slag, Flint, and Taconite—on the frictional performance. According to this study [26], the surface texture was reduced when the aggregate’s particle size was reduced. For example, when the particle size was changed from #6 to #16, the CTM macro-texture diminished from 2.3 mm to 1 mm.
In the U.S.A., the principal aggregate for HFST is Calcined Bauxite. While Calcined Bauxite has significance in many applications due to its unique qualities, it confronts several concerns that may jeopardize its market viability and development prospects in the future. Concerns about the continuous use of Calcined Bauxite include availability and cost, which are greatly affected by the worldwide distribution of raw Bauxite supplies, as well as environmental regulations. Calcined Bauxite’s cost issues originate from its energy-intensive production process, expensive capital expenditures for production facilities, supply chain vulnerabilities due to raw material sourcing, importing expenses, and rising environmental compliance costs. Stringent environmental rules in China, a major producer of Bauxite, have forced manufacturing facilities and mines to close temporarily. The shutdown of facilities owing to environmental compliance diminishes current supply while also creating uncertainty about future availability. These regulatory acts can cause major variations in market supply and costs of Calcined Bauxite.
Calcine Bauxite has been the sole source of aggregate used in HFST, but it is expensive and is imported. Thus, assessing the frictional performance of alternatives to Calcined Bauxite was one of the primary goals of this study. Extensive comparative frictional investigations between alternatives with different sizes and Calcined Bauxite were lacking. Consequently, this study investigated how aggregate size affects the frictional performance of high-friction aggregates. Another major objective was to strengthen the principle of sustainability by including recycled aggregates in the selected alternatives.
2. Materials and Methods
2.1. Materials
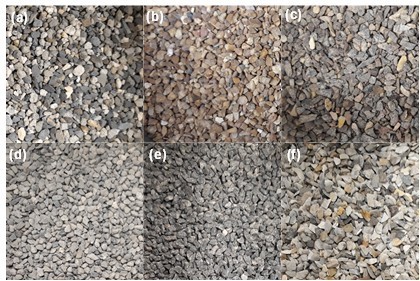
Five alternatives and Calcined Bauxite were chosen for evaluation. These aggregates were chosen as potential replacements for Calcined Bauxite, and they were available locally. Meramec River Aggregate, Rhyolite, Steel Slag, Earthworks, and Flint Chat were the alternatives (note Figure 1). The NJSP-15-13B HFST requirements set out by the MoDOT and anticipated modifications to the HFST standard were assessed for each of these aggregates through testing.
Bauxite is mined because it is usually always found on the surface of the ground. Bauxite is one type of aggregate that, when recycled or processed, has high friction properties. Calcined Bauxite is created by sintering high-alumina Bauxite at high temperatures (Great Lakes Minerals, LLC, Wurtland, Kentucky, U.S.A.). Calcined Bauxite is a recycled material derived from naturally occurring Bauxite ore, and it makes use of previously mined materials that were overlooked during earlier processing stages. The average aluminum oxide percentage for Calcined Bauxite was 87.5%, somewhat higher than the 87% minimum specified in most HFST requirements. It included 88.65% aluminum oxide. China is the world’s top producer of Calcined Bauxite, leveraging its vast reserves of Bauxite ore, notably those containing the Diaspore mineral.
Natural Calcined Bauxite, known as Earthworks, was blasted, mined, and crushed at Earth Work Solutions Quarry (Gillette, Wyoming, U.S.A.). The rock formation is layered. Meramec River Aggregate is coarse manufactured sand obtained from Winter Brothers Material Company (Saint Louis, Missouri, U.S.A.). The material is a thousand-years-old sand and gravel deposit in the Meramec basin. The layers of material include overburden (topsoil), gravel, often a thin coating of sticky mud, and sand at the bottom. Fred Weber Inc. acquired Iron Mountain Trap Rock, also known as Rhyolite, an igneous, volcanic rock (Lead Belt region of Missouri, Ironton, U.S.A.). It was produced during significant volcanic activity in Missouri. The Lead Belt region is noted for iron ore, lead smelting and manufacturing, granite, and trap rock.
Flint Chat and Steel Slag were chosen as byproducts. Flint is a sedimentary rock made up of microscopic quartz crystals (silica or SiO2). It is frequently discovered as a byproduct in the dumps of abandoned lead and zinc mines (Williams Diversified Materials, Baxter Springs, Kansas, U.S.A.). It can be considered recycled material. As mining develops, undesired byproducts and remaining minerals are usually placed in dumps or tailings. Tailings are waste materials that remain after valuable minerals have been extracted from ore. In many cases, these tailings contain considerable amounts of Flint that were not originally intended for extraction but are still there owing to a geological relationship with other mined minerals. These Flint accumulations in tailings or landfills have the potential to be recycled material over time. Furthermore, there is now more interest in recycling minerals from mining activities due to environmental concerns. Reusing accumulated Flint and repurposing tailings are two ways that businesses may reduce its environmental impact and support sustainable mining methods. Steel Slag is a byproduct of the steelmaking process that occurs when impurities in molten iron are removed during the manufacturing of steel. The business operations of Harsco Inc. (Muscatine, Iowa, U.S.A.) provide an example of how businesses may use byproducts like Steel Slag to satisfy market demands while reducing waste and making a positive impact on environmental sustainability.
FasTrac CE330 epoxy binder, an A and B two-component epoxy polymer binder with low modulus, was investigated to be used in this study. The two components are an epoxy (hardener) and a resin (extender). The epoxy binder exhibited a 40% tensile elongation and a bond strength of 2 ksi after two days and 2.8 ksi after fourteen days. Loose dense-graded asphalt mixtures, with a 12.5-mm nominal maximum aggregate size, were supplied by an asphalt plant (Pullman, WA, U.S.A.) to create asphalt slabs (20 20 2 inches). The epoxy binder was utilized for HFSTs on hot mix asphalt (HMA) slabs, accelerated friction testing, and coupon preparation for the British pendulum test.
2.2. Methods
2.2.1. AIMS
Following the Micro-Deval test (105-minute and 180-minute abrasion periods) on aggregate size 3/8ʺ – #4, the aggregate samples were examined in the AIMS alongside samples before abrasion (ASTM D6928 – 17 [27]). AIMS was used to investigate two sizes, following the HFST specifications, of aggregate: 3/8ʺ – 1/4ʺ and 1/4ʺ – #4. The AIMS analysis was performed to investigate the changes in aggregate shape (angularity and texture indices) following Micro-Deval abrasion. Black and white images were used to identify the angularity indices based on particle surface irregularities, while grayscale images were analyzed using the wavelet analysis approach to find the surface texture indices [17].
2.2.2. Accelerated Friction Testing
To compare the surface frictional properties of alternate aggregates to Calcined Bauxite, accelerated friction testing was carried out. The sand patch test for mean texture depth (MTD) measurement and a DFT for coefficient of friction (COF) measurement were accelerated friction testing techniques.
I. Applying HFST on Hot Mix Asphalt Slabs
The plant mixes were warmed, and a small plate compactor was utilized in the laboratory to create and compact the HMA slabs (20 × 20 × 2 inches). The HMA slabs were coated with an A and B two-part epoxy binder before the application of size #6 – #8 aggregates. Selected aggregate size is following the HFST specifications. According to the supplier’s specifications, the epoxy’s part A to part B weight ratio was 1:18 to 1.00.
II. Sand Patch Test: A Volumetric Approach to Assessing Pavement Macro-texture
The sand patch test was used to determine the MTD values of the manufactured test slabs following ASTM E965 – 15(2019) [28]. The average MTD for each surface was computed using Equation 1. The average of two replicates—two test slabs—was the basis for the results.
$$MTD = \frac{4V}{\pi D^2}\tag{1}$$
where,
D is the sand patch circle’s average diameter (mm), V is the volume of sand (mm3), and MTD is the mean texture depth (mm).
III. Dynamic Friction Test
The test slabs were polished with a TWPD to resemble the polishing of aggregates used in HFST under field traffic conditions. The TWPD included three turntable-mounted pneumatic rubber wheels as well as a water spray system that mimicked wet conditions to lessen rubber wheel wear and remove surface fines to enable extra polishing. The overall weight of the wheel, involving the metal plates (six in total) and the wheel cluster, was 149 lbs. The COF was tested by the researchers at three distinct polishing cycle numbers: 0 cycles (initial), 70k cycles, and 140k cycles (terminal). Following ASTM E1911-19, the COF was evaluated by a DFT at various speeds (20, 40, and 60 km/hr) [29]. Three rubber pads were fastened to a circular disk that made up the DFT. The circular disk revolved at speeds of up to 100 km/hr. Once the disk had attained the desired speed, it was dropped to the paved surface, and the COF was determined as the speed of the circular disk as it steadily reduced. The friction was tested under wet circumstances. The average of two duplicates—two test slabs—was the basis for the results.
2.2.3. Assessing the Surface Friction of Aggregate Coupons with the British Pendulum
I. Creating Aggregate Coupons
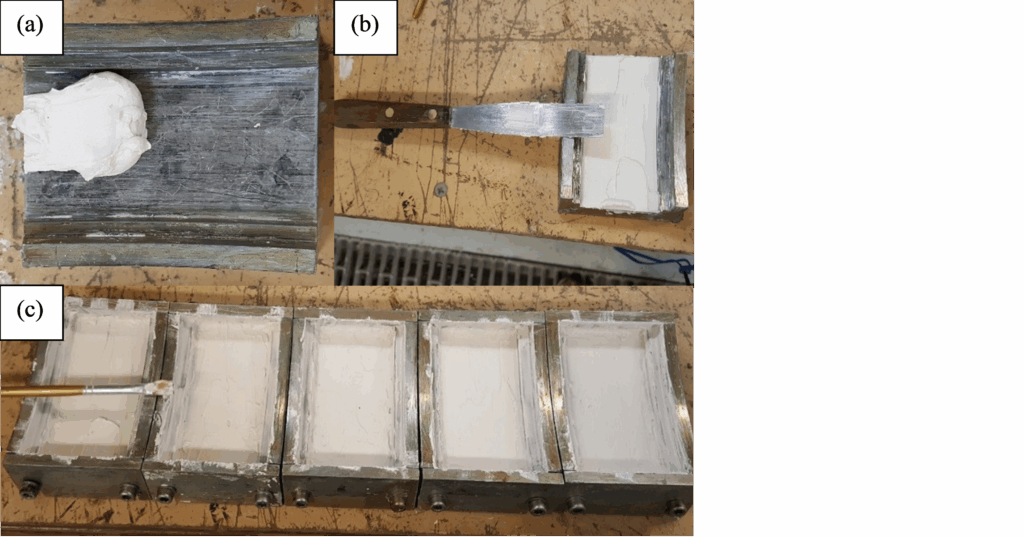
The metal mold’s bottom (Figures 2-a and 2-b) was covered with a 12g ready-mix plaster, on which the aggregates were inserted. After experimenting with various ready-mix plaster weights, it was discovered that a weight of 12g prevented the epoxy binder from leaking into the gaps between the aggregate particles for both the #4 – #6 and #6 – #8 sizes. Selected aggregate sizes are following the HFST specifications. To prevent the epoxy from sticking to the metal molds, more plaster was applied entirely to the sides of the molds using a tiny brush (see Figure 2-c). A single layer of aggregates was carefully applied to the plaster.
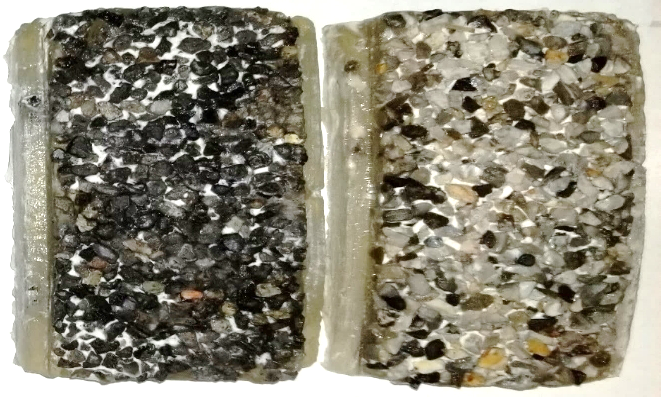
An epoxy binder consisting of two parts, A and B, was produced. The weight ratio of epoxy part A to part B was 1:18 to 1.00. To fill the remaining space in the metal mold, the aggregates were covered with the prepared epoxy binder. For four to six hours, the aggregate coupons were kept in the metal molds at room temperature. Ultimately, the plaster coating was removed from the aggregate coupons by taking them out of the metal molds and giving them a water wash. Samples of prepared aggregate coupons are shown in Figure 3. The created coupons were first examined for their British pendulum number (BPN), and then after ten hours of polishing in the British wheel, they were again tested for their BPN.
II. British Pendulum Test
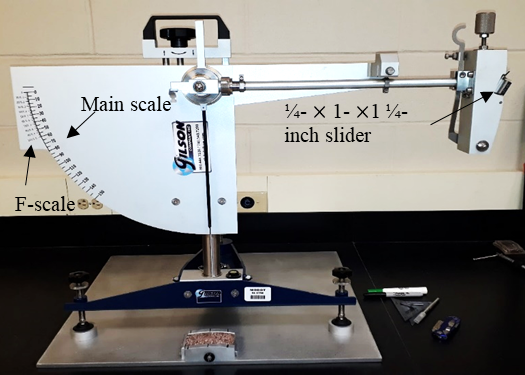
The test’s objective was to use the British pendulum to quantify the surfaces’ frictional characteristics. The AASHTO T 278-90 (2017) [30] was followed in the preparation of the tester shown in Figure 4 with slide length adjustments (Section 7.3) and zero adjustments (Section 7.2). A slider measuring 1/4 inch by 1 inch by 1 1/4 inches was employed. The test employed two aggregate sizes. The first size was #6 – #8, while the second was #4 – #6. Two aggregate coupons were created for each aggregate size. Each aggregate coupon’s BPN was measured five times on the F-scale (note Figure 4), and the average BPN before polishing was computed. Following that, the British wheel (Figure 5-a) was used to polish the aggregates on the coupons for ten hours, and the BPN values were recorded five times before being averaged to determine the BPN after polishing.
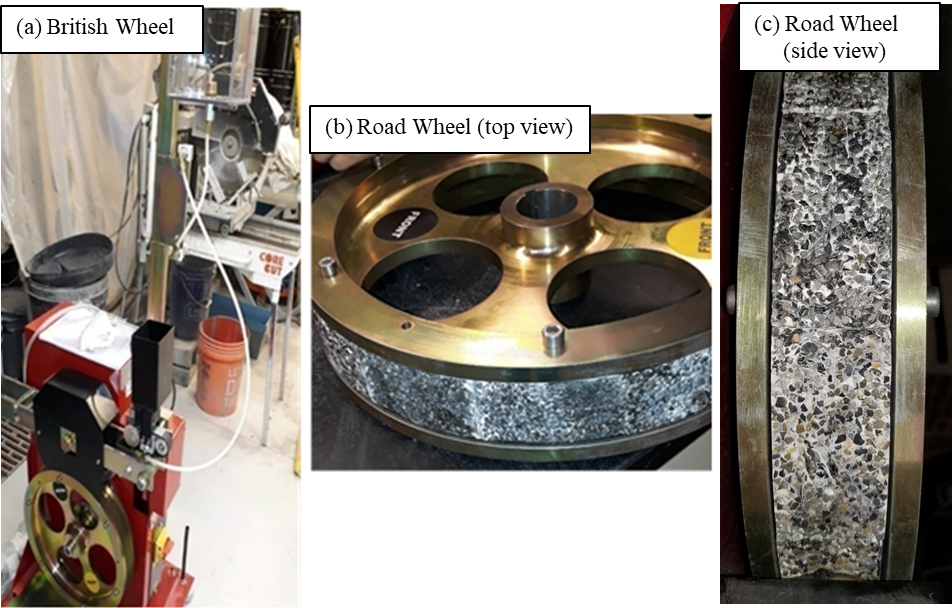
III. Polishing Aggregates Using the British Wheel
The coupons’ aggregates were polished after being tested in the British pendulum per AASHTO T 279-18 [31] using the British wheel, note Figure 5-a. The test imitated the polishing operation that occurs on aggregates in the field. For every run, 14 aggregate coupons were secured around the road wheel’s periphery (Figures 5-b and 5-c). The road wheel speed was adjusted to 320 ± 5 rpm. With a total load of 391.44 ± 4.45 N, the pneumatic-tired wheel was lowered to bear on the aggregate coupons’ surface. For ten hours, the aggregates were polished in the presence of water and #150 silicon carbide grit (as a polishing agent).
3. Results and Discussion
3.1. AIMS
This section compares the AIMS angularity and texture indices for aggregates before Micro-Deval abrasion (BMD), after Micro-Deval abrasion time of 105 minutes (AMD 105), and after Micro-Deval abrasion time of 180 minutes (AMD 180). There were two aggregate sizes examined: 3/8ʺ – 1/4ʺ and 1/4ʺ – #4.
3.1.1. Aggregate Size’s Impact on Angularity and Texture Indices
Figure 6 displays the AIMS angularity and texture indices for two sizes of aggregates: 3/8ʺ – 1/4ʺ and 1/4ʺ – #4—for BMD and AMD (105 or 180). The texture and angularity indices for BMD and AMD (105 or 180) were lowered by reducing the aggregates’ sizes from 3/8ʺ – 1/4ʺ to 1/4ʺ – #4. Nonetheless, when the aggregate size was reduced from 3/8ʺ – 1/4ʺ to 1/4ʺ – #4, Steel Slag provided greater texture indices for BMD. This was attributed to the greater surface area and irregularities associated with smaller-sized aggregates. Furthermore, when aggregate sizes decreased from 3/8ʺ – 1/4ʺ to 1/4ʺ – #4, Earthworks and Flint Chat demonstrated increases in angularity indices concerning BMD. When the size of the aggregate was reduced, Calcined Bauxite showed an increase in the angularity indices for AMD (105 or 180). To clarify the influence of aggregate size on texture indices, the indices were averaged for each size using the results of BMD, AMD 105, and AMD 180. A similar procedure was followed for the angularity indices. The percentages of decrease in these indices were computed when the
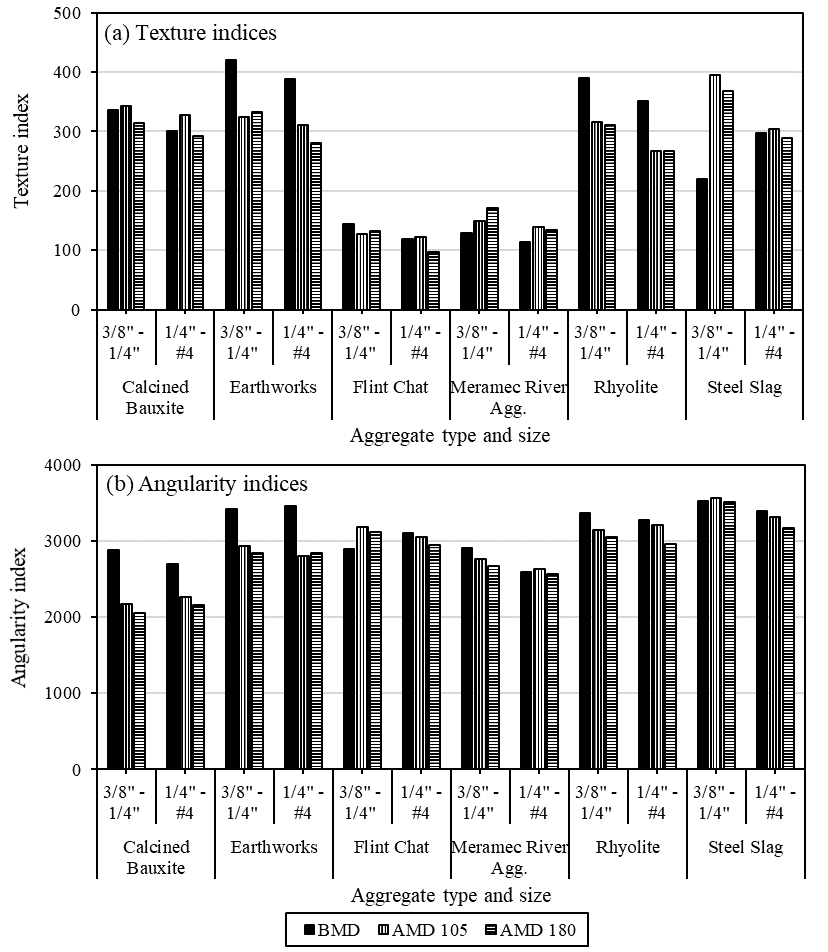
aggregate size decreased from 3/8ʺ – 1/4ʺ to 1/4ʺ – #4. Reducing aggregate size lowered texture indices by −7.3% to −16.5% and angularity indices by −1% to −6.9%. Increasing the Micro-Deval abrasion time from 105 to 180 minutes reduced the angularity indices in 100% of the samples and decreased the texture indices in 75%. The polishing mechanism caused by Micro-Deval decreased sharp edges and smoothed surfaces, lowering the texture and angularity indices [23,24,32].
The percentages of change in the angularity and texture indices of AIMS for aggregates for AMD (105 or 180) are depicted in Figure 7. Figure 7-a demonstrates that for three different types of aggregates—Earthworks with two sizes, Flint Chat with 3/8ʺ – 1/4ʺ size, and Rhyolite with two sizes—the texture indices dropped while employing AMD. The percentages of decrease in texture indices AMD for these aggregates reached values lower than −18%. This was ascribed to mechanical abrasion leading to smoother surfaces and particle breaking down resulting in less textured surfaces [12]. Using AMD 105 for Calcined Bauxite, 1/4ʺ – #4 size Flint Chat, and Steel Slag led to higher texture indices. The percentage of increase in texture indices AMD 105 for these aggregates attained values ranging from 2% to 79%. AMD experienced higher texture indices for Meramec River Aggregate and 3/8ʺ – 1/4ʺ Steel Slag. The percentage of increase in texture indices AMD for these aggregates reached levels ranging from 15% to 79%. The angularity indices decreased with AMD for six different types of aggregates, as shown in Figure 7-b: Two sizes of (Calcined Bauxite, Earthworks, and Rhyolite),1/4ʺ – #4 size (Flint Chat and Steel Slag), and 3/8ʺ – 1/4ʺ size of Meramec River Aggregate. The percentages of decreases in angularity
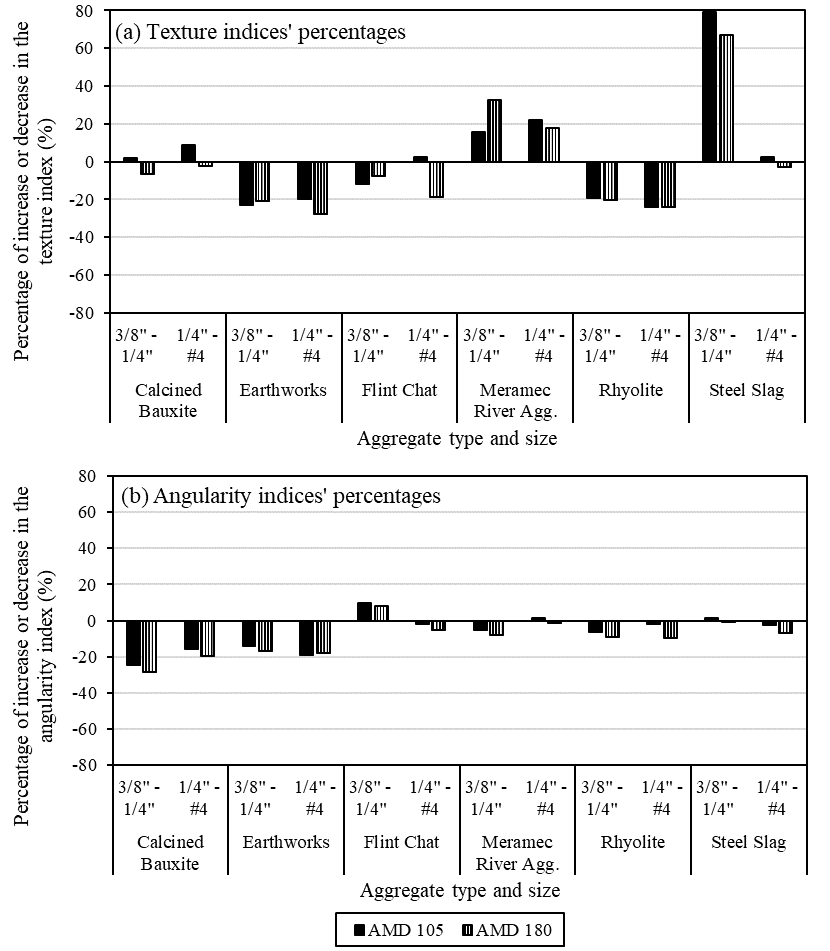
indices AMD for these aggregates ranged from −1.8% to −28.5%. On the other hand, the angularity indices rose with AMD 105 for the 3/8ʺ – 1/4ʺ Steel Slag and the 1/4ʺ – #4 Meramec River Aggregate. The percentage of increase in angularity indices AMD 105 for these aggregates exceeded 1.2%. Furthermore, the angularity indices for the 3/8ʺ – 1/4ʺ Flint Chat increased for AMD (105 or 180). T he percentage of increase in angularity indices AMD for this size of Flint Chat surpassed 8%. Following Micro-Deval abrasion time, the aggregates’ texture and angularity indices rose, most likely for one or more of the reasons listed below [12, 22, 24, 32]:
- Particles were broken rather than abraded (e.g., Steel Slag and Calcined Bauxite), revealing interior surface textures;
- Micro-Deval abrasion unveiled additional rough areas that were previously hidden by smoother surfaces (e.g., Steel Slag and Meramec River Aggregate);
- Mineralogies in particular aggregates (e.g., Meramec River Aggregate) revealed new textured surfaces during Micro-Deval abrasion.
3.1.2. Analyzing Average Angularity and Average Texture Indices
AIMS indices were calculated as an average for two aggregate sizes (3/8ʺ – 1/4ʺ and 1/4ʺ – #4). Figure 8 illustrates the average angularity and average texture indices for BMD and AMD (105 or 180). During BMD abrasion, Earthworks had the greatest average angularity index (3437.3) and average texture index (404.6), whereas Meramec River Aggregate had the lowest average indices (2749.6 for angularity and 121.4 for texture). The greatest average angularity and average texture indices among AMD (105 or 180) were found in Steel Slag (3440 for angularity AMD 105, 3344.3 for angularity AMD 180, 349.4 for texture AMD 105, and 327.9 for texture AMD 180). For AMD (105 or 180), Calcined Bauxite displayed the lowest average angularity indices (2221.4 for AMD 105 and 2109.6 for AMD 180), whereas Flint Chat exhibited the lowest average texture indices (124.3 for AMD 105 and 114.7 for AMD 180). When AMD 105 was utilized for Meramec River Aggregate, average texture indices rose (from 121.4 for BMD to 144.1 for AMD 105); when AMD 180 was employed, this rise persisted reaching a value of 152.5. This occurred because the aggregates possessed mineralogies using Micro-Deval abrasion that revealed new textured surfaces and/or the Micro-Deval abrasion revealed a more textured area that had been concealed by a smoother surface. The average texture indices of both Steel Slag and Calcined Bauxite rose with AMD 105 and dropped with AMD 180. During AMD 105, particles were broken rather than abraded, exposing their interior surface textures. On the other hand, AMD 180 underwent abrasion on both the old and new exposed internal surface textures. The average texture indices for Rhyolite, Earthworks, and Flint Chat declined with AMD (105 and 180). Aggregates’ average angularity indices declined and reached their lowest value with AMD 180.
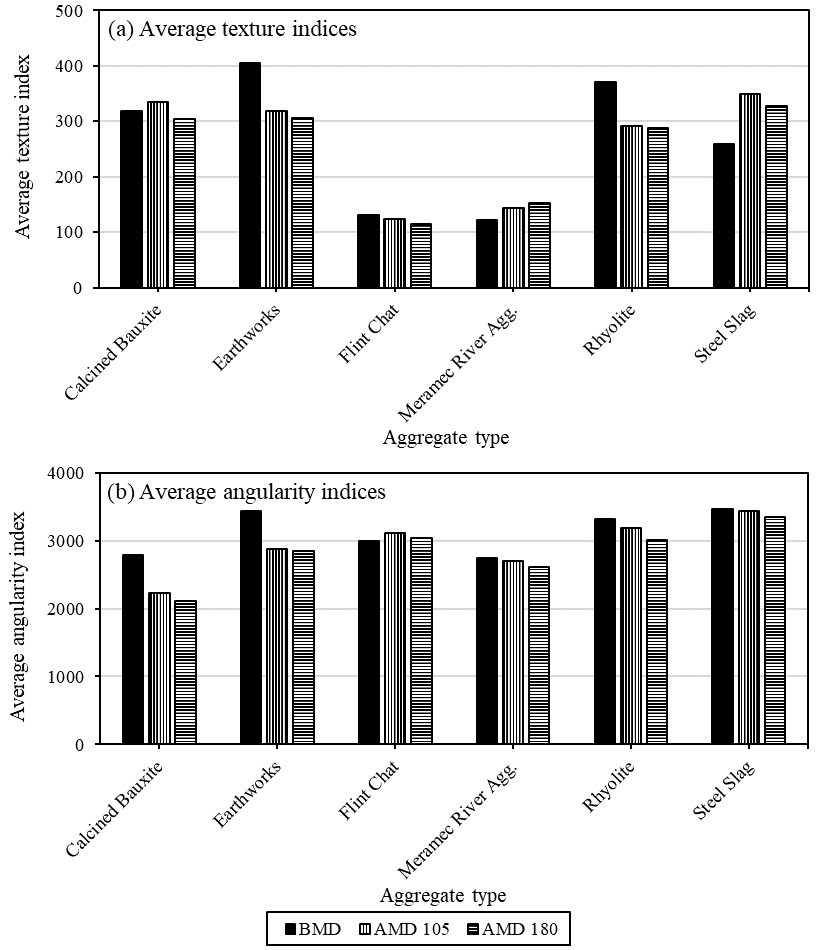
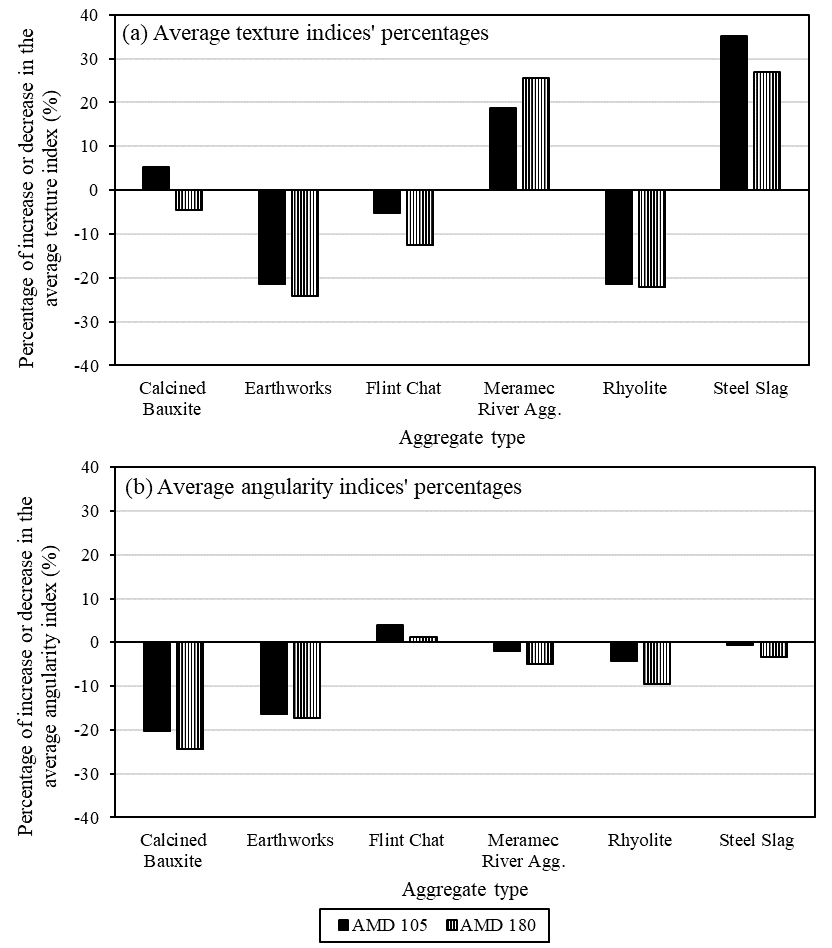
Figure 9 shows the percentages of decrease or increase in the average texture and average angularity indices. Figure 9-a indicates that Calcined Bauxite’s average texture indices percentage for AMD 180 dropped the least (−4.7%). The highest percentages of average texture indices increase for AMD (105 and 180) were seen in Steel Slag reaching values of 35.1% and 26.8%, respectively. In contrast, the average texture indices for AMD (105 or 180) decreased the most for Earthworks aggregate (−21.4% for AMD 105 and −24.2% for AMD 180). Except for Flint Chat, all aggregates showed a reduction in the average angularity indexes among AMD (105 or 180) (see Figure 9-b). Calcined Bauxite had the highest decrease percentages in average angularity indices (−20.4% for AMD 105 and −24.4% for AMD 180), as shown in Figure 9-b. Steel Slag, however, showed the lowest decrease in average angularity indices (−0.7% for AMD 105 and −3.4% for AMD 180).
3.2. Accelerated Friction Testing
3.2.1. Sand Patch Test
The MTD results for the HFSTs employing aggregates before polishing are shown in Figure 10. The MTD was the two replicates’ average, with four measurements collected on each test surface. All test surfaces had measured MTDs between 2.19 and 2.69 mm. The results revealed that the MTDs of Calcined Bauxite and Rhyolite surfaces were 2.19 mm and 2.33 mm, respectively, lower than those of Flint Chat (2.69 mm) and Steel Slag (2.64 mm). MTD values were higher for the other surfaces (e.g., Earthworks and Meramec River Aggregate) than for Calcined Bauxite and Rhyolite. The MTD values of Steel Slag and Flint Chat
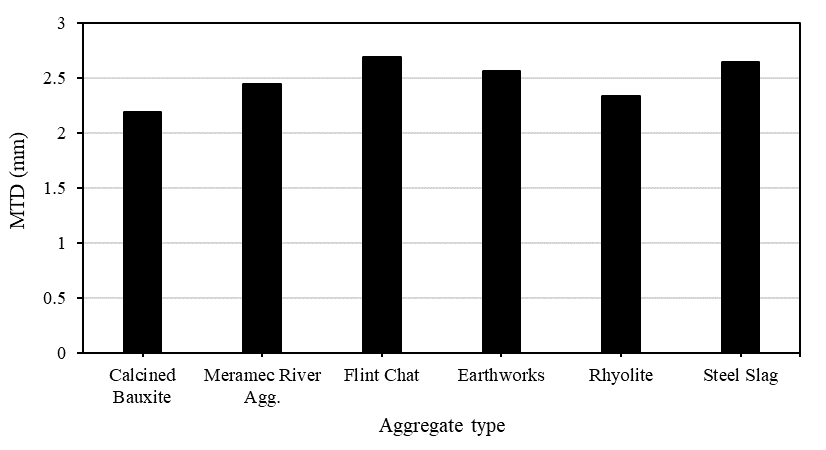
were greater than those of Earthworks and Meramec River Aggregate. Aggregate surface characteristics, such as aggregate angularity, led to different MTD values being noted.
3.2.2. Dynamic Friction Test
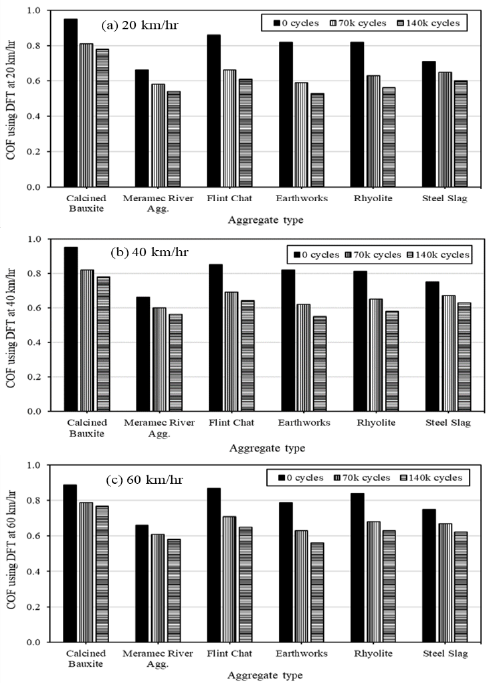
The average of two replicates was used to represent the COF values in this section. For each condition, polishing speed and cycle, a single friction measurement obtained using DFT was recorded. The average COF values for the two repetitions at 20, 40, and 60 km/hr, as determined by the DFT, are displayed in Figure 11. As predicted, the data revealed that the COF dropped with polishing. At corresponding DFT speeds and polishing cycles, Calcined Bauxite exhibited greater COF values (initial and terminal) in comparison to the remaining alternative aggregates. The Meramec River Aggregate exhibited the lowest initial friction among all aggregates, and its terminal friction was equivalent to that of Earthworks.
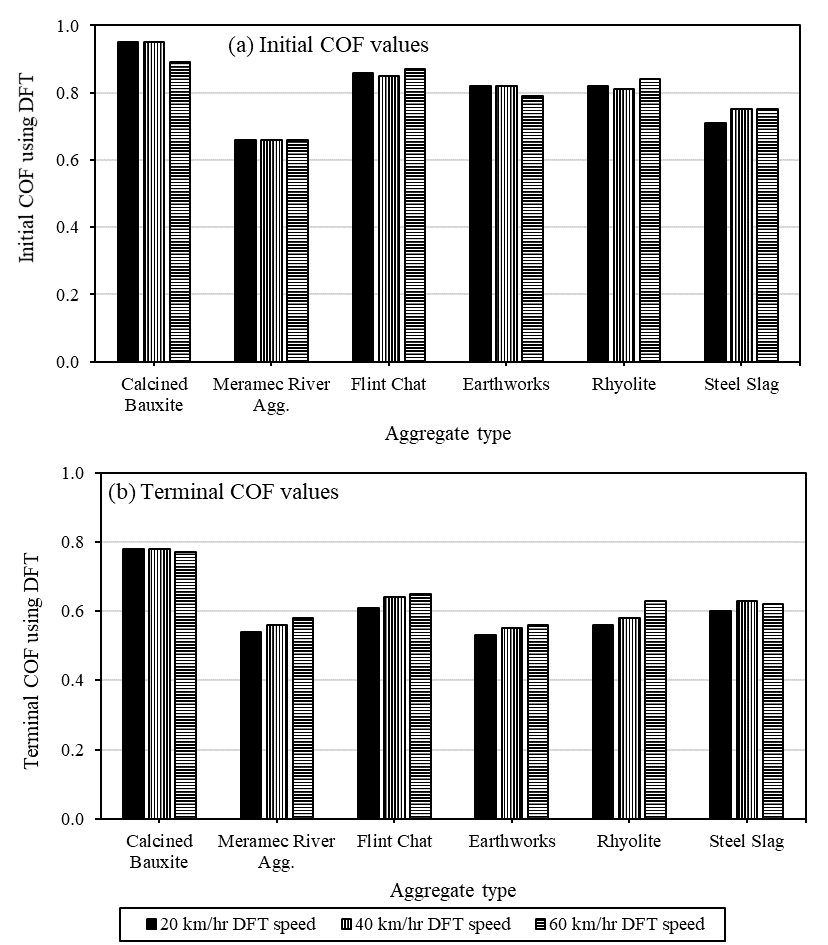
Figure 12 shows the initial and terminal COF values determined by DFT at various speeds for Calcined Bauxite and alternatives. According to the initial COF values, the greatest value was found in Calcined Bauxite, which was followed by Flint Chat, Earthworks, Rhyolite, and Steel Slag. The aggregate from Meramec River had the lowest initial COF. Calcined Bauxite, Flint Chat, Steel Slag, Rhyolite, and Meramec River Aggregate were deemed the best options based on the terminal COF values. Earthworks had the lowest terminal COF value recorded. This was ascribed to the action of polishing and abrasion, which exposed new smoother surfaces underneath the abraded ones. This was agreed with the AIMS results: Earthworks had the highest percentage decrease in the texture indices AMD; however, it showed the highest texture and angularity indices BMD. For the Meramec River Aggregate, the initial COF values were not significantly affected by the DFT speed. As DFT speeds increased, the COFs for the Earthworks (before polishing) and Calcined Bauxite (both after and before polishing) declined. Nonetheless, for the other feasible aggregates, increasing the DFT speed raised the initial and terminal COF values. Rhyolite (after polishing) showed the greatest rise in COF values, with a 12.5% increase when the DFT speed was increased from 20 km/hr to 60 km/hr.
In comparison to the values of initial friction at 0 cycles, Figure 13 displays the percentage of COF value losses calculated using DFT at 20 km/hr after 70k and 140k polishing cycles. After 70k and 140k cycles, Earthworks had the highest percentage of COF loss. After 70k and 140k cycles, Steel Slag showed the lowest percentage of COF loss, followed by Meramec River Aggregate, Calcined Bauxite, Flint Chat, and Rhyolite.
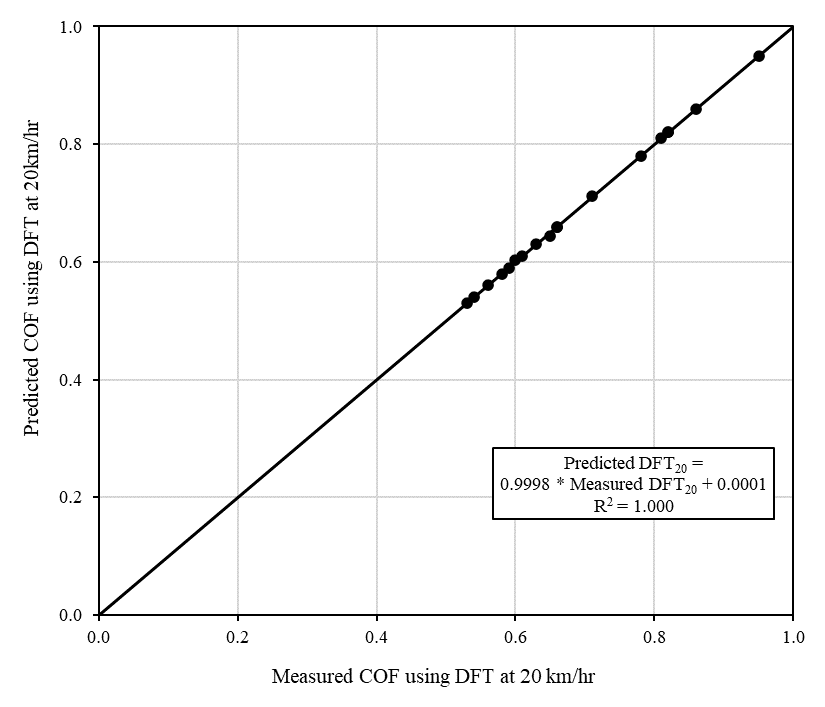
There was a noticeable correlation between the polishing cycles’ number and the COF values determined by DFT. Figure 14 shows the correlation between the polishing cycles’ number and COFs recorded by the DFT at 20 km/hr (DFT20). COF readings declined exponentially as the polishing cycles’ numbers increased. Therefore, an exponential regression was developed for predicting DFT20 based on the polishing cycles’ number, as illustrated in Equation 2. Fitting parameters, for the (DFT20-N) model, were determined using Excel by minimizing the sum of squared error (SSE), as shown in Table 1. Figure 15 depicts the predicted and measured values of DFT20 for the (DFT20-N) model.
$$DFT_{20} = a + b \times \exp(-c \times N)\tag{2}$$
where,
(a, b, and c) are the fitting parameters, N is the polishing cycles’ number, and DFT20 is the friction coefficient determined by the DFT at 20 km/hr.
3.3. British Pendulum Test
3.3.1. Analyzing the BPN Values
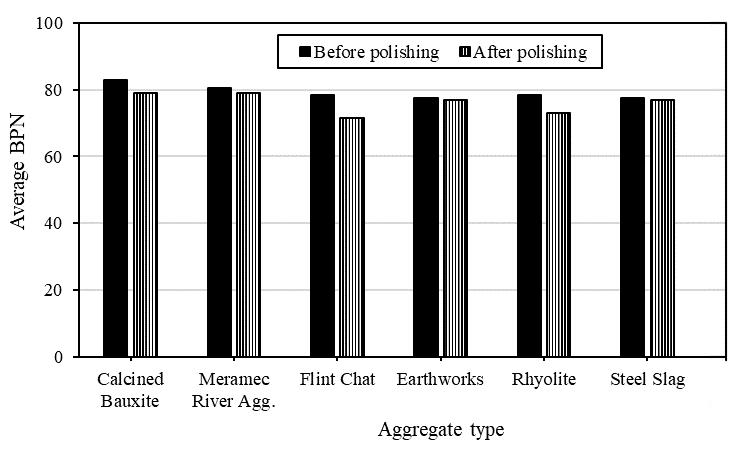
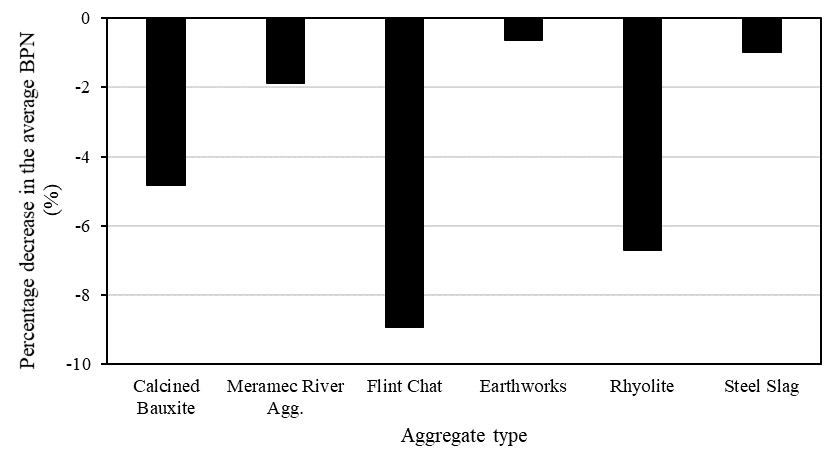
Figures 16 and 18 exhibit aggregate BPN values recorded after and before 10-hour polishing cycles in the British wheel. Figure 16 depicts the average BPNs for aggregate sizes #6 – #8 and #4 – #6. To determine whether there was a significant difference between the means BPN before polishing (first group) and after polishing (second group) at a significance level (α) of 0.05, a paired t-test was used. The p-value was 0.033, which is lower than the α value. Consequently, the two groups’ means differed significantly from one another. Calcined Bauxite had the greatest average BPN value before polishing, followed by Meramec River Aggregate. Following polishing, Meramec River Aggregate had the greatest average BPN, followed by Calcined Bauxite. Before polishing, the average BPN values for Earthworks and Steel Slag were identical (77.5).
After polishing, Earthworks had a BPN that was 0.2 greater than Steel Slag’s. Rhyolite and Flint Chat exhibited similar average BPNs before polishing, while Flint Chat had lower average BPN values than Rhyolite after polishing. Figure 17 shows the percentage decrease in average BPN for aggregates after polishing. Meramec River Aggregate, Steel Slag, and Earthworks percentages decreased the least with less than −2% in the average BPN values, followed by Calcined Bauxite (−4.8%), Rhyolite (−6.7%), and then Flint Chat (−8.9%).
3.3.2. Impact of Aggregate Size on BPN Values
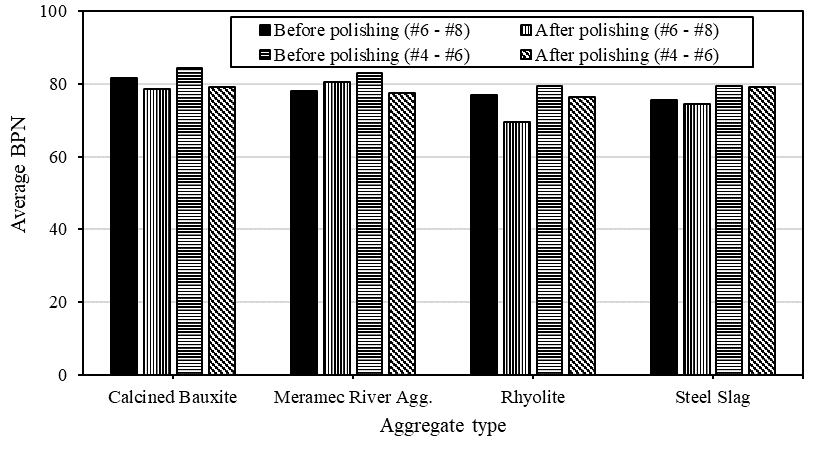
Figure 18 shows the influence of aggregate size (#6 – #8 and #4 – #6) on BPN values. To determine if there was a significant difference between the means BPN of the four groups—before polishing (#4 – #6), after polishing (#4 – #6), before polishing (#6 – #8), and after polishing (#6 – #8)—a two-way ANOVA test was employed at α = 0.05. Additionally, it was determined whether there was a significant difference between the means BPN of the four aggregate types shown in Figure 18. The four groups had a p-value of 0.031 based on the results of the ANOVA test,
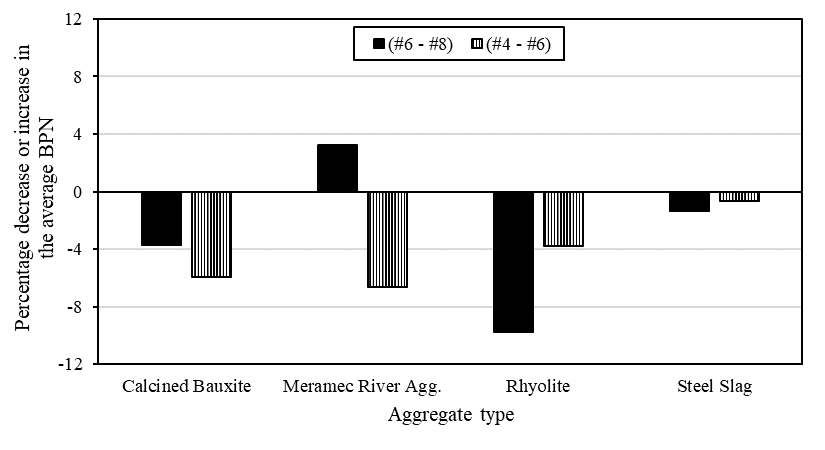
and the aggregate types also showed a p-value of 0.031. The significant difference between the means was indicated by both p-values being less than the α value. The results of Calcined Bauxite were compared to three alternatives: Meramec River Aggregate, Rhyolite, and Steel Slag. The aggregates sized #4 – #6 had greater BPN values after and before polishing than the aggregates size #6 – #8. Nevertheless, Meramec River Aggregate with #4 – #6 size had a lower BPN value after polishing than #6 – #8 size. The four aggregates showed lower BPN values after polishing than BPN values before polishing except for the Meramec River Aggregate with #6 – #8 size. This was related to the increase in the texture indices for AMD (105 or 180) when compared to the texture index for BMD. Figure 19 depicts the percentage increase or decrease in BPNs following the polishing procedure for aggregates of
two sizes: #6 – #8 and #4 – #6. All aggregates’ BPNs dropped after polishing, except for the Meramec River Aggregate of #6 – #8 size showed a 3.2% increase. Moreover, after polishing, the average BPN decreased at the lowest percentage in Steel Slag (−1.3% for the #6 – #8 size and −0.6% for the #4 – #6 size). This transpired because the texture indices for AMD (105 or 180) for both Meramec River Aggregate and Steel Slag increased when compared to the texture index for BMD. Micro-Deval abrasion of Steel Slag resulted in uneven and rougher surfaces as smoother ones were removed. This enhanced each particle’s surface area, resulting in an increased texture index. Thus, polishing the Steel Slag particles with the TWPD and British wheel raised the texture index, resulting in the lowest percentage of losses in COF and BPN values.
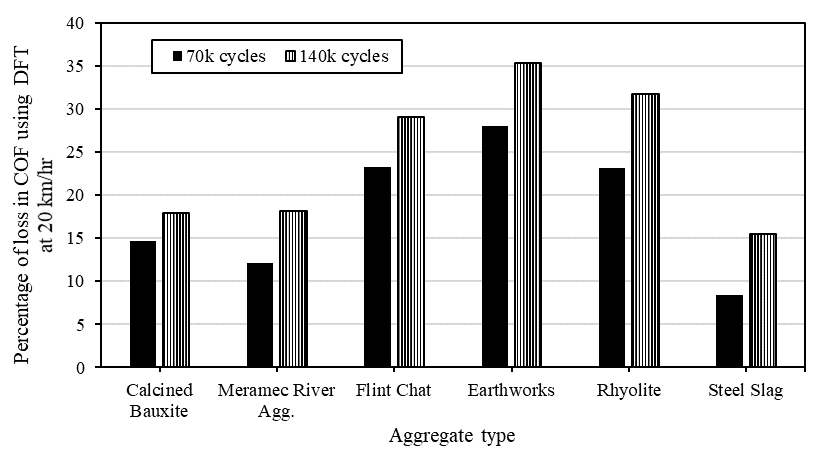
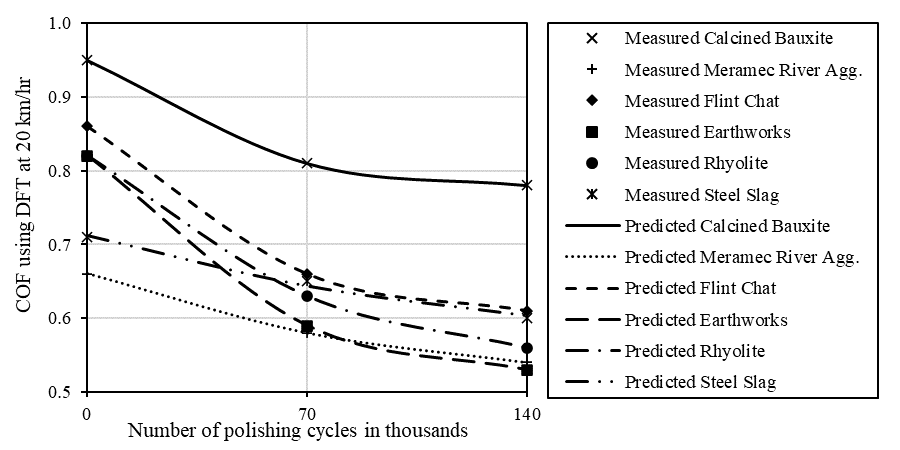
Table 1: Fitting Parameters for the (DFT20-N) Model
Aggregate | Fitting Parameters | SSE | ||
a | b | c | ||
Calcined Bauxite | 7.718E−01 | 1.782E−01 | 2.20040E−02 | 1.174E−11 |
Meramec River Aggregate | 5.000E−01 | 1.600E−01 | 9.90020E−03 | 2.058E−11 |
Flint Chat | 5.933E−01 | 2.667E−01 | 1.98037E−02 | 1.954E−12 |
Earthworks | 5.088E−01 | 3.112E−01 | 1.91958E−02 | 1.493E−12 |
Rhyolite | 5.192E−01 | 3.008E−01 | 1.42638E−02 | 9.063E−12 |
Steel Slag | 5.459E−01 | 1.663E−01 | 7.54360E−03 | 5.512E−05 |
4. Conclusions
This study explored the frictional performance of Calcined Bauxite and five alternatives: Rhyolite, Earthworks, Meramec River Aggregate, Steel Slag, and Flint Chat. Additionally, among the alternatives, two byproducts recycled aggregates, Steel Slag and Flint Chat, were selected. The frictional performance tests comprised AIMS, accelerated friction testing (dynamic friction and sand patch tests), and BP testing. The effects of aggregates’ sizes on the aggregates’ frictional performances—AIMS and BP—were analyzed. The study led to the following conclusions:
- Meramec River Aggregate, Flint Chat, and Steel Slag are considered to be substitutes for Calcined Bauxite.
- The DFT results showed that Calcined Bauxite had the greatest COF values. Nonetheless, Meramec River Aggregate demonstrated, with values ranging from 1% to 5%, lower percentages of COF losses after polishing than Calcined Bauxite.
- Percentages of losses in COF values with polishing cycles are good indicators for identifying Calcined Bauxite alternatives.
- The polishing cycles’ number and the COFs evaluated by DFT showed an exponential relationship. Increasing the polishing cycles’ number lowered the COFs. After polishing, the COFs fell by 8% to 35%.
- Flint Chat and Steel Slag had the greatest MTD values in the sand patch test, whereas Calcined bauxite had the lowest MTD value. Steel Slag and Flint Chat had MTDs that were 21% and 23% higher than those of Calcined Bauxite, respectively.
- Calcined Bauxite had the highest average BPN before polishing, which was 3% greater than the average BPN for Meramec River Aggregate. However, Meramec River Aggregate had the highest average BPN after polishing, surpassing the value of Calcined Bauxite by 0.13%.
- Larger aggregates had BPNs that were higher than those of smaller aggregates, with differences in values ranging from 0.8 to 7.
- According to the AIMS data, Steel Slag had the highest average angularity and average texture indices AMD 180, outperforming Calcined Bauxite by 58.5% and 8%, respectively. Moreover, after polishing, Steel Slag showed 3.8% less BPN losses than Calcined Bauxite. This was related to the increase in texture indices AMD.
- Percentages of change in texture and angularity indices after Micro-Deval abrasion can be used as screenings for alternatives to Calcined Bauxite.
- Reducing aggregate size from 3/8ʺ – 1/4ʺ to 1/4ʺ – #4 lowered texture indices by −7.3% to −16.5% and angularity indices by −1% to −6.9%, according to averaged AIMS indices based on BMD, AMD 105, and AMD 180.
5. Future Work
- Evaluation of the frictional performance of HFST field sections with selected alternatives to Calcined Bauxite using DFT and BP.
- The assessment of the frictional performance of other locally accessible aggregates with various aggregate sizes would allow the authors to validate their findings on a larger scale.
List of Acronyms
Acronym | Meaning |
AIMS | Aggregate Image Measurement System |
AMD | After Micro-Deval |
BMD | Before Micro-Deval |
BPN | British Pendulum Number |
COF | Coefficient of Friction |
CTM | Circular Texture Meter |
DFT | Dynamic Friction Tester |
HFST | High Friction Surface Treatment |
HMA | Hot Mix Asphalt |
MTD | Mean Texture Depth |
TWPD | Three-Wheel Polishing Device |
Conflict of Interest
The authors declare no conflict of interest.
Funding
This research was funded by MoDOT, project No. TR202005.
Acknowledgment
The authors thank MoDOT for technical and financial help in supplying equipment and information for this study. The DFT was carried out at the University of Idaho under the direction of Dr. Emad Kassem and Mr. Juan Pinto Ortiz.
Author Contributions
The authors confirm their contribution to the manuscript as follows: Conceptualization: Abdelrahman and Deef; methodology: Abdelrahman, Broaddus, and Deef; validation: Abdelrahman, Deef, and Broaddus; formal analysis: Abdelrahman and Deef; investigation: Abdelrahman, Broaddus, and Deef; resources: Abdelrahman; writing—original draft preparation: Abdelrahman, Deef, and Broaddus; writing—review and editing: Abdelrahman and Deef; visualization: Abdelrahman and Deef; supervision, project administration, and funding acquisition: Abdelrahman; All authors reviewed the results and approved the final version of the manuscript.
- J. M. P. Mayora, R. J. Piña, “An assessment of the skid resistance effect on traffic safety under wet-pavement conditions,” Accident Analysis & Prevention, vol. 41, pp. 881–886, 2009, doi:10.1016/j.aap.2009.05.004.
- H. Wang, Z. Wang, “Evaluation of pavement surface friction subject to various pavement preservation treatments,” Construction and Building Materials, vol. 48, pp. 194–202, 2013, doi:10.1016/j.conbuildmat.2013.06.048.
- C. Chen, F. Gu, M. Heitzman, B. Powell, K. Kowalski, “Influences of alternative friction aggregates on texture and friction characteristics of high friction surface treatment,” Construction and Building Materials, vol. 314, 2022, doi:10.1016/j.conbuildmat.2021.125643.
- G. Flintsch, I. L. Al-Qadi, R. Davis, K. K. McGhee, “Effect of HMA Properties on Pavement Surface Characteristics,” In Proceedings of the Pavement Evaluation Conference, Roanoke, Virginia, U.S.A., 2002.
- Frequently asked questions about high friction surface treatments (HFST), FHWA-CAI-14-019, [Online]. Available online: https://www.fhwa.dot.gov/innovation/everydaycounts/edc-2/pdfs/fhwa-cai-14 019_faqs_hfst_mar2014_508.pdf (accessed on 4 August 2024).
- B. Wilson, A. Mukhopadhyay, “Alternative Aggregates and Materials for High Friction Surface Treatments,” Final Report, Project BDR74-977-05, Texas A&M Transportation Institute, College Station, Texas, U.S.A., 2016.
- High friction surface treatments in Pennsylvania, Pennsylvania department of transportation, [Online]. Available online: https://www.tesc.psu.edu/assets/docs/high-friction-surface-treatments.pdf (accessed on 1 August 2024).
- High friction surface treatment (HFST) quick reference, DTFH61-13-D-00001, Task B9, FHWA, [Online]. Available online: https://www.fhwa.dot.gov/publications/research/safety/highfriction/High-Friction-Surface-Treatment-final.pdf (accessed 6 August 2024).
- D. Merritt, M. Moravec, M. Heitzman, High friction surface treatment aggregate durability study, pavement evaluation 2014, Blacksburg, Virginia, U.S.A., 2014, [Online]. Available online: https://vtechworks.lib.vt.edu/bitstream/handle/10919/54620/Merritt.pdf?sequence=1&isAllowed=y (accessed 24 July 2024).
- R. Milstead, X. Qin, B. Katz, J. Bonneson, M. Pratt, J. Miles, P. Carlson, “Procedures for Setting Advisory Speeds on Curves,” Final Report, FHWA-SA-11-22, Federal Highway Administration, Office of Safety, Washington, D.C., U.S.A., 2011.
- D. L. Bloem, “Skid Resistance: The Role of Aggregates and Other Factors,” National Sand and Gravel Association Circular 109, Silver Spring, MD, U.S.A., 1971.
- E. Deef-Allah, K. Broaddus, M. Abdelrahman, “Life cycle cost analysis of high friction surface treatment applications,” Transportation Research Record, vol. 2676, pp. 512–526, 2022, doi:10.1177/03611981221079825.
- S. Li, R. Xiong, X. Dong, Y. Sheng, B. Guan, Y. Zong, C. Xie, J. Zhai, C. Li, “Effect of chemical composition of calcined bauxite aggregates on mechanical and physical properties for high friction surface course,” Construction and Building Materials, vol. 302, 2021, doi:10.1016/j.conbuildmat.2021.124390.
- E. Deef-Allah, K. Broaddus, M. Abdelrahman, “Evaluation of Alternatives to Calcined Bauxite for Use in High Friction Surface Treatment (HFST) in Missouri,” Final Report, cmr 21-006, Missouri Department of Transportation, Jefferson City, Missouri, U.S.A., 2021.
- E. Deef-Allah, K. Broaddus, M. Abdelrahman, “Physical properties and durability testing for calcined bauxite and its alternatives,” International Journal of New Technology and Research, vol. 7, pp. 61–69, 2021, doi:10.31871/IJNTR.7.12.16.
- J. F. Bledsoe, H. S. Lee, “HFST Before and After Safety Analysis,” Final Report, cmr 21-003, Missouri Department of Transportation, Jefferson City, Missouri, U.S.A., 2021.
- E. Kassem, A. Awed, E. A. Masad, D. N. Little, “Development of predictive model for skid loss of asphalt pavements,” Transportation Research Record, vol. 2372, pp. 83–96, 2013, doi:10.3141/2372-10.
- P. S. Kandhal, Jr. F. Parker, “NCHRP Report 405: Aggregate Tests Related to Asphalt Concrete Performance in Pavements,” Final Report, Project D4-19 FY ’94, American Association of State Highway and Transportation Officials, Washington, D.C., U.S.A., 1998.
- L. K. Crouch, J. D. Gothard, G. Head, W. A. Goodwin, “Evaluation of textural retention of pavement surface aggregates,” Transportation Research Record, vol. 1486, pp. 124–129, 1995.
- E. Deef-Allah, K. Broaddus, M. Abdelrahman, “Frictional performance correlations for calcined bauxite and alternative aggregates,” International Journal of New Technology and Research, vol. 7, pp. 23–32, 2021, doi:10.31871/IJNTR.7.12.3.
- A. Roshan, M. Abdelrahman, “Evaluating friction characteristics of high friction surface treatment application under varied polishing and slippery conditions,” Transportation Research Record, 2024, doi:10.1177/03611981241257505.
- E. Mahmoud, E. Masad, “Experimental methods for the evaluation of aggregate resistance to polishing, abrasion, and breakage,” Journal of Materials in Civil Engineering, vol. 19, pp. 977–985, 2007, doi:10.1061/(ASCE)0899-1561(2007)19:11(977).
- E. Masad, A. Luce, E. Mahmoud, “Implementation of AIMS in Measuring Aggregate Resistance to Polishing, Abrasion, and Breakage,” Final Report, FHWA/TX-06/5-1707-03-1, Texas Department of Transportation, Austin, Texas, U.S.A., 2006.
- E. Masad, A. Rezaei, A. Chowdhury, P. Harris, “Predicting Asphalt Mixture Skid Resistance Based on Aggregate Characteristics,” Final Report, FHWA/TX-09/0-5627-1, Texas Department of Transportation, Austin, Texas, U.S.A., 2009.
- S. Li, R. Xiong, D. Yu, G. Zhao, P. Cong, Y. Jiang, “Friction Surface Treatment Selection: Aggregate Properties, Surface Characteristics, Alternative Treatments, and Safety Effects,” Final Report, FHWA/IN/JTRP-2017/09, Indiana Department of Transportation, Indianapolis, Indiana, U.S.A., 2017, doi:10.5703/1288284316509.
- M. Heitzman, P. Turner, M. Greer, “High Friction Surface Treatment Alternative Aggregates Study,” Final NCAT Report 15–04, Federal Highway Administration, Washington, D.C., U.S.A., 2015.
- ASTM D6928-17, “Standard Test Method for Resistance of Coarse Aggregate to Degradation by Abrasion in the Micro-Deval Apparatus,” ASTM International, West Conshohocken, Pennsylvania, U.S.A., 2017, doi:10.1520/D6928-17.
- ASTM E965-15(2019), “Standard Test Method for Measuring Pavement Macrotexture Depth Using a Volumetric Technique,” ASTM International, West Conshohocken, Pennsylvania, U.S.A., 2019, doi:10.1520/E0965-15R19.
- ASTM E1911-19, “Standard Test Method for Measuring Surface Frictional Properties Using the Dynamic Friction Tester,” ASTM International, West Conshohocken, Pennsylvania, U.S.A., 2019, doi:10.1520/E1911-19.
- AASHTO T 278-90 (2017), “Standard Method of Test for Surface Frictional Properties Using the British Pendulum Tester,” AASHTO Provisional Standards, Washington, D.C., U.S.A., 2017.
- AASHTO T 279-18, “Standard Method of Test for Accelerated Polishing of Aggregates Using the British Wheel,” AASHTO Provisional Standards, Washington, D.C., U.S.A., 2018.
- E. Mahmoud, E. Ortiz, “Implementation of AIMS in Measuring Aggregate Resistance to Polishing, Abrasion, and Breakage,” Final Report, FHWA-ICT-14-014, Illinois Department of Transportation, Springfield, Illinois, U.S.A., 2014.