A Bibliometric Analysis Review on Energy Optimization while Designing Wireless Sensor Networks

(This article belongs to the Section Electrical Engineering (ELE))
Export Citations
Cite
Masopoga, M. I. , Sumbwanyambe, M. , Wang, Z. and Netshikweta, N. R. (2024). A Bibliometric Analysis Review on Energy Optimization while Designing Wireless Sensor Networks. Journal of Engineering Research and Sciences, 3(11), 81–92. https://doi.org/10.55708/js0311007
Makwena Idah Masopoga, Mbuyu Sumbwanyambe, Zenghui Wang and Nthambeleni Reginald Netshikweta. "A Bibliometric Analysis Review on Energy Optimization while Designing Wireless Sensor Networks." Journal of Engineering Research and Sciences 3, no. 11 (November 2024): 81–92. https://doi.org/10.55708/js0311007
M.I. Masopoga, M. Sumbwanyambe, Z. Wang and N.R. Netshikweta, "A Bibliometric Analysis Review on Energy Optimization while Designing Wireless Sensor Networks," Journal of Engineering Research and Sciences, vol. 3, no. 11, pp. 81–92, Nov. 2024, doi: 10.55708/js0311007.
Energy optimisation algorithms play an essential role in reducing energy usage. Hence, it is mandatory to identify current themes and predict future research study in energy optimisation algorithms (EOAs) in wireless sensor networks (WSNs). Several reviews have been conducted on energy optimisation algorithms (EOAs) in WSNs, although many focused on narrative reviews. This study focuses on the findings of a bibliometric analysis of the literature on the status of EOAs proposed to reduce energy consumption in WSNs. The main objective is to inform future research on the status of EOAs in WSNs. In this study, a systematic literature review and bibliometric analysis are performed to evaluate the depth and extent of the research done in EOAs in WSNs. The literature searched broadly and systematically concerning WSNs from the WOS database (WOS) from 2019 to 2023 articles. The analysis considers bibliometric data from bibliometric coupling, co-citation analysis, co-authorship analysis, and keyword co-occurrence units of analysis retrieved from VOSviewer software. Following the study of the bibliometric data, various themes on WSNs and their applications have emerged. The results of the bibliometric analysis revealed that many schemes are used for these WSNs. This article has projected a detailed bibliometric analysis of PSO and LEACH protocols in WSNs by searching the WOS Database. The study also revealed opportunities to improve research work in WSNs by using different routing protocols.
1. Introduction
We have reviewed the previous articles from other authors involved in the same research. A few algorithms were also performed to correct the challenges we still face in WSNs. These algorithms have also contributed to improving the network performance. A few algorithms that have been performed that are very popular are the LEACH (Low Energy Adaptive Clustering Hierarchy) algorithm [1], the PSO (Particle Swarm) algorithm [2], EECA[3](Energy Efficiency Clustering Algorithm), Firefly optimisation algorithm[4], Ant Colony optimization algorithm [5] etc. In this paper we only focus on LEACH and PSO as they are the most popular as compared to the rest. LEACH [6]–[13] is an energy-efficient routing protocol that ensures that the selected cluster heads are regularly distributed over the network and that there is no possibility that all cluster heads concentrate on a single part of the network. It also balances the energy consumption of the sensor nodes and spreads it evenly in the entire network before the energy is depleted. One of the major drawbacks of LEACH is that if the cluster head dies for any reason, the cluster becomes useless because the data collected by the cluster nodes never reaches its destination. PSO, [14]–[21], [22]–[25] is an optimisation technique in which the social behavior of natural species is considered for the calculation. It is a population-based swarm intelligence technique that performs an optimisation process to optimize a fitness function. This approach uses a swarm to find each particle and records the fitness value of each particle. Then, the particles are linked with their appropriate speed. The best position of all the local intelligence particles optimizes the global best position to identify the cluster head position and minimize overall energy consumption. This algorithm has more efficiency and throughput than other mathematical and heuristic approaches; however, the distance between the sensor nodes is still unknown and reacts with environmental conditions. Another big disadvantage of this algorithm is that it can converge prematurely and, especially for complex problems, be trapped in a local minimum. Poor battery performance directly impacts the WSNs performance and lifespan. This is the biggest challenge these days that affects the lifetime of WSNs [26]. The time used in WSNs should be long enough to keep them operating for an extended period. A bibliometric analysis review was used to conduct this research. We implemented the exclusion/inclusion criteria to remain with the most relevant literature for analysis.
To address the research statement, the following objectives will be considered:
(1) To identify the current publication trends in WSNs.
(2) To identify the most influential authors, countries, and organizations in WSNs.
(3) To analyze the current state of collaboration involving WSNs.
(4) To recognize which area of study needs additional study or improvement in WSNs [27].
This article explores a bibliometric review of optimisation techniques, namely the PSO and LEACH Algorithms and their applications in WSNs. This article is written to understand the correlation between different research works carried out so far in using these algorithms. The application of bibliometric analysis [28] reviews is still a new topic for WSNs. This method is not only applied in WSNs but can be applicable in other areas of research such as in references [29] and [30], where the authors classically do a detailed bibliometric analysis, dividing the references into smaller groups related to the given topic, while in this paper, we do a different way of bibliometric analysis. Many of the publications have used the Scopus database. Hence, we selected to focus only on the WOS. The other reason is that the vast majority of cited materials are peer-reviewed articles based on other publications from different databases. These peer-reviewed articles have been analyzed and checked by experts more knowledgeable in the subject area. However, our future review proposed to extend our study to conference papers, book chapters, reviews, etc. So many papers have looked at the same algorithms this paper is reviewing. However, none of them has done a systematic literature [31] review coupled with the bibliometric analysis [32]. The significance of this study is summarised as follows. The overall energy consumption in WSNs will be reduced by implementing energy optimisation algorithm in the wireless network at each transmitter. Furthermore, it balances total energy consumption across the network by implementing an intelligent clustering approach to select cluster heads based on a well-defined energy gradient adaptively.
The following shows how the paper is organized: Section 2 focuses on the bibliometric analysis research design, followed by Section 3, which concentrates on the review report; Section 4 is the study’s contributions; Section 5 is the study’s discussions and recommendations; and Section 5 is the conclusions.
2. Bibliometric Analysis Research Design
The bibliometric analysis process followed is shown in Figure 1 below, showing briefly how the whole process was followed to conduct this research.
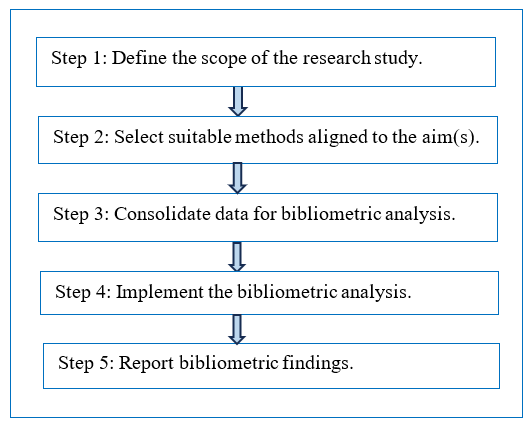
Step 1: This first step is to define the aims and scope of the bibliometric study, which must occur before selecting bibliometric analysis techniques[34] and gathering the data. A bibliometric study’s objectives ought to be connected to evaluating the effectiveness and science of a particular field of study. Regarding performance, bibliometric studies frequently aim to analyze the various research components in the subject, such as authors, institutions, nations, and journals. Scientifically speaking, bibliometric investigations are typically intended to highlight the bibliometric structure, which captures the networks among research components that contribute to the intellectual structure based on groups of relevant themes in the research field.
Step 2: The second step is to design the bibliometric study, wherein the techniques for bibliometric analysis are chosen to meet the aims and scope of the study in the previous step. One challenge that researchers often encounter at this stage is picking a technique based on the bibliometric data sought or choosing a method and then preparing the bibliometric data according to that selected technique. Bibliometric data is often retrieved in a raw format, as in this case. To conduct a comprehensive review of a research field utilizing an extensive bibliometric collection, a blend of co-citation analysis (past), bibliographic coupling (present), and co-word analysis (future) and future research directions of full texts can be chosen.
Step 3: The third step is to gather the data required for the selected bibliometric analysis techniques in the second step. To provide broad search results to justify bibliometric analysis and narrow to stay within the specific research subject. Researchers must define their search terms in this step. In this regard, researchers have two options: the first is to consult the literature to identify a relevant combination of search terms, and the second is to brainstorm among themselves or with subject matter experts to curate suitable search terms. Following that, researchers will need to ascertain the bibliometric data that needs to be collected from the returned search results. Researchers should revisit the bibliometric analysis methods they selected for the investigation in this context. Researchers should concentrate on gathering the title, abstract, keywords, and full text of publications in the search results, for instance if they chose co-word analysis in the second step. However, in cases where the required data is unavailable, the first and second steps should be revisited. To reduce the need for the consolidation of different databases, the paper suggests choosing a single suitable database because reducing the number of pointless action items can reduce the possibility of human error. The researchers should then eliminate duplicates and incorrect entries. Researchers should clean the entry in such cases so that only one valid affiliation, “the affiliation of the author at the time of publication, “remains in the final dataset.
Step 4: Conducting the bibliometric analysis is the fourth step. Theoretically, conducting the bibliometric analysis and composing the bibliometric review are two distinct processes. But these action items frequently complement one another. This paper presents the bibliometric analysis, which produces bibliometric summaries, and the writing of the findings as a single step considering this feedback loop. The journal the researcher is writing for, and the field the study is conducting typically influence the writing style. For instance, one journal might prefer that researchers concentrate on the theoretical elements of the study. Still, another journal might prefer that researchers go directly to the summary of study findings. In this regard, this paper recommends researchers check targeted journals to see if they have a history of publishing review papers, and if yes, then to retrieve those papers, and if possible, those that use bibliometrics, so that a similar style of writing can be crafted. Lastly, the paper challenges academics to create perceptive debates that address pertinent trends and comparable arguments.
Step 5: The final step is to report the findings. The final phase involves interpreting the results of the bibliometric analysis. To do this, it is critical to comprehend the meaning associated with the topics of publications in each thematic cluster and the content within each one. To understand the content well, it is also important to examine its contextual meaning in relation to the entities or events that characterize that content. For example, the co-word analysis presents researchers with different clusters of words. Researchers may depend on terms that appear frequently in the cluster to comprehend its content; however, to interpret the context of each cluster, researchers also need to examine the relationships between the terms.
The following Table 1 shows how the research design was done. We propose the following research questions:
Table 1: Bibliometric analysis techniques to address the research questions.
RQN | Research Question | Technique | Usefulness |
RQ1 | What are the current publication trends in WSNs? | Bibliometric coupling | To evaluate the current evolution of topics in WSNs. In this study, we will evaluate it to identify current publications. |
RQ2 | Who are the most influential authors, countries, and organizations who researched WSNs? | Co-citation analysis | To provide information on the connections between publications and the most influential publications. Counting citations in significant research databases and internet sources keeps track of authors’ words, the significance of articles, and the development of research ideas. |
RQ3 | What is the current state of collaboration involving WSNs? | Co-authorship | To analyze the social interactions and relationships among authors, their affiliations, and the number of publications they have collaborated on. |
RQ4 | Which areas need additional study or improvement in WSNs? | Co-word/ or co-occurrence analysis | To investigate the existing or future connections between research topics by examining the written content of a publication. |
3. Search Criteria
Using the search query string in the WOS database, 442 research articles were found, and the publication language was English. The keywords used for searching this WOS database were WSN, LEACH, PSO[35], Energy optimisation, routing, bibliometric analysis, and literature review.
The following search criteria produced the results that were finally used in the entire analysis[36].
- Identification – in this category, we have identified records by searching through the currently available database, which, in this case, we only concentrated on the WOS.
- Screening – during this level, we check if there are any duplicates of papers/journals, so that if there are any, then we remove all the duplicates.
- Eligibility – when we check if all the articles match the research topic we are currently working on and remove anything that is not in the same field. Furthermore, we only looked at the papers for the past five years and excluded anything before.
- Inclusion – this is where our refinement process was done, and we now know exactly how many articles we will use for the research.
Bibliometric information presented in this section is articulated using the following details by analyzing the .csv file obtained through WOS DB. The said information is as follows: Bibliometrics is used to understand the quantitative methods of analysis of scientific journals. The bibliometric analysis includes (1) Various parameters such as author information, publication year, journal in which articles are published, year publication, source of the articles, territory or geographic location of the authors, etc. (2) Understanding meaning insights such as the relationship with the authors and co-authors, frequency of publications, co-occurrences of keywords and articles, top researchers in the field of study, number of citations, etc. With all the quantitative information obtained from the bibliometric analysis, it is obvious that researchers will benefit from exploring future publication trends, the scope of journals that are focused on a specific domain of interest, etc. In this section, a detailed bibliometric analysis is conducted based on the” CSV” file obtained from the WOS database to understand the essence of PSO techniques in improving the LEACH[37] protocol of WSNs.
The inclusion and exclusion criteria were used and detailed below:
The criteria for inclusion are
- If the content of the article seems to discuss energy optimisation of WSN, we obtain its full reference
- Journal articles written in English
- Articles were chosen based on those that addressed energy optimisation in WSNs
The criteria for exclusion are
- Any study that is not about WSNs
- Studies before 2019, we believe someone would have adapted the recent methodology.
- Publications other than journal articles were excluded as they were not peer-reviewed by the top experts in the field
- Any articles addressing anything but not WSN were also excluded
The following PRISMA diagram shows our search criteria regarding the method and number of documents used for this literature review. The records found during the search were 442 articles. Only articles were selected in this case as we know that they are peer-reviewed by top researchers who are knowledgeable in the subject area. From this, we went through a screening process where all the duplicates were removed and ended up with 194 records.
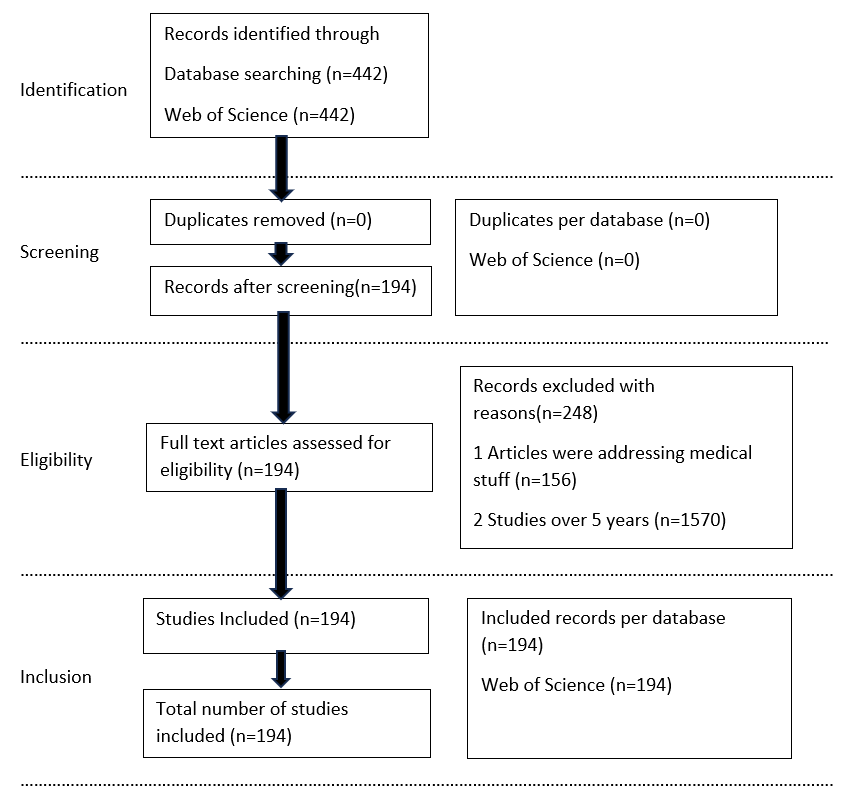
Adapted from [38]
4. Review Report
A bibliometric analysis was performed, and the following results are based on the work done from 2018-2023 with about 442 articles downloaded from WOS. The topics used during the search string were WSNs, energy efficiency, optimisation algorithms, routing, and clustering. From these articles, a screening process was necessary to remove duplicates, which was done using Mendeley. Then, our records after screening remained at 442. The search was further refined under categories where only the Telecommunications category was selected. After this refinement, the articles published under Telecommunications went down to 194.
To produce all the figures from the Vosviewer database, the following step-by-step illustrations were followed: After the above refinement process,
- The first step was to save the text file from WOS and convert it to CSV.
- From there, we opened the VOSviewer software, went under file, and click on create.
- It will then lead to a screen where you select the data type which in this case we selected the an option to create map based on bibliographic data.
- It will to a screen where you choose the data source which we chose database file.
- From there the next screen will ask you to select the type of file you have saved from the database you are using.
- From here you choose the type of analysis and counting method per your preference
3.1 Volume of publications per year
Table 2 and Figure 3 show the number of publications done annually since 2019 from the WOS database. The results show that the overall number of authors who have done research in the subject matter that we are currently researching is 50, the number of times that their articles have been cited is more than 580 times, and we also see the overall reference count of about 1715 which is evident that researchers are still interested in the topic of energy optimization [39], [40] of WSNs.
Table 2: Summary of results from the WOS for the previous 5 years.
Publication Year | Data | Total |
2019 | Count of Authors | 9 |
Sum of Times Cited, All Databases | 144 | |
Sum of Cited Reference Count | 247 | |
2020 | Count of Authors | 17 |
Sum of Times Cited, All Databases | 302 | |
Sum of Cited Reference Count | 584 | |
2021 | Count of Authors | 6 |
Sum of Times Cited, All Databases | 110 | |
Sum of Cited Reference Count | 289 | |
2022 | Count of Authors | 8 |
Sum of Times Cited, All Databases | 22 | |
Sum of Cited Reference Count | 272 | |
2023 | Count of Authors | 10 |
Sum of Times Cited, All Databases | 5 | |
Sum of Cited Reference Count | 323 | |
Total Count of Authors | 50 | |
Total Sum of Times Cited, All Databases | 583 | |
Total Sum of Cited Reference Count | 1715 | |
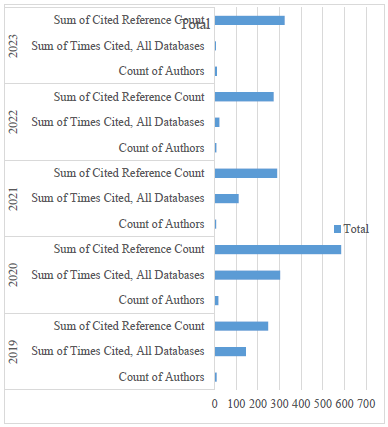
Table 3 and Figure 4 from the WOS database show the number of authors and how many times they were cited in which issue.
Table 3: Author count and citations for the previous 5 years.
Issue | Count of Authors | Number of Times Cited |
1 | 6 | 92 |
2 | 3 | 6 |
3 | 3 | 21 |
5 | 3 | 46 |
6 | 4 | 42 |
7 | 3 | 1 |
10 | 3 | 26 |
12 | 4 | 111 |
13 | 1 | 7 |
16 | 1 | 2 |
17 | 1 | 12 |
18 | 1 | 14 |
21 | 1 | 6 |
22 | 2 | 21 |
24 | 1 | 1 |
13 | 164 | |
Grand Total | 50 | 572 |
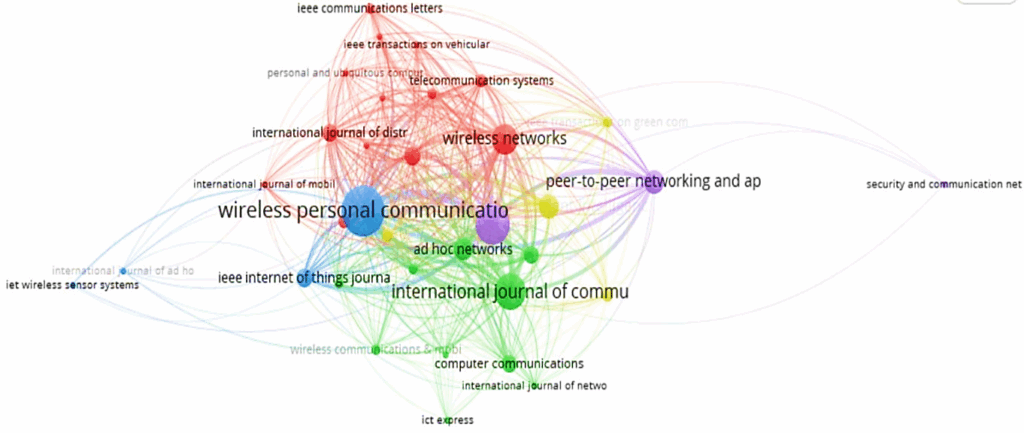
3.2 Results from bibliometric coupling
The bibliometric coupling data are displayed in Table 4 below. It displays the most cited sources and the links’ overall strength. The highest cited sources and the strongest overall link strength are displayed in Figure 5.
Table 4: The topmost sources with high citations per publication, Citations: TC, Total link strength: TLS
ID | Source | Documents | CT | TLS |
1 | ad hoc networks | 8 | 196 | 926 |
2 | annals of telecommunications | 1 | 0 | 191 |
3 | applied system innovation | 1 | 0 | 152 |
4 | computer communications | 5 | 67 | 204 |
5 | computer networks | 5 | 55 | 464 |
6 | eurasip journal on wireless communications and networking | 6 | 128 | 475 |
7 | ict express | 1 | 0 | 21 |
8 | ieee access | 26 | 474 | 2164 |
9 | ieee communications letters | 2 | 78 | 180 |
10 | ieee internet of things journal | 6 | 100 | 457 |
11 | ieee open journal of the communications society | 1 | 0 | 0 |
12 | ieee systems journal | 2 | 45 | 359 |
13 | ieee transactions on green communications and networking | 2 | 62 | 129 |
14 | ieee transactions on vehicular technology | 1 | 47 | 137 |
15 | iet wireless sensor systems | 1 | 12 | 17 |
16 | international journal of ad hoc and ubiquitous computing | 1 | 0 | 20 |
17 | international journal of communication systems | 21 | 129 | 1587 |
18 | international journal of distributed sensor networks | 5 | 77 | 604 |
19 | international journal of mobile computing and multimedia communications | 1 | 2 | 84 |
20 | international journal of network management | 1 | 0 | 82 |
21 | international journal of wireless information networks | 3 | 13 | 272 |
22 | internet of things | 1 | 5 | 90 |
23 | journal of ambient intelligence and humanized computing | 9 | 231 | 518 |
24 | journal of communications software and systems | 1 | 0 | 98 |
25 | journal of internet technology | 1 | 0 | 93 |
26 | ksii transactions on internet and information systems | 3 | 22 | 244 |
27 | mobile information systems | 2 | 17 | 226 |
28 | mobile networks & applications | 2 | 50 | 141 |
29 | peer-to-peer networking and applications | 9 | 31 | 624 |
30 | personal and ubiquitous computing | 1 | 29 | 127 |
31 | security and communication networks | 1 | 14 | 5 |
32 | telecommunication systems | 3 | 88 | 420 |
33 | transactions on emerging telecommunications technologies | 3 | 12 | 78 |
34 | wireless communications & mobile computing | 2 | 224 | 111 |
35 | wireless networks | 15 | 320 | 1460 |
36 | wireless personal communications | 41 | 485 | 2962 |
3.3 Publication impact of countries and journal articles
3.3.1 Publications per country
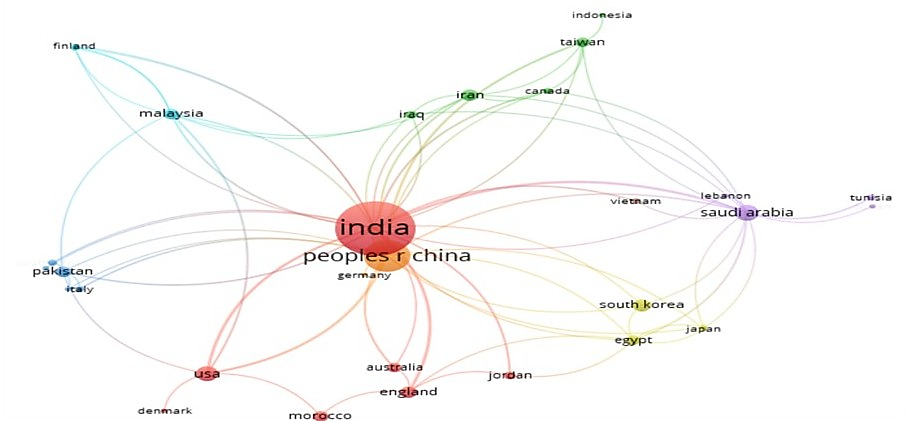
The maximum number of authors per document selected was 25, with the minimum number of authors per document being 1 and the minimum number of citations of an author being 1. By looking at the results shown in Table 5 below, we can see that the topmost 3 countries are India leading with a total citation of 1722 and a link strength of 37 and followed by the Peoples’s Republic of China with a total citation of 792 and a link strength of 28, the 3rd one being South Korea with a total citation of 348 and total link strength of 4.
Table 5: The topmost countries with high citations per publication, Citations: TC, Total link strength: TLS[41]
ID | Country | Documents | CT | TLS |
1 | australia | 4 | 125 | 4 |
2 | canada | 2 | 43 | 6 |
hj3 | egypt | 4 | 76 | 9 |
4 | england | 6 | 157 | 8 |
5 | finland | 1 | 4 | 4 |
6 | india | 121 | 1722 | 37 |
7 | iran | 6 | 151 | 8 |
8 | iraq | 3 | 55 | 5 |
9 | italy | 2 | 23 | 4 |
10 | japan | 1 | 14 | 4 |
11 | jordan | 3 | 74 | 4 |
12 | malaysia | 5 | 72 | 12 |
13 | pakistan | 5 | 94 | 9 |
14 | peoples r china | 41 | 795 | 28 |
15 | russia | 1 | 14 | 4 |
16 | saudi arabia | 11 | 225 | 21 |
17 | south korea | 7 | 348 | 4 |
18 | taiwan | 4 | 51 | 8 |
19 | tanzania | 1 | 4 | 4 |
20 | usa | 10 | 76 | 13 |
21 | yemen | 1 | 4 | 4 |
Figure 6 below shows the topmost countries with high citations and the strongest total link strength. India is the first top country out of this category.
3.3.2 Publications per organizations
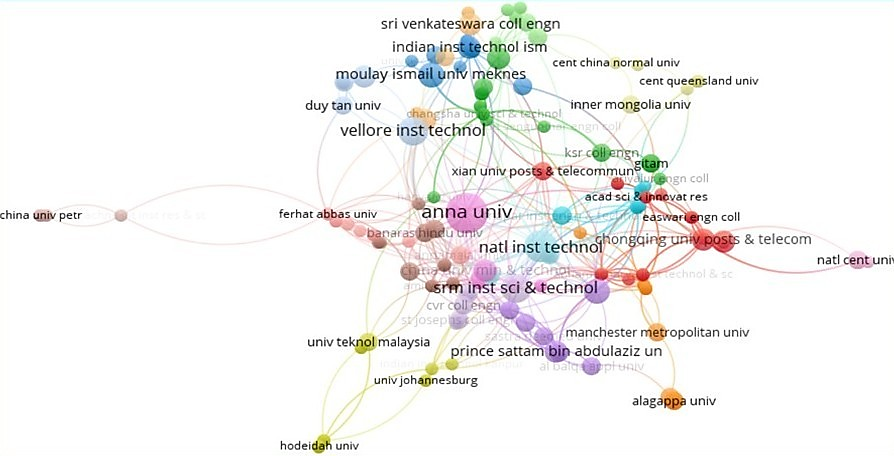
The research went further, and we also checked the category of organizations. The results in Table 6 show the topmost organizations published in the study of WSNs with the most to the least total link strength. Figure 7 below illustrates the organizations with at least 3 documents per publication.
Table 6: Top organizations that published with the most to the least link strength, Citations: TC, Total link strength: TLS
ID | Organization | Documents | CT | TLS |
1 | al balqa appl univ | 2 | 73 | 8 |
2 | alagappa univ | 2 | 79 | 9 |
3 | anna univ | 10 | 228 | 10 |
4 | babol univ med sci | 1 | 38 | 7 |
5 | bonch bruevich st petersburg state univ telecommu | 1 | 14 | 8 |
6 | changchun univ sci & technol | 1 | 14 | 8 |
7 | chongqing univ posts & telecommun | 3 | 89 | 9 |
8 | guangzhou univ | 1 | 38 | 7 |
9 | harbin inst technol | 1 | 14 | 8 |
10 | howard univ | 2 | 23 | 7 |
11 | islamic azad univ | 3 | 84 | 13 |
12 | kalasalingam acad res & educ | 2 | 79 | 9 |
13 | king saud univ | 1 | 38 | 7 |
14 | manchester metropolitan univ | 2 | 52 | 8 |
15 | menoufia univ | 1 | 14 | 8 |
16 | natl yunlin univ sci & technol | 1 | 38 | 7 |
17 | prince sattam bin abdulaziz univ | 3 | 66 | 18 |
18 | princess nourah bint abdulrahman univ | 4 | 27 | 12 |
19 | rudn univ | 1 | 14 | 8 |
20 | sastra deemed univ | 2 | 52 | 8 |
21 | saudi elect univ | 2 | 17 | 11 |
22 | srm inst sci & technol | 5 | 95 | 12 |
23 | tokyo inst technol | 1 | 14 | 8 |
24 | univ regina | 1 | 38 | 7 |
25 | univ sistan & baluchestan | 1 | 38 | 7 |
26 | vellore inst technol | 5 | 173 | 18 |
3.3.3 Distribution of Publication Journals
The maximum number of authors per document selected was 25, with the minimum number of citations per document being 1 and the minimum number of citations of an author being 1. By looking at the results shown in Figure 8 below, it is evident that the topmost 3 journals are Wireless Personal Communications leading, with a total citation of 485 and a total link strength of 43, followed by IEEE Access, with a total citation of 474 and the total link strength of 42, the last one being Wireless Networks with a total citation of 320 and total link strength of 29.
3.4 Co-citation analysis
The maximum number of authors per document selected was 25, with the minimum number of authors per document being 1 and the minimum number of citations of an author being 1. Of the 598 authors found, only 501 meet the threshold, and 301 are connected through collaborations with the other authors.
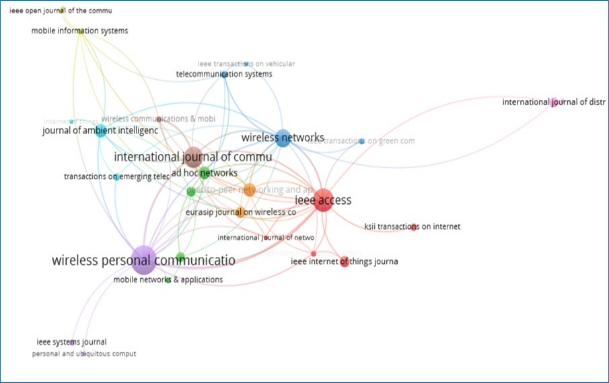
Figure 9 below shows they each worked with authors from two clusters in 2020, 2021, and 2022. These authors who worked so hard and collaborated more are K Shankar and Deepak Gupta. Shankar K has collaborated with all the authors in clusters 1 and 2, while Gupta Deepak has collaborated with authors in clusters 2 and 3. Refer to Table 7 and Figure 9 below to view the outcomes.
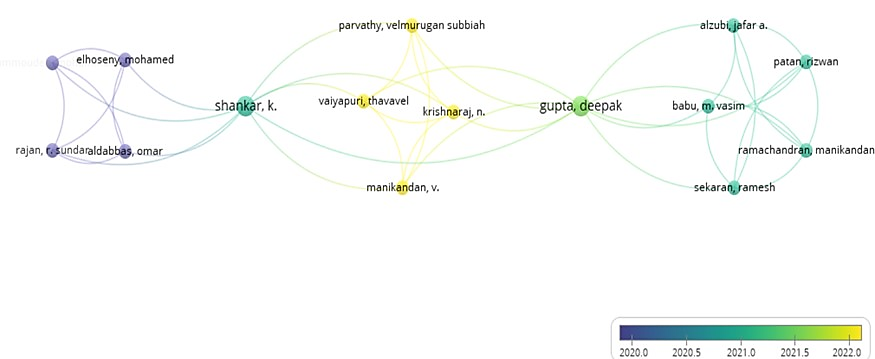
Table 7: Co-authorship collaboration based on the number of documents, Citations: TC, Total link strength: TLS.
ID | Author | Documents | Citations | TLS |
1 | abasikeles-turgut, ipek | 1 | 218 | 0 |
2 | abbas, sidra | 1 | 218 | 5 |
3 | abd el-latif, ahmed a. | 1 | 218 | 6 |
4 | abdelhaq, maha | 1 | 218 | 5 |
5 | abdennaceur, baghdad | 1 | 218 | 2 |
6 | abdul-qawy, antar shaddad hamed | 1 | 143 | 5 |
7 | abdulzahra, ali mohammed kadhim | 1 | 143 | 2 |
8 | abdulzahra, suha abdulhussein | 1 | 122 | 2 |
9 | abu bakar, kamalrulnizam | 1 | 94 | 3 |
10 | acken, john m. | 1 | 85 | 2 |
11 | adeliyi, timothy | 1 | 85 | 2 |
12 | adhikari, kabita | 1 | 79 | 5 |
13 | agrawal, sunil | 1 | 72 | 2 |
14 | ahn, seyoung | 1 | 70 | 4 |
15 | akilan, t. | 1 | 68 | 3 |
16 | al duhayyim, mesfer | 1 | 68 | 7 |
17 | al-otaibi, shaha | 1 | 68 | 5 |
18 | al-qurabat, ali kadhum m. | 1 | 67 | 2 |
19 | al-rasheed, amal | 1 | 67 | 5 |
20 | al-shdaifat, alaa | 1 | 67 | 3 |
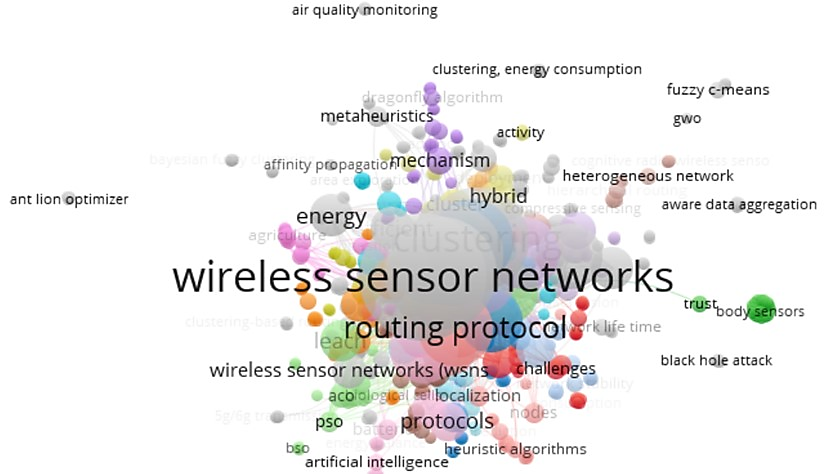
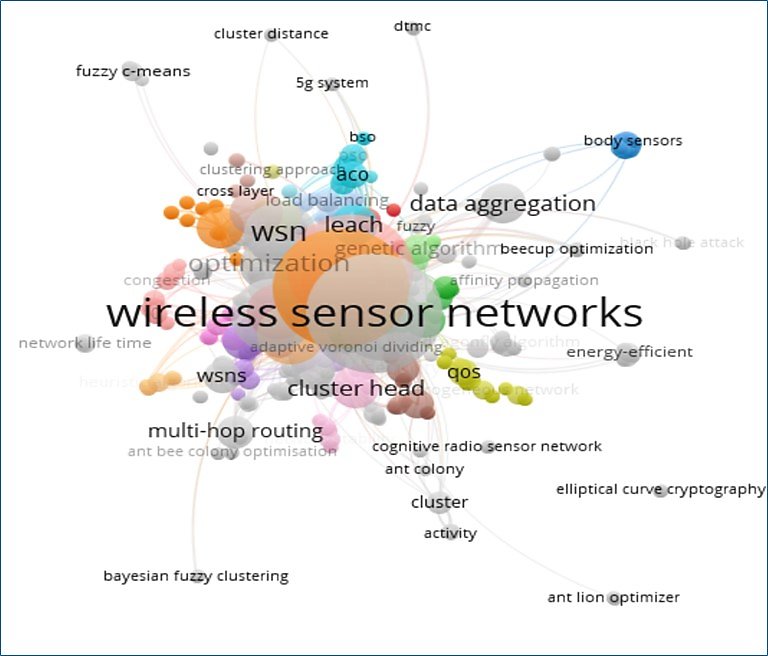
3.5 Co-occurrences of keywords
Table 8 below demonstrates unequivocally that WSNs remain the most explored keyword, appearing over 150 times more frequently than the others and having the strongest overall link strength of over 1500. Also, in both Figures 10 and 11, it is evident that “WSNs [42]” is the leading keyword being researched by authors.
3.5.1 Co-occurrences word count
Table 8: Co-occurrences of keywords in a publication, Total link strength: TLS.
ID | Keyword | Occurrences | TLS |
1 | wsn | 26 | 291 |
2 | WSNs | 104 | 1071 |
3 | wireless sensor network | 34 | 324 |
4 | scheme | 26 | 307 |
5 | routing protocols | 25 | 320 |
6 | routing protocol | 36 | 419 |
7 | routing algorithm | 14 | 165 |
8 | routing | 49 | 500 |
9 | protocols | 10 | 135 |
10 | protocol | 47 | 460 |
11 | particle swarm optimisation | 9 | 102 |
12 | optimisation | 40 | 466 |
13 | network lifetime | 30 | 321 |
14 | mobile sink | 9 | 104 |
15 | lifetime | 31 | 362 |
16 | leach | 11 | 111 |
17 | iot | 11 | 150 |
18 | internet of things | 17 | 219 |
19 | internet | 23 | 288 |
20 | fuzzy logic | 12 | 114 |
21 | energy-efficient | 28 | 253 |
22 | energy efficiency | 81 | 814 |
23 | energy consumption | 30 | 353 |
24 | energy | 12 | 105 |
25 | efficient | 12 | 115 |
26 | data aggregation | 12 | 152 |
27 | clustering-algorithm | 11 | 113 |
28 | clustering algorithms | 20 | 273 |
29 | clustering | 69 | 590 |
30 | cluster head selection | 12 | 115 |
31 | cluster head | 10 | 103 |
32 | aware | 10 | 119 |
33 | algorithm | 64 | 663 |
3.5.2 Keywords co-occurrence statistical analysis
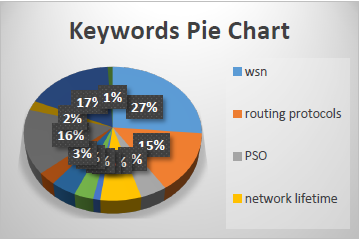
The following statistical analysis was done on the keyword occurrences, and the results for each keyword were combined to get the total occurrences. The top 30 words were selected to complete this exercise. The results for the most keywords with 50 occurrences and above are shown in Table 8 below, while Table 9 and Figure 12 show the keywords with high occurrences:
The highest count being WSN; we found 6 occurrences of this word, the first word having 80, the second one having 32, the third one having 22, the fourth one having 8, followed by the fifth also having 8, and the last one having 6, which makes a total of 156. The lowest count is the Genetic Algorithm (GA)[43][44][45] with 4 occurrences, the first word having 5, followed by the second word with 4, while the third word has 3 and the fourth word having 2, which makes a total of 14.
Table 9: Author’s keywords with high occurrences.
ID | Author’s keywords | Acronyms | Occurrences |
1 | WSNs | WSN | 156 |
2 | clustering algorithm | CA | 102 |
3 | energy efficiency | EE | 92 |
4 | routing algorithm | RA | 85 |
5 | network lifetime | NL | 40 |
6 | cluster head | CH | 34 |
7 | energy consumption | EC | 33 |
8 | internet of things | IOT | 25 |
9 | particle swarm optimisation | PSO | 25 |
10 | leach | LEACH | 19 |
11 | fuzzy logic | FLG | 18 |
12 | genetic algorithm | GA | 14 |
13 | quality of service | QOS | 9 |
14 | delay | DLY | 8 |
15 | mobile sink | MS | 7 |
16 | multi-hop routing | MHR | 6 |
17 | heterogeneity | HTR | 6 |
18 | sensor node | SN | 6 |
19 | ant colony algorithm | ACA | 6 |
20 | grey wolf optimisation | GWO | 6 |
21 | monitoring | MNT | 5 |
22 | base stations | BS | 5 |
23 | metaheuristics | MTH | 5 |
24 | multi-objective optimisation | MOO | 5 |
25 | load balancing | LB | 4 |
26 | mobile nodes | MN | 4 |
27 | batteries | BTT | 3 |
28 | spread spectrum communication | SSC | 3 |
29 | artificial bee colony | ABC | 3 |
30 | optimal path | OP | 2 |
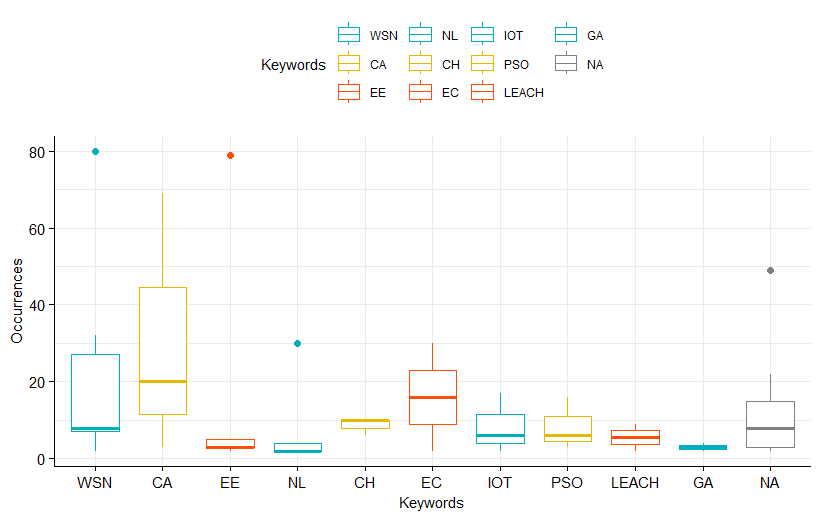
3.5.2.1 Summary statistics by groups – count, mean, standard
Summary statistics are used to summarize a set of observations and to communicate the largest amount of information as simply as possible. Our results are shown in groups of 12 below, each group consisting of the keyword, count (N), mean (M), and standard (SD). The largest group from the results below is WSN with (N= 7, M= 22.6, SD=27.4), while we find the two lowest groups with interesting results. Groups 3 and 8 are the lowest group in this summary, having (N=3) while the mean and standard values differ. EC has (M=16, SD=19.8) while LEACH has (M=5.5, SD=4.95).
Table 10: Summary statistics by groups – count, mean, standard.
ID | Keywords | Count | Mean | SD |
1 | CA | 3 | 30.7 | 34.3 |
2 | CH | 3 | 8.67 | 2.31 |
3 | EC | 2 | 16 | 19.8 |
4 | EE | 5 | 18.4 | 33.9 |
5 | GA | 3 | 3 | 1 |
6 | ICR | 3 | 2.67 | 0.577 |
7 | IOT | 3 | 8.33 | 7.77 |
8 | LEACH | 2 | 5.5 | 4.95 |
9 | NL | 5 | 8 | 12.3 |
10 | PSO | 3 | 8.33 | 6.81 |
11 | RP | 4 | 21.8 | 19.3 |
12 | WSN | 7 | 22.6 | 27.4 |
3.5.2.2. Box and whisker plots
Box plots are helpful as they provide a visual summary of the data, enabling researchers to quickly identify mean values, the dispersion/variability of the data set, and signs of skewness. Box plots divide the data into sections containing approximately 25% of the data in that set.
The median line of LEACH, EC, and NA box plots is the only one showing normal distribution of data sets, while the rest show skewness of data. The median line of the WSN, EE, NL, IOT [46] [47] [48], and PSO box plots shows that the distribution is positively skewed, while CH is the only one with a negatively skewed distribution. Then, when we compare the interquartile ranges (the box lengths) to examine how the data is dispersed between each sample, the longer the box, the more dispersed the data, and the smaller the box, the less dispersed the data. The longest box in our results is the CA box, which shows that the data is primarily dispersed in this sample, while the smallest box with the less dispersed is the GA[49].
Box and whisker plots also show the variability of data. In statistics, data variability is the extent to which a distribution is stretched or squeezed. We notice outliers when we look at our results in Figure 13 below. Outliers are data points located outside the whiskers of the box plots. In this case, we identified four outliers in our results.
5. Contributions of the study
This review is worth carrying out as it seeks to make the following contributions:
We identified current publications by evaluating the evolution of energy optimisation topics in WSNs[50]. We achieved this by performing a systematic literature review and a bibliometric analysis review. Previously, researchers used the normal method and did not couple the two. The results of the bibliometric review of research on energy optimisation algorithms of WSNs show that the topic is still highly interesting and can be explored more. The study also shows that the bibliometric methodology has become extremely popular recently because of the accessibility and utility of bibliometric databases and software, which make it easier to gather and evaluate vast amounts of scientific data for scientific research.
6. Discussions and Recommendations
All The co-citation analysis presents us with information on the connections between publications and the most influential publications. By counting citations in significant research databases and internet sources, we keep track of authors’ keywords, the significance of articles, and the development of other research ideas.
We performed a co-authorship analysis to obtain relevant author’s information and their affiliations. By analyzing this information, we identified the extent of the social interactions and relationships among authors, their affiliations, and the number of publications they have collaborated on.
Co-authorship analysis showed that India co-authored more WSNs with the People’s Republic of China, South Korea, Iran, Australia, Saudi Arabia, and others in WSNs than with other countries. India, the People’s Republic of China, and South Korea are the three most publishing countries that collaborate with other countries. India is the top publishing country in WSNs, and its collaboration with other countries is also high. The relationship between India and the People’s Republic of China is stronger than that of other countries in terms of collaboration. We conclude that India is one of the most research centers in the world and can make a meaningful impact on WSNs.
The keyword occurrence analysis has revealed many optimisation techniques to address energy efficiency in WSNs. The densification of network devices in wireless networks has resulted in energy consumption challenges. Due to this growing challenge, research will continue to seek and propose new techniques to optimize energy in WSNs. Thus, research on energy optimisation is still a topic of interest to many researchers in WSNs [51]. This is also confirmed by the network visualization results obtained from the “co-occurrences of keywords” section
The review considered peer-reviewed journal articles. We propose considering other sources of information to widen the scope of the analysis. The potential sources of information include conference proceedings, books, and others. WOS is not the only database that can be analyzed using bibliometric software such as VOSviewer. Literature from other databases such as Scopus, IEEE, and Dimension can be analyzed, and comparisons made to evaluate their validity.
7. Conclusions
The results demonstrate the continued relevance and necessity of this study, as evidenced by the high total link strength and the continuous publication of research on WSNs in comparison to other keywords. It is evident that further investigation into the energy optimisation of WSNs is still required, and significant progress may be achieved in preserving the network’s lifespan. In conclusion this paper also showed that bibliometric analysis is a scientific approach that can be helpful for researchers who want to look back on a wide range of rich and expansive topics in business studies, both seasoned and novice scholars.
The purpose of this research was to offer a review on the literature on optimisation algorithms to address energy efficiency on WSNs. The study considers literature obtained from WOS database from 2019 until 2023. We considered WOS database since it is one of the largest databases and most widely used for the analysis of scientific publications, including WSNs, a subfield of wireless networks. VOSviewer. By applying the bibliometric approach based on data from the WOS and using simple visualization tool, we were able to address all stated research questions.
Conflict of Interest
The authors declare no conflict of interest.
Acknowledgment
We acknowledge the University of South Africa and the Department of Electrical Engineering.
- I. Daanoune, A. Baghdad, and A. Ballouk, “Improved LEACH protocol for increasing the lifetime of WSNs,” Int. J. Electr. Comput. Eng., vol. 11, no. 4, 3106–3113, Aug. 2021, doi: 10.11591/ijece.v11i4.pp3106-3113.
- C. Wang, “A Distributed Particle-Swarm-Optimization-Based Fuzzy Clustering Protocol for Wireless Sensor Networks,” Sensors, vol. 23, no. 15, 2023, doi: 10.3390/s23156699.
- Y. Gong, X. Guo, and G. Lai, “A Centralized Energy-Efficient Clustering Protocol for Wireless Sensor Networks,” IEEE Sens. J., vol. 23, no. 2, 2023, doi: 10.1109/JSEN.2022.3224180.
- H. Pakdel and R. Fotohi, “A firefly algorithm for power management in wireless sensor networks (WSNs),” J. Supercomput., vol. 77, no. 9, 2021, doi: 10.1007/s11227-021-03639-1.
- M. Z. Abd Latif, K. G. Lim, M. K. Tan, H. S. Ee Chuo, T. Wang, and K. T. Kin Teo, “Energy-Efficient Ant Colony Based LEACH Routing Algorithm in Wireless Sensor Network,” in 4th IEEE International Conference on Artificial Intelligence in Engineering and Technology, IICAIET 2022, 2022. doi: 10.1109/IICAIET55139.2022.9936851.
- S. Ramesh et al., “Optimization of Leach Protocol in Wireless Sensor Network Using Machine Learning,” Comput. Intell. Neurosci., vol. 2022, 2022, doi: 10.1155/2022/5393251.
- S. Bharany et al., “Energy-efficient clustering scheme for flying ad-hoc networks using an optimized leach protocol,” Energies, vol. 14, no. 19, 2021, doi: 10.3390/en14196016.
- J. Mao, M. Gu, and Y. Huo, “Improved Routing Algorithm for Wireless Sensor Networks Based on LEACH,” in 2022 International Communication Engineering and Cloud Computing Conference, CECCC 2022, 2022. doi: 10.1109/CECCC56460.2022.10069668.
- M. Gamal, N. E. Mekky, H. H. Soliman, and N. A. Hikal, “Enhancing the Lifetime of Wireless Sensor Networks Using Fuzzy Logic LEACH Technique-Based Particle Swarm Optimization,” IEEE Access, vol. 10, no. April, pp. 36935–36948, 2022, doi: 10.1109/ACCESS.2022.3163254.
- I. Daanoune, B. Abdennaceur, and A. Ballouk, “A comprehensive survey on LEACH-based clustering routing protocols in Wireless Sensor Networks,” Ad Hoc Networks, vol. 114. 2021. doi: 10.1016/j.adhoc.2020.102409.
- L. Zhao, S. Qu, and Y. Yi, “A modified cluster-head selection algorithm in wireless sensor networks based on LEACH,” Eurasip J. Wirel. Commun. Netw., vol. 2018, no. 1, 2018, doi: 10.1186/s13638-018-1299-7.
- K. A. Raji, A. W. Asaju-Gbolagade, and K. A. Gbolagade, “EFFECTIVE ROUTING PROTOCOL FOR WIRELESS SENSOR NETWORKS USING CRT-LEACH ALGORITHM,” MALAYSIAN J. Comput., vol. 6, no. 2, 2021, doi: 10.24191/mjoc.v6i2.10396.
- L. Zhao, S. Qu, and Y. Yi, “A modified cluster-head selection algorithm in wireless sensor networks based on LEACH,” Eurasip J. Wirel. Commun. Netw., vol. 2018, no. 1, Dec. 2018, doi: 10.1186/s13638-018-1299-7.
- C. Vimalarani, R. Subramanian, and S. N. Sivanandam, “An Enhanced PSO-Based Clustering Energy Optimization Algorithm for Wireless Sensor Network,” Sci. World J., vol. 2016, 2016, doi: 10.1155/2016/8658760.
- O. Deepa and J. Suguna, “An optimized QoS-based clustering with multipath routing protocol for Wireless Sensor Networks,” J. King Saud Univ. – Comput. Inf. Sci., vol. 32, no. 7, 763–774, Sep. 2020, doi: 10.1016/j.jksuci.2017.11.007.
- A. Yadav, S. Kumar, and S. Vijendra, “Network Life Time Analysis of WSNs Using Particle Swarm Optimization,” Procedia Comput. Sci., vol. 132, 805–815, 2018, doi: 10.1016/j.procs.2018.05.092.
- G. Srinivasalu and H. Umadevi, “Proposed energy efficient clustering and routing for wireless sensor network,” Int. J. Electr. Comput. Eng., vol. 13, no. 4, 4127–4135, 2023, doi: 10.11591/ijece.v13i4.pp4127-4135.
- A. Singh, S. Rathkanthiwar, and S. Kakde, “Energy efficient routing of WSN using particle swarm optimization and V-LEACH protocol,” in International Conference on Communication and Signal Processing, ICCSP 2016, Institute of Electrical and Electronics Engineers Inc., Nov. 2016, 2078–2082. doi: 10.1109/ICCSP.2016.7754544.
- A. Kaswan, V. Singh, and P. K. Jana, “A multi-objective and PSO based energy efficient path design for mobile sink in wireless sensor networks,” Pervasive Mob. Comput., vol. 46, 2018, doi: 10.1016/j.pmcj.2018.02.003.
- T. Shankar, S. Shanmugavel, and A. Karthikeyan, “Hybrid approach for energy optimization in wireless sensor networks using PSO,” Int. J. Commun. Antenna Propag., vol. 3, no. 4, 221–226, 2013.
- N. Karasekreter, M. A. Şahman, F. Başçiftçi, and U. Fidan, “PSO-based clustering for the optimization of energy consumption in wireless sensor network,” Emerg. Mater. Res., vol. 9, no. 3, 776–783, 2020, doi: 10.1680/jemmr.20.00107.
- R. L. P. Kumar and Vijayalakshmi, “Energy Efficient Routing in Wireless Sensor Network for Moving Nodes Using Genetic Algorithm Compared with PSO,” in Communications in Computer and Information Science, 2023. doi: 10.1007/978-3-031-25088-0_54.
- B. V. Divakar, D. Patil, and P. P. Subramanium, “Energy Optimization in Wireless Sensor Network using Clustering and PSO Algorithm,” no. June, 5267–5270, 2020.
- P. Rawat and S. Chauhan, “Particle swarm optimization-based energy efficient clustering protocol in wireless sensor network,” Neural Comput. Appl., vol. 33, no. 21, 14147–14165, 2021, doi: 10.1007/s00521-021-06059-7.
- M. Z. Ghawy et al., “An Effective Wireless Sensor Network Routing Protocol Based on Particle Swarm Optimization Algorithm,” Wirel. Commun. Mob. Comput., vol. 2022, 2022, doi: 10.1155/2022/8455065.
- R. Nithya, R. Alroobaea, A. Binmahfoudh, and Z. I. Rizman, “Distributed Multi-hop Clustering Approach with Low Energy Consumption in WSN,” Comput. Syst. Sci. Eng., vol. 45, no. 1, 903–924, 2023, doi: 10.32604/csse.2023.030749.
- B. R. Al-Kaseem, Z. K. Taha, S. W. Abdulmajeed, and H. S. Al-Raweshidy, “Optimized Energy – Efficient Path Planning Strategy in WSN with Multiple Mobile Sinks,” IEEE Access, vol. 9, 2021, doi: 10.1109/ACCESS.2021.3087086.
- N. Donthu, S. Kumar, D. Mukherjee, N. Pandey, and W. M. Lim, “How to conduct a bibliometric analysis: An overview and guidelines,” J. Bus. Res., vol. 133, no. May, 285–296, 2021, doi: 10.1016/j.jbusres.2021.04.070.
- D. Golubović, M. Erić, N. Vukmirović, and V. Orlić, “High-Resolution Sea Surface Target Detection Using Bi-Frequency High-Frequency Surface Wave Radar,” Remote Sens., vol. 16, no. 18, 2024, doi: 10.3390/rs16183476.
- D. Golubović, M. Erić, and N. Vukmirović, “High-Resolution Doppler and Azimuth Estimation and Target Detection in HFSWR: Experimental Study,” Sensors, vol. 22, no. 9, 2022, doi: 10.3390/s22093558.
- Y. Xiao and M. Watson, “Guidance on Conducting a Systematic Literature Review,” Journal of Planning Education and Research, vol. 39, no. 1. SAGE Publications Inc., 93–112, Mar. 01, 2019. doi: 10.1177/0739456X17723971.
- V. Carneiro, A. Barata da Rocha, B. Rangel, and J. L. Alves, “Design Management and the SME Product Development Process: A Bibliometric Analysis and Review,” She Ji, vol. 7, no. 2, 197–222, 2021, doi: 10.1016/j.sheji.2021.03.001.
- W. M. Lim, “Guidelines for interpreting the results of bibliometric analysis : A sensemaking approach,” 17–26, 2024, doi: 10.1002/joe.22229.
- C. R. Bilder et al., “How to conduct a bibliometric analysis: An overview and guidelines,” J. Bus. Res., vol. 133, no. 3, 285–296, Mar. 2008, doi: 10.1198/jasa.2008.s251.
- A. Sun, S. Li, and Y. Zhang, “WSN clustering routing algorithm based on PSO optimized fuzzy C-means,” Tongxin Xuebao/Journal Commun., vol. 42, no. 3, 2021, doi: 10.11959/j.issn.1000-436x.2021053.
- J. R. Frank and L. A. Maggio, “Bibliometrics : Methods for studying academic publishing,” 173–176, 2022, doi: 10.1007/s40037-021-00695-4.
- Saravana G, Jegadeeswari J S, NaveenKumar V, and PushpaValli M, “Energy Efficiency in Wireless Sensor Networks using Advanced LEACH Protocol,” Int. J. Eng. Technol. Manag. Sci., vol. 6, no. 6, 2022, doi: 10.46647/ijetms.2022.v06i06.011.
- N. C. Khin Khin Oo and S. Rakthin, “Integrative Review of Absorptive Capacity’s Role in Fostering Organizational Resilience and Research Agenda,” Sustainability (Switzerland), vol. 14, no. 19. MDPI, Oct. 01, 2022. doi: 10.3390/su141912570.
- A. Boudhir, M. Bouhorma, and M. Benahmed, “Energy Optimization Approaches In Wireless Sensor Networks: A Survey,” Int. J. Networks Syst., vol. 1, no. 1, 43–51, 2012.
- I. H. Osei and E. O. Osei, “Multipath Energy Optimization Broadcast Routing Protocol for Wireless Sensor Network Using Genetic Algorithm and Ant Colony Optimization,” SSRN Electron. J., 2023, doi: 10.2139/ssrn.4358067.
- B. A. Begum and S. V. Nandury, “Data aggregation protocols for WSN and IoT applications – A comprehensive survey,” Journal of King Saud University – Computer and Information Sciences, vol. 35, no. 2. King Saud bin Abdulaziz University, 651–681, Feb. 01, 2023. doi: 10.1016/j.jksuci.2023.01.008.
- C. Xu, Z. Xiong, G. Zhao, and S. Yu, “An energy-efficient region source routing protocol for lifetime maximization in WSN,” IEEE Access, vol. 7, 2019, doi: 10.1109/ACCESS.2019.2942321.
- M. A. Aydin, B. Karabekir, and A. H. Zaim, “Energy Efficient Clustering-Based Mobile Routing Algorithm on WSNs,” IEEE Access, vol. 9, 89593–89601, 2021, doi: 10.1109/ACCESS.2021.3090979.
- M. K. Singh, S. I. Amin, and A. Choudhary, “Genetic algorithm based sink mobility for energy efficient data routing in wireless sensor networks,” AEU – Int. J. Electron. Commun., vol. 131, 2021, doi: 10.1016/j.aeue.2021.153605.
- S. Wang, “Multipath Routing Based on Genetic Algorithm in Wireless Sensor Networks,” Math. Probl. Eng., vol. 2021, 2021, doi: 10.1155/2021/4815711.
- B. R. Al-Kaseem, Z. K. Taha, S. W. Abdulmajeed, and H. S. Al-Raweshidy, “Optimized Energy – Efficient Path Planning Strategy in WSN with Multiple Mobile Sinks,” IEEE Access, vol. 9, 82833–82847, 2021, doi: 10.1109/ACCESS.2021.3087086.
- M. Aljebreen et al., “Binary Chimp Optimization Algorithm with ML Based Intrusion Detection for Secure IoT-Assisted Wireless Sensor Networks,” Sensors, vol. 23, 1–17, Apr. 2023, doi: 10.3390/s23084073.
- H. Gunigari and S. Chitra, “Energy Efficient Networks Using Ant Colony Optimization with Game Theory Clustering,” Intell. Autom. Soft Comput., vol. 35, no. 3, 3557–3571, 2023, doi: 10.32604/iasc.2023.029155.
- L. Li and D. Li, “An Energy-Balanced Routing Protocol for a Wireless Sensor Network,” J. Sensors, vol. 2018, 2018, doi: 10.1155/2018/8505616.
- Z. Al Aghbari, A. M. Khedr, W. Osamy, I. Arif, and D. P. Agrawal, “Routing in Wireless Sensor Networks Using Optimization Techniques: A Survey,” Wirel. Pers. Commun., vol. 111, no. 4, 2020, doi: 10.1007/s11277-019-06993-9.
- W. Xu, Y. Zhang, Q. Shi, and X. Wang, “Energy management and cross layer optimization for wireless sensor network powered by heterogeneous energy sources,” IEEE Trans. Wirel. Commun., vol. 14, no. 5, 2814–2826, May 2015, doi: 10.1109/TWC.2015.2394799.