Advanced Cloud-Based Solutions for Peripheral Artery Disease: Diagnosis, Analysis, and Visualization

(This article belongs to the Special Issue on Special Issue on Multidisciplinary Sciences and Advanced Technology (SI-MSAT 2024) and the Section Medical Informatics (MDI))
Export Citations
Cite
AboArab, M. A. , Potsika, V. T. and Fotiadis, D. I. (2024). Advanced Cloud-Based Solutions for Peripheral Artery Disease: Diagnosis, Analysis, and Visualization. Journal of Engineering Research and Sciences, 3(12), 24–35. https://doi.org/10.55708/js0312003
Mohammed A. AboArab, Vassiliki T. Potsika and Dimitrios I. Fotiadis. "Advanced Cloud-Based Solutions for Peripheral Artery Disease: Diagnosis, Analysis, and Visualization." Journal of Engineering Research and Sciences 3, no. 12 (December 2024): 24–35. https://doi.org/10.55708/js0312003
M.A. AboArab, V.T. Potsika and D.I. Fotiadis, "Advanced Cloud-Based Solutions for Peripheral Artery Disease: Diagnosis, Analysis, and Visualization," Journal of Engineering Research and Sciences, vol. 3, no. 12, pp. 24–35, Dec. 2024, doi: 10.55708/js0312003.
Peripheral artery disease (PAD) affects 237 million people globally, leading to significant morbidity and mortality. Traditional diagnostic methods are invasive, costly, and require specialized expertise, emphasizing the need for more accessible, and accurate alternatives. This paper introduces the DECODE cloud platform, an advanced tool that leverages cloud computing, machine learning, and high-performance data visualization to enhance PAD diagnosis and treatment. The platform integrates modules for peripheral artery segmentation, reconstruction, and comprehensive data warehousing, supporting 2D and three-dimensional (3D) rendering visualization. It enables the simulation and optimization of drug-coated balloons, enhancing clinical decision-making through robust data analytics. The evaluation metrics demonstrate the platform's efficacy: the multiplanar visualization module achieved a performance score 94%, and the 3D rendering module scored 89%, with both modules attaining perfect scores in best practices and search engine optimization. These results highlight the DECODE platform's capacity to provide scalable, noninvasive diagnostic solutions, setting a new standard in digital health technologies for PAD. This study underscores the transformative potential of integrating advanced visualization and computing techniques in medical diagnostics.
1. Introduction
Peripheral artery disease (PAD) is a globally prevalent circulatory disorder characterized by the narrowing of peripheral arteries, which leads to reduced blood flow to the limbs [1]. This reduction in blood flow can cause symptoms such as leg pain or claudication during physical activity, and slow or non-healing wounds on the feet or toes. In more advanced stages, PAD can result in critical limb ischemia, leading to severe pain at rest, and in some cases, the need for amputation. This condition significantly impacts mobility and quality of life and poses serious health risks. Worldwide, PAD is estimated to affect approximately 7.4% of individuals in high-income countries and 5.1% of those in low-income countries. In Europe, particularly in high-income regions, the prevalence is higher than 10% among people aged 65 and older, emphasizing the disease’s burden on elderly populations [2]. In the United States, PAD affects 8–10 million individuals, with projections suggesting that this number could rise to 19 million by 2050 [3]. The global PAD market, valued at USD 4.45 billion in 2022, is expected to reach USD 9.15 billion by 2031, growing at a compound annual growth rate (CAGR) 8.35% [4, 5]. This economic growth underscores the increasing demand for effective diagnostic and therapeutic solutions for PAD. Early and accurate diagnosis of PAD is essential to mitigate its high morbidity and mortality rates.
Traditional diagnostic methods, such as digital subtraction angiography (DSA) and magnetic resonance angiography (MRA), provide high-resolution imaging of arterial structures and are considered the gold standard for PAD diagnosis. However, DSA is invasive and involves catheterization and contrast injection, which poses risks such as bleeding, infection, and radiation exposure. While MRA is noninvasive and avoids ionizing radiation, it is expensive. Both methods are resource intensive, rely on advanced infrastructure and expertise, underscoring the need for cost-effective, scalable, and noninvasive diagnostic alternatives [6].
Recent advancements in cloud computing and machine learning are revolutionizing healthcare by offering innovative solutions to the challenges posed by traditional diagnostic methods for PAD [7, 8]. Cloud- based platforms are transforming the way health data are managed, enabling secure storage, rapid processing, and sophisticated analysis of vast datasets [9]. These platforms facilitate real-time diagnostic insights, which are crucial for timely and accurate medical decision-making. Moreover, the integration of advanced visualization techniques, such as multiplanar and three-dimensional (3D) rendering, within cloud platforms enhances the ability to examine complex anatomical structures in detail. This synergy between cloud technology and machine learning in medicine improves diagnostic accuracy and supports personalized patient care by allowing the continuous and scalable application of advanced analytics and visualization across diverse clinical settings.
In this work, the DECODE cloud platform is presented, which addresses the complexities of PAD diagnosis and treatment by integrating cutting-edge data processing, analysis, and visualization capabilities. The platform supports the simulation and optimization of drug-coated balloons (DCBs), which are increasingly used in PAD treatment. Through robust data analytics, the DECODE platform enhances clinical decision-making, allowing users to upload, process, and analyze extensive datasets, perform image reconstruction, and utilize computational modeling and machine learning techniques to accurately predict disease progression, assess treatment outcomes, and tailor personalized therapeutic strategies for PAD patients. The platform’s ability to integrate these advanced technologies positions it as a pivotal tool in improving the diagnosis and management of PAD, aligning with the projected growth and evolving needs of the global PAD market.
2. Related Work
The YORwalK app was developed to promote exercise and track walking ability in PAD patients; however, its effectiveness requires further validation through direct patient feedback and clinical trials [10]. TrackPAD, a mobile intervention for supervised exercise therapy (SET), demonstrated promising initial results; however, it faced limitations due to a small sample size and short follow-up period, necessitating larger, long-term studies [11]. A smartphone-enabled exercise program introduced in the smart step trial encountered challenges in maintaining participant engagement and measuring adherence, particularly in low-resource settings [12]. Another study highlighted the need for better disease literacy and SET support in mobile interventions; however, it was constrained by a small sample size [13]. A mobile app designed for supervised home-based exercise therapy aimed to facilitate remote interventions; however, it involved minimal patient interaction, compromising data quality and requiring further development for effective supervision [14]. Research exploring machine learning (ML) and artificial intelligence (AI) applications to improve PAD outcomes emphasized critical issues such as data interoperability, algorithm bias, and the need for extensive validation [15]. An intelligent oscillometric system for PAD detection achieved high accuracy; however, it did not account for the effects of age, necessitating further validation across diverse age groups [16]. A smartphone app compared with motivational interviewing (MI) for increasing walking distance and weight loss in PAD patients found MI to be more effective; however, the study faced limitations, including a small sample size, app usage variability, and lack of an iOS version [17]. The HOBBIT-PAD platform was introduced to promote exercise among PAD patients; however, it is currently available only on Android and requires further evaluation by healthcare providers [18]. Moreover, a comprehensive review of SET’s role in managing PAD emphasized the potential of digital health technologies for home-based interventions. However, despite their promise, these technologies suffer from low participation rates and require optimization and evaluation of long- term outcomes [19].
These studies underscore the potential of digital health technologies for PAD management but emphasize the need for larger, more comprehensive studies and further validation. Our research seeks to address these limitations by developing the DECODE cloud platform, which includes multiple modules: a PAD segmentation and reconstruction module, a data warehouse module, and a multiplanner reconstruction module featuring 2D and 3D WebGL visualization. On the basis of RESTful APIs [20], the DECODE cloud platform enables scalability and modular integration, offering a comprehensive approach to enhance diagnosis, data management, and visualization in PAD treatment, ultimately improving patient outcomes with robust and scalable solutions.
3. Materials and Methods
3.1. Data Provider
The DECODE cloud platform relies on a data provider to ensure the availability and accessibility of medical data essential for simulations, optimizations, and treatment planning [21].
Figure 1, the data provider functions as a critical bridge between the platform’s core modules and various analytical tools. It integrates data from diverse sources, including medical databases, patient records, imaging systems, and research studies, harmonizing these into a unified repository for analysis and visualization.
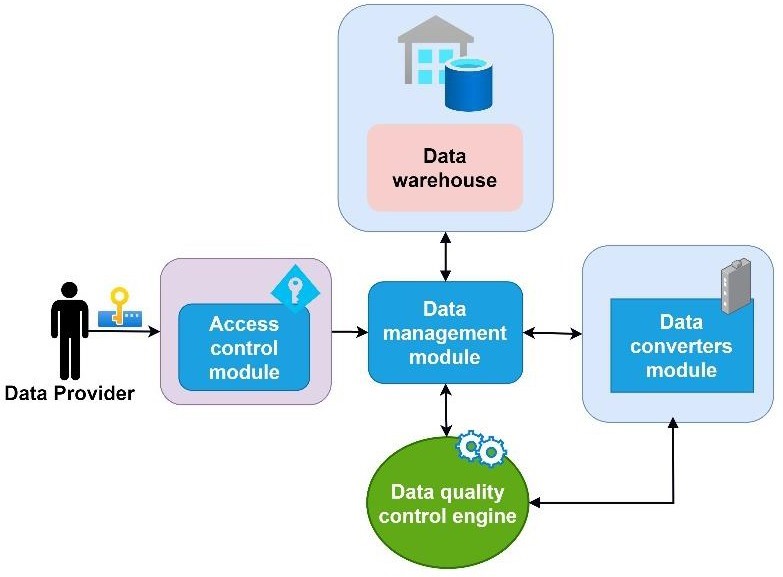
To maintain accuracy, the data provider continuously updates the platform with real-time data, enabling informed decision-making on the basis of the latest medical insights. The process includes cleaning, normalizing, and structuring raw medical data to ensure consistency and reliability. Quality control measures are implemented to identify and rectify any inconsistencies, enhancing the platform’s reliability [22].
Security and privacy are prioritized through strict authentication and authorization protocols, allowing only authorized users to access sensitive data. The data provider supports advanced analytics, enabling the extraction of insights from complex datasets, which informs clinical decisions. As the platform scales, the data provider ensures optimal performance through efficient data retrieval and caching strategies, maintaining responsiveness even with large datasets.
3.2. DECODE Cloud Platform Layers
The DECODE cloud platform is a transformative solution designed to revolutionize the treatment of PAD via DCBs. By enhancing DCB simulation and optimization, the platform integrates advanced technologies and innovative research methodologies to improve treatment outcomes and patient care [23]. The conceptual multilayer hierarchical framework of the DECODE cloud platform, which provides a comprehensive overview of its architecture, is illustrated in Figure 2.
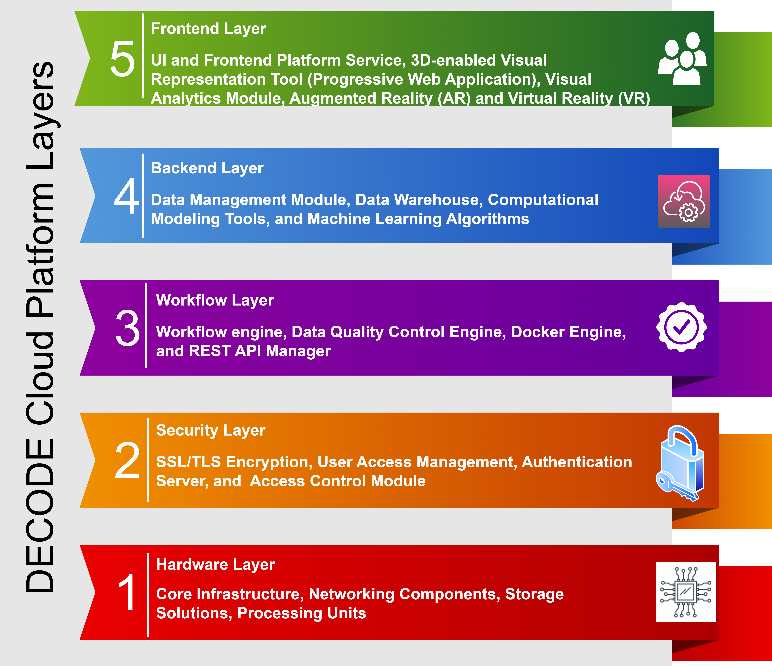
3.2.1. Front-End Layer: User-Centric Interactions
The front‒end layer provides clinicians with intuitive, user-friendly tools for interacting with complex medical data. These components enable seamless access to advanced visualization and analysis functionalities, enhancing clinical decision-making and improving the overall user experience.
3.2.2. Back-End Layer: Computational Core
The back-end layer forms the computational backbone of the platform. It incorporates advanced machine learning algorithms for automated diagnostics, computational modeling tools for simulating and optimizing PAD-specific interventions, and scalable data management modules for handling large, multi-modal datasets. Delivered as SaaS, this layer ensures high- performance processing and accurate, data-driven therapeutic strategies for PAD management.
3.2.3. Workflow Layer: Seamless Integration and Management
The workflow layer acts as a central hub for coordinating platform operations. Functioning as Platform-as-a-Service (PaaS), it includes a workflow management module to streamline data processing, a data quality control engine to ensure dataset accuracy, and a Docker engine and REST API manager [25] to facilitate efficient containerized application management and secure API interactions. This layer ensures seamless integration and operational consistency across the platform’s processes.
3.2.4. Security Layer: Robust Data Protection
The security layer implements advanced data protection measures, including secure socket layer (SSL) and transport layer security (TLS) protocols for encrypting data in transit, ensuring that sensitive patient information remains confidential during transfer between the platform’s components. In addition, the layer employs the JSON Web Token (JWT) API framework for robust user authentication and authorization, allowing granular access control on the basis of user roles and ensuring that only authorized personnel can access specific data and functionalities within the platform.
3.2.5. Hardware Layer: High-Performance Infrastructure
The hardware layer, categorized as infrastructure as a service (IaaS), consists of high-performance components designed for optimal efficiency and reliability. It includes multicore dedicated servers for parallel processing, and the storage infrastructure combines SSDs for rapid data access and HDDs for cost-effective long-term storage, while GPUs are employed to expedite computationally intensive tasks such as image rendering and machine learning model training. By classifying the DECODE cloud platform’s layers according to cloud computing service models, this study elucidates how the platform leverages cloud technology to provide scalable, accessible, and secure services for stakeholders, thereby opening new possibilities in PAD treatment and fostering collaboration among healthcare professionals.
3.3. Distribution of the DECODE Cloud Computing Services to Stakeholders
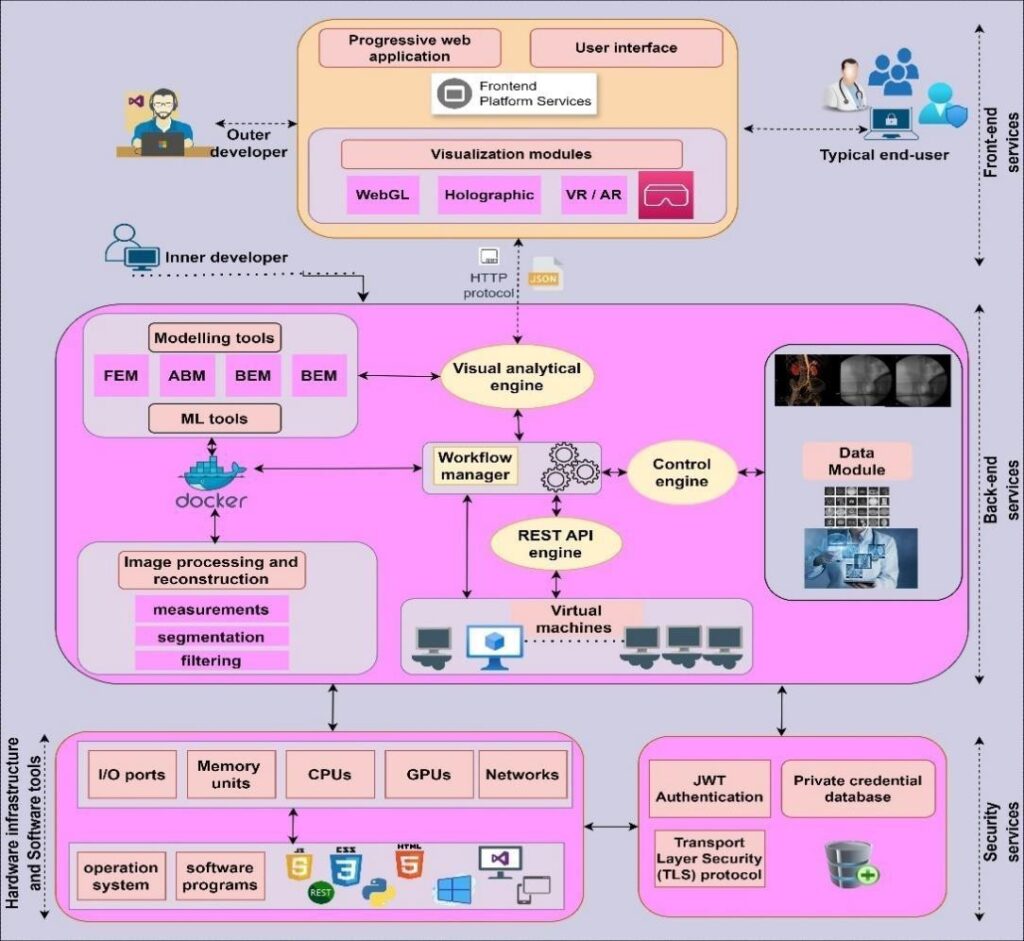
The DECODE cloud platform’s architecture, as illustrated in Figure 3, is strategically designed to distribute its computing services efficiently across a diverse range of stakeholders, including clinicians, researchers, and developers. This distribution model ensures that each stakeholder can fully utilize the platform’s capabilities to achieve their specific objectives in the management and treatment of PAD.
At the forefront of this distribution strategy are end- user services, which are tailored to meet the needs of clinicians and medical professionals. These services are delivered through user interfaces and visual representation modules, such as WebGL for 3D rendering, multiplanar visualization (MPV), holographic, and VR/AR technologies. These tools enable users to interact directly with patient data, provide detailed analyses and facilitate informed decision-making in real time. Front-end services, accessible via progressive web applications (PWAs) [26], form the primary touchpoint for end-users, offering an intuitive and seamless experience.
Research and development services are critical aspects of the platform’s distribution strategy. These services support researchers and developers by providing access to advanced modeling tools, ML algorithms, and robust data processing capabilities. These tools are integrated within backend services, allowing researchers to conduct complex simulations, analyze clinical data, and develop new treatment methodologies.
The workflow and integration services within the DECODE platform are designed to increase operational efficiency and promote seamless collaboration among internal teams [25]. These services, which are managed by components such as the workflow manager and the REST API engine, orchestrate the flow of tasks and data across the platform modules, ensuring seamless integration of the components. By automating critical processes such as data quality control and enabling smooth integration between various analytical tools, the platform ensures a streamlined approach to patient care.
Finally, the infrastructure services layer provides the necessary computational resources that underpin the platform’s operation [27]. This layer includes essential hardware components such as I/O ports, memory units, CPUs, GPUs, and networking equipment, as well as software components and operating systems. These resources are crucial for handling the platform’s computational demands, ensuring that it remains responsive and capable of scaling to meet the growing needs of its users.
4. Visual Representation Modules
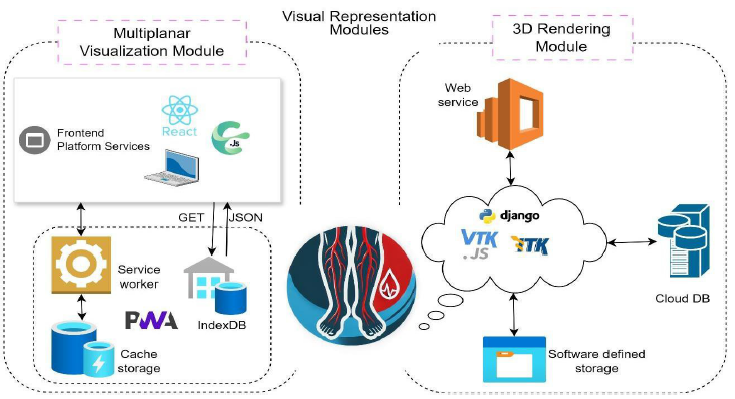
The implementation architectures for the MPV and 3D rendering modules within the DECODE cloud platform are illustrated in Figure 4. These modules are integral for providing detailed and interactive visualization of medical imaging data, which are specifically tailored for diagnosing and treating PAD.
4.1. Multiplanar Visualization
4.1.1. Design and Implementation
The MPV module enables the reconstruction and visualization of 3D anatomical structures from 2D image slices, which are typically obtained from modalities such as computed tomography (CT) and magnetic resonance imaging (MRI) [28]. The implementation of the MPV module is centered around PWAs, ensuring seamless access and interaction across various devices and platforms. The MPV module is implemented via modern web technologies, including React [29] and Cornerstone.js [30], ensuring a responsive and user-friendly interface.
These services are accessible via a PWA, which ensures seamless functionality across various devices without requiring installation. A service worker is employed to manage background tasks, such as caching and retrieving data. This enhances the performance and reliability of the PWA, allowing for offline access and faster loading times [26]. Cached data are stored in Cache Storage, ensuring that frequently accessed information is readily available.
The module uses IndexDB for local storage, allowing the browser to store large amounts of structured data [31]. This is essential for managing the vast datasets involved in medical imaging. The data are retrieved via GET requests and processed in JSON format, ensuring compatibility and ease of manipulation. The frontend platform services interact with the visualization components to render multiplanar views of the DICOM images. Users can navigate through different planes (axial,
sagittal, and coronal) to examine specific regions of interest. This functionality is crucial for accurate diagnosis and treatment planning.
The MPV module is built via a robust architectural framework designed to facilitate a smooth transition from data upload to advanced visualization. The key components of this framework include metadata and image information retrieval, DICOM tool activation, and DICOM image loading functionalities, which are crucial for efficient user experience and functionality.
Enhanced DICOM tools, including tools for magnification, angle measurement, and windowing, are integrated into the MPV module to complement the PWA paradigm. These tools leverage the capabilities of the Cornerstone library, which provides expanded functionalities and compatibility with various image sources. DICOM image loading is managed through the Cornerstone setup, incorporating robust success and failure handling mechanisms.
4.1.2. User Interaction and Visualization
The PWA approach enables seamless DICOM store connectivity, allowing users to search for and load specific studies for detailed analysis. Interactive viewers control support zooming, panning, and resetting, improving user engagement and interaction. The functionality of reference lines and planes is tailored to create spatial relationships within the MPR views, facilitating the alignment and comparison of DICOM images. This integration of reference lines involves constructing 3D lines and planes and coordinating transformations to convert 3D patient points to 2D pixel coordinates [32].
By leveraging these advanced technologies and methodologies, the MPV module within the DECODE platform offers a comprehensive and robust solution for the visualization and analysis of complex medical data.
4.1.3. 3D Rendering Module
The 3D rendering module of the DECODE cloud platform is designed to provide high-fidelity, interactive visualizations of complex medical imaging data. This module leverages advanced WebGL technology to transform 2D CT image slices into detailed 3D representations, enhancing the ability of clinicians to assess and plan treatments with precision [33].
4.1.4. Design and Implementation
The 3D rendering module is crucial for enhancing the diagnostic capabilities for PAD by providing a comprehensive view of the anatomical structures. The web service, represented by a cloud-based architecture, handles the computational demands of rendering and data processing. This setup ensures scalability and efficient resource utilization, which are critical for handling large medical datasets.
The backend services of the 3D rendering module are powered by the Django framework [34], which is known for its robustness in managing heavy computational tasks. Django coordinates the processing and storage of medical imaging data, ensuring seamless integration with the front-end components. This integration is essential for providing a responsive and interactive user experience.
The core rendering functionalities are implemented using vtk.js [35] and itk.js [36], JavaScript libraries specifically designed for medical image processing and visualization. These toolkits provide extensive capabilities for 3D graphics, enabling the creation of interactive and detailed visualizations. The use of these libraries ensures that the rendered images are accurate and high-quality, which is crucial for effective diagnosis and treatment planning.
The processed data are stored in a cloud database, ensuring secure and scalable data management. In addition, software-defined storage solutions are utilized to handle dynamic storage requirements, providing flexibility and efficiency. This approach ensures that the platform can manage large volumes of data efficiently without compromising performance or security.
The 3D rendering module follows a systematic workflow, beginning with the input of volumetric data composed of multiple CT slices. These data undergo a hardware estimation process to ensure the optimal allocation of computational resources, promoting efficient data handling and processing.
4.1.5. User Interface and Controls
The module’s user interface is designed for seamless interaction, offering controls for panning, zooming, and rotating the 3D models. These controls are essential for exploring volumetric data from various angles and perspectives, ensuring that clinicians can thoroughly inspect anatomical structures. In addition, interactive widgets enable users to adjust visualization parameters such as color mapping and opacity, allowing customized views that highlight different tissues and structures as needed [37].
By integrating these advanced technologies and methodologies, the 3D rendering module within the DECODE cloud platform significantly enhances the visualization and analysis of peripheral artery CT images. This module supports clinicians in making informed decisions, ultimately improving patient outcomes and advancing the use of CT and angiography in the diagnosis and treatment of PAD.
4.2. Evaluation Metrics
To assess the effectiveness and quality of the visual representation modules of the DECODE cloud platform, an evaluation was conducted via Google’s Lighthouse tool [38]. Lighthouse is an open-source tool designed to evaluate the performance, accessibility, and best practices of web applications. These metrics were selected to ensure that the platform meets the critical demands of healthcare applications, which require efficiency, inclusivity, and adherence to industry standards.
The evaluation focused on two core modules of the DECODE platform: the MPV module and the 3D rendering module. Each module was tested to determine its performance in several key areas:
- Performance: This metric evaluates the speed and responsiveness of the platform, which is crucial for real-time medical imaging applications where delays can impact clinical decision-making. For example, high performance ensures seamless interaction with large datasets, enabling rapid diagnosis and analysis.
- Accessibility: This parameter evaluates whether the modules are usable by individuals with different types of disabilities, including visual, auditory, motor, or cognitive The evaluation ensures that the modules comply with international accessibility standards, such as the web content accessibility guidelines (WCAGs), which are designed to make web applications more accessible to all users.
- Best Practices: This metric assesses the platform’s compliance with modern web development standards, including security and resource optimization. In healthcare, where sensitive patient data are involved,
- Search Engine Optimization (SEO): SEO is used to ensure that the platform’s content is well structured and easily indexable, contributing to the user experience, which aids in the dissemination of research findings and platform awareness among broader medical communities.
These evaluation criteria were chosen to comprehensively assess the visual representation capabilities of the DECODE platform, ensuring that it provides a reliable, accessible, and high-performing tool for clinicians and researchers involved in the diagnosis and treatment of PAD.
5. Results
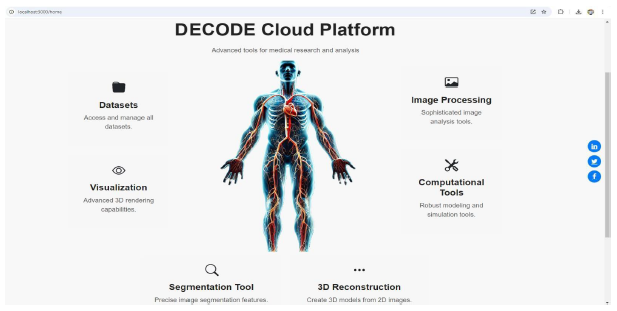
The DECODE cloud platform was developed and evaluated to enhance the diagnosis, analysis, and treatment planning for PAD through its sophisticated visualization and data management capabilities. The platform integrates multiple modules, such as datasets, image processing, computational tools, segmentation tools, 3D reconstructions, and visual representations, each designed to handle specific aspects of medical imaging and data processing, as detailed in Figure 5.
The MPV module, depicted in Figure 6, was instrumental in facilitating the detailed exploration of 2D DICOM images across multiple planes. This module’s advanced capabilities enable clinicians to obtain comprehensive views of the anatomical structures of the PAD. The implementation of a PWA provided seamless access across various devices, significantly enhancing the platform’s usability.
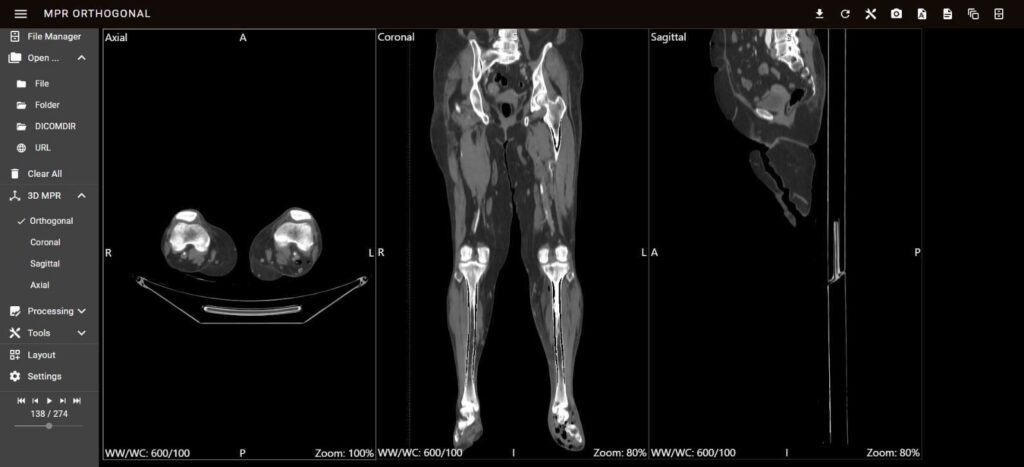
The MPV module is accessible via the RESTful API endpoint/api/visualization/mpv/, which allows for efficient integration and data retrieval. This API endpoint supports various functionalities, including the collection of DICOM images, metadata retrieval, and real-time updates. The interactive tools for zooming, panning, and navigating through different planes (axial, sagittal, and coronal) are seamlessly integrated through this API, enabling the precise examination of specific regions of interest. These capabilities ensure that clinicians can interact with the visualization data dynamically, facilitating real-time adjustments and increasing diagnostic accuracy. The robust architecture of the MPV module, combined with its API-driven approach, ensures that the visualization tools are both scalable and adaptable to different clinical requirements. This integration not only improves the efficiency of data handling and processing but also ensures that the visualization remains consistent and reliable across various use cases and devices. Thus, the MPV module, with its advanced interface and RESTful API support, significantly enhances the diagnostic process and treatment planning for PAD.
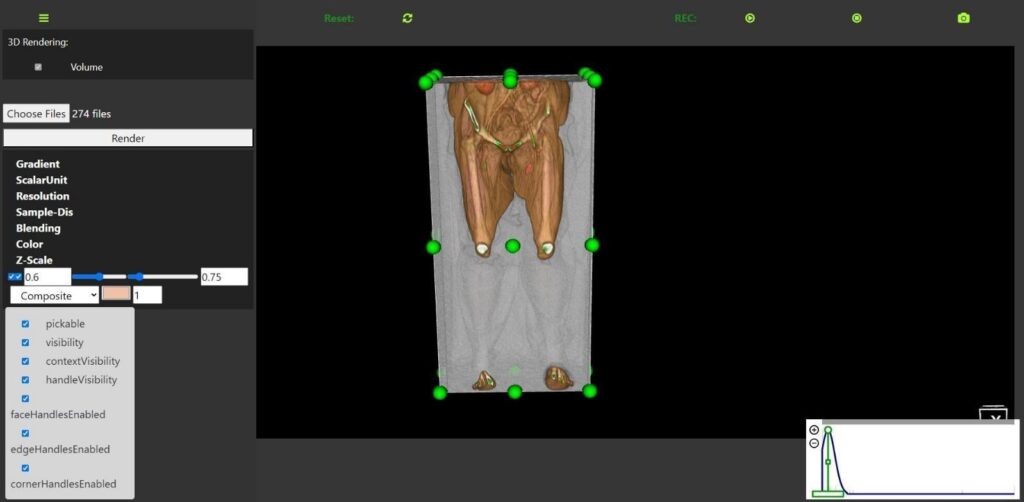
The 3D rendering module, accessible via the RESTful API endpoint/api/visualization/3d-rendering/, is a critical component of the DECODE cloud platform. This endpoint facilitates efficient data retrieval and interaction, enabling real-time updates and dynamic adjustments. Figure 7 shows the user interface for this module, highlighting its robust functionality and interactive features that significantly enhance the analysis and treatment planning
Table 1: Performance Metrics for Multiplanar Visualization Module and 3D Rendering Module in the DECODE Cloud Platform obtained by Google’s Lighthouse tool
Metrics (%) | Multiplanar Visualization Module | 3D Rendering Module |
Performance | 94 | 89 |
Accessibility | 90 | 90 |
Best Practices | 100 | 100 |
Search Engine Optimization | 100 | 90 |
for PAD. The user interface allows users to upload and render volumetric medical imaging data seamlessly. It includes a variety of controls for manipulating 3D visualization, such as gradient adjustment, scalar unit specification, resolution settings, and sample distance control. These controls enable users to tailor the rendering process to highlight specific anatomical features, facilitating a more precise examination of the imaging data.
Interactive features such as volume clipping, rotation, zooming, and panning are integrated into the interface, allowing users to explore the 3D models from various perspectives. The presence of checkboxes for enabling or disabling visibility, context visibility, handle visibility, and various handle controls (face, edge, corner) further enhances the flexibility and customization available to the user.
5.1. Evaluation of Visual Representation Modules
The performance metrics for the DECODE cloud platform’s MPV module and 3D rendering module are summarized in Table 1. These metrics provide a quantitative assessment of the platform’s capabilities across several key areas.
The MPV module demonstrated exceptional results, with a performance score 94%, indicating a highly responsive user experience. The module also scored 90% in accessibility, underscoring its commitment to inclusivity by meeting essential accessibility standards. In addition, the module achieved perfect scores (100%) in both best practices and SEO, reflecting its adherence to modern web development standards and its content’s discoverability via search engines.
The 3D rendering module also performed strongly, with a performance score 89%. While slightly lower than the MPV module, this score still indicates a high level of efficiency, particularly given the complex computations required for 3D rendering. The module matched the MPV module with an accessibility score 90% and perfect scores 100% in both best practices and SEO, confirming its robust design and compliance with industry standards.
6. Discussion
The DECODE cloud platform represents a significant breakthrough in the diagnosis, analysis, and treatment planning for PAD. Leveraging cutting-edge cloud computing and advanced data visualization technologies, the DECODE platform surpasses the capabilities of current state-of-the-art (SoTA) solutions. It is the first platform specifically designed to integrate high- performance data processing, 3D medical imaging, and computational modeling into a unified system tailored for PAD. This integration allows for precise simulation of treatment interventions, such as drug-coated balloons, and provides clinicians with real-time, data-driven insights to optimize therapeutic strategies. Compared with other cloud-based platforms, such as teleophthalmology systems [39] and the BioData Catalyst (BDC) [40], DECODE has demonstrated significant advancements in terms of functionality and adaptability. While tele-ophthalmology systems excel in scalable image storage and annotation and BDC specializes in managing large-scale genomic datasets, DECODE uniquely integrates segmentation, 3D visualization, and real-time analysis to address PAD-specific clinical workflows. Furthermore, it mitigates common challenges observed in cloud-based solutions, such as inefficient handling of large datasets, access control, and vendor conformity, by employing tailored optimization techniques and ensuring robust security, scalability, and compliance with healthcare standards.
The DECODE platform overcomes the limitations of the SoTA by integrating comprehensive data management and advanced visualization tools. The MPV module’s robust design and high performance underscore its effectiveness in medicine. The module’s ability to provide detailed 2D and 3D views of anatomical structures significantly enhances diagnostic and treatment planning. The 3D rendering module’s performance metrics also highlight its strengths in providing high-fidelity visualizations crucial for PAD treatment. The module’s slightly lower performance score than the MPV module can be attributed to the complex computations required for rendering detailed 3D models. However, its accessibility score and perfect scores in best practices and SEOs indicate that it remains an invaluable tool for clinicians.
While the performance metrics highlight the platform’s robustness, several limitations must be acknowledged. One notable challenge is scalability, as the platform’s current architecture may encounter bottlenecks when handling significantly larger datasets or accommodating simultaneous users over extended periods. Such scenarios could impact real-time processing and responsiveness, particularly in high-demand clinical settings. In addition, the reliance on high-performance GPUs and advanced cloud infrastructure poses a limitation, potentially restricting platform adoption in resource-constrained environments where access to such resources may be limited.
Future work will prioritize optimizing the platform architecture to increase scalability and explore cost- effective hardware alternatives, thereby ensuring broader accessibility and adoption in diverse healthcare settings. In addition, the planned development of a 3D segmentation and reconstruction module will focus on the precise delineation of anatomical structures, specifically targeting the segmentation of the peripheral artery with intima and adventitia thickness. This enhancement will enable detailed 3D reconstructions, improve the analysis of vascular health and support the personalization of treatment strategies. By accurately modeling these critical arterial layers, the module will provide clinicians with deeper insight into disease progression, plaque buildup, and potential treatment outcomes, ultimately contributing to more precise and effective clinical interventions. The integration of a virtual reality (VR) module will further enhance the platform by offering immersive visualization tools to improve spatial understanding of complex anatomical structures, supporting preoperative planning, educational applications, and patient engagement. Challenges such as ensuring hardware compatibility, optimizing real-time performance, and maintaining compliance with healthcare data standards will be actively addressed to maximize the impact of these innovations. These advancements position the DECODE platform as a versatile and comprehensive solution that not only surpasses existing SoTA solutions but also sets a new benchmark for cloud-based technologies in PAD diagnosis and management.
7. Conclusion
The DECODE cloud platform represents a transformative advancement in the diagnosis, analysis, and treatment of peripheral artery disease (PAD). By leveraging the capabilities of cloud computing and high- performance data visualization, the platform addresses the significant limitations of traditional diagnostic methods, offering a noninvasive, cost-effective, and scalable solution. The DECODE platform’s comprehensive modules, including a data warehouse and multiplanar reconstruction with 2D and 3D rendering visualization, enable detailed and interactive processing and presentation of medical imaging data. The evaluation metrics underscore the platform’s high performance and user accessibility. The multiplanar visualization module achieves a performance score 94, an accessibility score 90, and perfect scores 100 in best practices and search engine optimization (SEO). Similarly, the 3D rendering module scored 89 in performance, 90 in accessibility, and 100 in best practices and SEO, demonstrating the platform’s robust design and compliance with industry standards. Our work highlights the transformative potential of integrating cloud computing in medical diagnostics, paving the way for further research and development in this critical area of healthcare.
Conflict of Interest
The authors declare that they have no conflicts of interest.
Acknowledgment
This work has received funding from the European Union’s Horizon 2020 research and innovation program under the Marie Skłodowska-Curie grant agreement No 956470, as part of the DECODE project.
- M. M. S. Radwan, Sini Thomas, Sithara, “Environmental Factors and Peripheral Artery Disease,” in Environmental Factors in the Pathogenesis of Cardiovascular Diseases: Springer, 2024, 193-208.
- M. N. Søgaard, Peter Brønnum Eldrup, Nikolaj Behrendt, Christian-Alexander Nicolajsen, Chalotte W Lip, Gregory YH Skjøth, Flemming, European Journal of Vascular Endovascular Surgery, “Epidemiological trends and projections of incidence, prevalence, and disease related mortality associated with peripheral arterial disease: observations using nationwide Danish data,” vol. 66, no. 5, 662-669, 2023, doi: 10.1016/j.ejvs.2023.08.005.
- S. P. S. Cartland, Christopher P Bursill, Christina Passam, Freda Figtree, Gemma A Patel, Sanjay Loa, Jacky Golledge, Jonathan Robinson, David A Aitken, Sarah, International Journal of Molecular Sciences, “Sex, Endothelial Cell Functions, and Peripheral Artery Disease,” vol. 24, no. 24, 17439, 2023.
- S. Research, “Peripheral Artery Disease Market Growth, Trends and Forecast to 2031 ” 2024, doi: 10.3390/ijms242417439.
- R. U. M. Center, “Peripheral Vascular Disease (PVD), https://www.rush.edu/conditions/peripheral-vascular-disease-pvd# ” 2024
- J. D. Csore, Madeline Roy, Trisha L, Journal of Vascular Surgery Cases, Innovations Techniques, “Peripheral arterial disease treatment planning using noninvasive and invasive imaging methods,” vol. 9, no. 4, 101263, 2023, doi: 10.1016/j.jvscit.2023.101263.
- W. R. Abbaoui, Sara El Bhiri, Brahim Kharmoum, Nassim Ziti, Soumia, Informatics in Medicine Unlocked, “Towards revolutionizing precision healthcare: A systematic literature review of artificial intelligence methods in precision medicine,” 101475, 2024, doi: 10.1016/j.imu.2024.101475.
- G. G. Gabrani, Sunil Vyas, Sonali Arya, Pradeep, “Revolutionizing Healthcare: Impact of Artificial Intelligence in Disease Diagnosis, Treatment, and Patient Care,” in Handbook on Augmenting Telehealth Services: CRC Press, 2024, 17-31.
- K. K. Kavitha, C, “Cloud-Based Data Analytics for Healthcare 5.0,” in Pioneering Smart Healthcare 5.0 with IoT, Federated Learning, and Cloud Security: IGI Global, 2024, 44-56, doi: 10.4018/979-8-3693-2639-8.ch004.
- A. A. Shalan, Abubakar Habli, Ibrahim Tew, Garry Thompson, Andrew, “YORwalK: desiging a smartphone exercise application for people with intermittent claudication,” in Building Continents of Knowledge in Oceans of Data: The Future of Co-Created eHealth: IOS Press, 2018, 311-315, doi: 10.3233/978-1-61499-852-5-311.
- K. S. Paldán, Jan Ullrich, Greta Steinmetz, Martin Rammos, Christos Jánosi, Rolf Alexander Moebus, Susanne Rassaf, Tienush Lortz, Julia, JMIR research protocols, “Feasibility and clinical relevance of a mobile intervention using TrackPAD to support supervised exercise therapy in patients with peripheral arterial disease: study protocol for a randomized controlled pilot trial,” vol. 8, no. 6, e13651, 2019.
- A. V. Harzand, Alexander A Alrohaibani, Alaaeddin Abdelhamid, Smah M Gordon, Neil F Thiel, John Benarroch‐Gampel, Jaime Teodorescu, Victoria J Minton, Keri Wenger, Nanette K, Clinical Cardiology, “Rationale and design of a smartphone‐enabled, home‐based exercise program in patients with symptomatic peripheral arterial disease: the smart step randomized trial,” vol. 43, no. 6, 37-545, 2020, doi: 10.1002/clc.23362.
- J. S. Lortz, Jan Kuether, Tabea Kreitschmann-Andermahr, Ilonka Ullrich, Greta Steinmetz, Martin Rammos, Christos Jánosi, Rolf Alexander Moebus, Susanne Rassaf, Tienush, JMIR Formative Research, “Needs and requirements in the designing of mobile interventions for patients with peripheral arterial disease: questionnaire study,” vol. 4, no. 8, e15669, 2020.
- H. P. Paredes, Dennis Barroso, João Abrantes, Catarina Machado, Isabel Silva, Ivone, “Supervised physical exercise therapy of peripheral artery disease patients: M-health challenges and opportunities,” 2021, http://hdl.handle.net/10125/71086.
- A. M. D. Flores, Falen Leeper, Nicholas J Ross, Elsie Gyang, Circulation research, “Leveraging machine learning and artificial intelligence to improve peripheral artery disease detection, treatment, and outcomes,” vol. 128, no. 12, 1833-1850, 2021, doi: 10.1161/CIRCRESAHA.121.31822.
- N. M. Forghani, Keivan Dabanloo, Nader Jafarnia Farahani, Ali Vasheghani Forouzanfar, Mohamad, IEEE Journal of Biomedical Health Informatics, “Intelligent oscillometric system for automatic detection of peripheral arterial disease,” vol. 25, no. 8, 3209-3218, 2021, doi: 10.1109/JBHI.2021.3065379.
- T. G. Collins, Mugur Overton, Kathryn Benton, Mary Lu, Liuqiang Khan, Faarina Rohleder, Mason Ahluwalia, Jasjit Resnicow, Ken Zhu, Yiliang, JMIR Formative Research, “Use of a smartphone app versus motivational interviewing to increase walking distance and weight loss in overweight/obese adults with peripheral artery disease: pilot randomized trial,” vol. 6, no. 2, e30295, 2022.
- M. K. Kim, Yesol Choi, Mona, BMC Medical Informatics Decision Making, “Mobile health platform based on user-centered design to promote exercise for patients with peripheral artery disease,” vol. 22, no. 1, 206, 2022, doi: 10.1186/s12911-022-01945-z.
- F.-Q. D. Wu, Qian-Wan Wang, Ji-Guang Li, Wen-Zhu, Current Treatment Options in Cardiovascular Medicine, “The Role of Supervised Exercise Therapy in the Management of Symptomatic Peripheral Artery Disease with Intermittent Claudication,” vol. 25, no. 10, 501-513, 2023, doi: 10.1007/s11936-023-01001-7.
- J. I. Zaki, SM Riazul Alghamdi, Norah Saleh Abdullah-Al-Wadud, Mohammad Kwak, Kyung-Sup, IEEE Access, “Introducing cloud-assisted micro-service-based software development framework for healthcare systems,” vol. 10, 33332-33348, 2022, doi: 10.1109/ACCESS.2022.3161455.
- D. O. Alekseeva, Aleksandr Arponen, Otso Lohan, Elena Simona, Computer Science Review, “The future of computing paradigms for medical and emergency applications,” vol. 45, p. 100494, 2022, doi: 10.1016/j.cosrev.2022.100494.
- M.-A. B. Filz, Jan Philipp Herrmann, Christoph, Journal of Intelligent Manufacturing, “Digitalization platform for data-driven quality management in multi-stage manufacturing systems,” vol. 35, no. 6, 2699-2718, 2024, doi: 10.1007/s10845-023-02162-9.
- AboArab, Mohammed A., Vassiliki T. Potsika, Nikola Petrović, and Dimitrios I. Fotiadis, “DECODE cloud platform: A new cloud platform to combat the burden of peripheral artery disease,” in 2022 Panhellenic Conference on Electronics & Telecommunications (PACET), 2022, 1-6: IEEE, doi: 10.1109/PACET56979.2022.9976356.
- Z. A. K. Mughal, Adnan Ahmed, Syed Sohail Qazi, Salman, Journal of Software Engineering, “Key factors and features analysis of popular SaaS ERP Systems for Adoptability,” vol. 1, no. 1, 11-21, 2022.
- D. C. L. De Oliveira, Ji Pacitti, Esther, Data-Intensive Workflow Management. Springer Nature, 2022.
- R. K. Fauzan, Ice Nurwibowo, Bima Dinda Wibowo, Della Aulia, IPTEK The Journal for Technology Science, “A systematic literature review on progressive web application practice and challenges,” vol. 33, no. 1, 43-58, 2022, doi: 10.12962/j20882033.v33i1.13904.
- D. V. Hesmondhalgh, Raquel Campos Kaye, D Bondy Valdovinos Li, Zhongwei, Media Communication, “Digital platforms and infrastructure in the realm of culture,” vol. 11, no. 2, 296-306, 2023, doi: 10.17645/mac.v11i2.6422.
- A. G. Blum, R Rauch, A Urbaneja, A Biouichi, H Dodin, G Germain, E Lombard, C Jaquet, P Louis, M, Diagnostic interventional imaging, “3D reconstructions, 4D imaging and postprocessing with CT in musculoskeletal disorders: past, present and future,” vol. 101, no. 11, 693-705, 2020, doi: 10.1016/j.diii.2020.09.008.
- M. T. Thakkar, Mohit, Building React Apps with Server-Side Rendering: Use React, Redux, Next to Build Full Server-Side Rendering Applications, “Introducing react. js,” 41-91, 2020.
- E. U. Ziegler, Trinity Brown, Danny Petts, James Pieper, Steve D Lewis, Rob Hafey, Chris Harris, Gordon J, JCO clinical cancer informatics, “Open health imaging foundation viewer: an extensible open-source framework for building web-based imaging applications to support cancer research,” vol. 4, 336-345, 2020, doi: 10.1200/CCI.19.00131.
- F. V. Paligu, Cihan, Future Internet, “Browser Forensic Investigations of Instagram Utilizing IndexedDB Persistent Storage,” vol. 14, no. 6, p. 188, 2022, doi: 10.3390/fi14060188.
- J. K. Udupa, “3D imaging: principles and approaches,” in 3D Imaging in Medicine, Second Edition: CRC Press, 2023, 1-73.
- R. L. T. Cieri, Morgan L Carney, Ryan M Falkingham, Peter L Kirk, Alexander M Wang, Tobias Jensen, Bjarke Novotny, Johannes Tveite, Joshua Gatesy, Stephen M, Journal of morphology, “Virtual and augmented reality: New tools for visualizing, analyzing, and communicating complex morphology,” vol. 282, no. 12, 1785-1800, 2021, doi: 10.1002/jmor.21421.
- P. J. Thakur, Prashant, “Django: Developing web using Python,” in 2023 3rd International Conference on Advance Computing and Innovative Technologies in Engineering (ICACITE), 2023, pp. 303-306: IEEE, doi: 10.1109/ICACITE57410.2023.10183246.
- Kitware, Inc. (2024). VTK.js. Accessed July 2024. https://kitware.github.io/vtk-js, doi: 10.5281/zenodo.4552412, 2021.
- S. J. Matt McCormick, Forrest Li, Alexis Girault, David Thompson, Juan Carlos Prieto, Scott Wittenburg, & HastingsGreer. (2021). InsightSoftwareConsortium/itk-js: v14.1.1 (v14.1.1), doi: 10.5281/zenodo.4957207.
- R. JohnsonChris, Health Data Science, “A review of three-dimensional medical image visualization,” 2022, doi: 10.34133/2022/9840519.
- M. P. Manca, Vanessa Paternò, Fabio Santoro, Carmen, ACM Transactions on Accessible Computing, “The transparency of automatic web accessibility evaluation tools: design criteria, state of the art, and user perception,” vol. 16, no. 1, 1-36, 2023, doi: 10.1145/3556979.
- Schweitzer, M., Ostheimer, P., Lins, A., Romano, V., Steger, B., Baumgarten, D., & Augustin, M. (2024). Transforming Tele-Ophthalmology: Utilizing Cloud Computing for Remote Eye Care. In dHealth 2024 (pp. 215-220). IOS Press, doi: 10.3233/SHTI240040.
- Ahalt, S., Avillach, P., Boyles, R., Bradford, K., Cox, S., Davis-Dusenbery, B., … & Asare, J. (2023). Building a collaborative cloud platform to accelerate heart, lung, blood, and sleep research. Journal of the American Medical Informatics Association, 30(7), 1293-1300, doi: 10.1093/jamia/ocad048.
No related articles were found.