Enhancing Breast Cancer Detection through a Hybrid Approach of PCA and 1D CNN

(This article belongs to the Special Issue on SP7 (Special Issue on Multidisciplinary Sciences and Advanced Technology (SI-MSAT 2025)) and the Section Artificial Intelligence – Computer Science (AIC))
Export Citations
Cite
Aymaz, S. (2025). Enhancing Breast Cancer Detection through a Hybrid Approach of PCA and 1D CNN. Journal of Engineering Research and Sciences, 4(4), 20–30. https://doi.org/10.55708/js0404003
Samet Aymaz. "Enhancing Breast Cancer Detection through a Hybrid Approach of PCA and 1D CNN." Journal of Engineering Research and Sciences 4, no. 4 (April 2025): 20–30. https://doi.org/10.55708/js0404003
S. Aymaz, "Enhancing Breast Cancer Detection through a Hybrid Approach of PCA and 1D CNN," Journal of Engineering Research and Sciences, vol. 4, no. 4, pp. 20–30, Apr. 2025, doi: 10.55708/js0404003.
Breast cancer is a prevalent disease, particularly among women. Unlike many other cancers, early diagnosis and treatment can significantly improve patients’ quality of life. This study develops a hybrid approach for breast cancer detection using the Wisconsin datasets by combining Principal Component Analysis (PCA) and 1D Convolutional Neural Network (CNN) architectures to effectively separate and classify data. Our novel approach leverages PCA not merely for dimensionality reduction but to transform the feature space to maximize separation between benign and malignant samples, which is then processed by a custom-designed CNN architecture with optimized hyperparameters. While PCA elevates the data representation by highlighting important features, the 1D CNN contributes to the classification process through automatic feature extraction. This approach aims to achieve high accuracy and reliability in the critical domain of breast cancer detection. Experimental results demonstrate that our developed approach exhibits superior performance compared to existing methods. Our hybrid PCA-1D CNN model achieved an accuracy of 99.12%, precision of 100%, sensitivity of 98.61%, specificity of 100%, and F1-score of 99.30%, significantly outperforming 14 different benchmark techniques from the literature. The model’s accuracy and reliability are enhanced through K-fold cross-validation. The findings of this study can guide researchers seeking to improve breast cancer diagnostic accuracy and support more reliable healthcare decisions. The combination of deep learning and traditional feature extraction represents a promising advancement toward more effective and sensitive diagnostics in the healthcare industry.
1. Introduction
According to the 2020 World Health Organization (WHO) data, approximately 2.2 million women worldwide are diagnosed with breast cancer yearly. This statistic accounts for about 25% of all cancer diagnoses. Breast cancer is the most common type of cancer in women, with 1 in 11 women at risk of developing breast cancer in their lifetime. Most breast cancer deaths occur because the disease is not diagnosed and treated early. According to WHO data, approximately 685,000 women die from breast cancer yearly. This mortality accounts for about 15% of all cancer deaths [1,2].
Computer-assisted breast cancer detection (CAD) is a method that aims to detect breast cancer masses by analyzing mammography images [3]. CAD systems can help radiologists identify breast cancer masses more quickly and accurately. The development of CAD systems began in the 1990s. Early CAD systems used simple techniques to analyze mammography images. However, the accuracy of these systems was limited. In recent years, accuracy rates have increased significantly with the integration of artificial intelligence (AI) technology in CAD systems. AI-based CAD systems can analyze patterns in mammography images more comprehensively, resulting in more accurate results. CAD systems [4] play an essential role in breast cancer diagnosis. These systems can contribute to increased survival rates of breast cancer patients by helping radiologists detect breast cancer masses more quickly and accurately.
Despite these advances, current breast cancer detection methods face significant challenges in achieving both high accuracy and computational efficiency. Traditional machine learning approaches often struggle with the high dimensionality and complex feature relationships in medical datasets, while deep learning methods may require large amounts of data and computational resources to perform optimally. Additionally, the potential overlap between benign and malignant feature spaces creates classification difficulties that remain incompletely addressed by existing methodologies. This study addresses these challenges by proposing a novel hybrid approach that combines PCA and 1D CNN methods for detecting breast cancer using the Wisconsin data set. Our key contribution is the development of an optimized framework that leverages PCA not merely for dimensionality reduction but to strategically transform the feature space to maximize class separation before feeding the transformed data into a carefully designed CNN architecture. The Wisconsin dataset, consisting of 569 samples with 30 features each categorized as benign or malignant, serves as our experimental platform.
The proposed method aims to enhance breast cancer classification accuracy while maintaining computational efficiency. First, the PCA method transforms data to a new plane to facilitate the separation of benign and malignant samples. In this plane, the most essential features of each sample are emphasized, optimizing feature representation. The data transferred to a new and more easily decomposable plane with PCA is classified with the 1D CNN developed within the scope of this study. The CNN structure is uniquely designed, and its parameters are optimized using the Grid Search approach. In addition, model overfitting is minimized by using k-fold cross-validation in the training process, ensuring more accurate performance measurement and improved model performance. Our approach differs from existing methods by specifically optimizing the complementary strengths of dimensionality reduction and deep learning, achieving superior classification metrics while maintaining model interpretability. In summary, combining PCA and CNN in our hybrid approach helps extract essential features by effectively processing high-dimensional data in breast cancer detection. It provides more precise and reliable results thanks to the algorithm’s ability to recognize patterns highlighted by deep learning algorithms.
2. Related Works
Data mining methods used in various medical applications have great potential in essential areas such as early diagnosis and effective treatment of diseases. In this context, detection of breast cancer is also a vital issue. Breast cancer is the most common cancer in women worldwide and can improve the chances of cure if detected early. The Wisconsin breast cancer dataset (WDBC) is a frequently used data source for diagnosing breast cancer by combining medical imaging and feature extraction techniques. In this context, various studies use the Wisconsin breast cancer dataset in the literature. These studies investigate how data mining algorithms and deep learning techniques can contribute to making precise and reliable diagnoses by extracting features from this data set. This section will review related studies using the Wisconsin breast cancer dataset.
The Wisconsin dataset has been extensively studied in the field of breast cancer prediction. Several research papers have compared different machine learning algorithms using this dataset to determine the most effective method for predicting breast cancer. In [5], a performance evaluation of machine learning methods for breast cancer prediction was conducted. Five different classification models were compared, including Decision Tree (DT), Random Forest (RF), Support Vector Machine (SVM), Neural Network (NN), and Logistic Regression (LR), using the WBCD. The comparative experiment analysis showed that the random forest model achieved better performance and adaptation than the other four methods. In addition to machine learning algorithms, data visualization techniques have been applied to the Wisconsin dataset. In [6], Principal Component Analysis (PCA) for feature space reduction was discussed and the performance of different models using the Wisconsin Breast Cancer Database was evaluated. Using the Wisconsin Breast Cancer dataset, in [7], various machine learning algorithms were compared, including XGBoost, K-NN, Naïve Bayes (NB), SVM, and DT. It was found that XGBoost achieved the highest accuracy, recall, precision, F1-score, and AUC, making it the most effective method for predicting breast cancer.
Deep learning techniques have also been applied to breast cancer prediction. In [8], a deep-learning breast cancer prediction framework (DLBCPF) was proposed. The framework was tested on four different Wisconsin Breast Cancer datasets, and the results demonstrated the superiority of DLBCPF and the optimizer MDGCO compared to other methods. Feature selection techniques have also been applied to the Wisconsin dataset to improve the accuracy of breast cancer prediction. In [9], a comprehensive analysis of machine learning classification algorithms with and without feature selection was presented. It was found that feature selection improved the performance of the classifiers, including Logistic Regression, Linear Support Vector Machine, and Quadratic Support Vector Machine.
In another study, an ensemble learning approach was proposed to detect breast cancer automatically. In [10], support vector machine (SVM), regression, and random forest models were combined using a majority-weighted voting system. The results showed improved accuracy, precision, recall, and F-score compared to individual models. Furthermore, the use of fuzzy inference systems has been explored for categorizing the Wisconsin breast cancer dataset. In [11], fuzzy inference systems with different input features were developed and achieved superior precision compared to other works in the literature. Other studies have also focused on specific aspects of breast cancer prediction using the WBCD. In [12], a modified categorical data fuzzy clustering algorithm on the WBCD was evaluated. In [13], dimensionality reduction using principal component analysis in supervised machine learning techniques was explored. In [14], the success of different machine-learning methods in breast cancer diagnosis was investigated. In [15], supervised machine-learning techniques for breast cancer prediction were leveraged. In [16], diverse classifier algorithms on the WBCD were evaluated.
Recent research has shown significant advancements in breast cancer classification through hybrid models and dimensionality reduction techniques. In [17], different missing data imputation methods combined with PCA on the WBCD dataset were evaluated, finding that median imputation with PCA-based reduction achieved the best performance, with SVM and k-NN algorithms reaching impressive success rates of 97.14% and 98.57% respectively. In [18], a comprehensive comparison of machine learning classifiers with various dimensionality reduction techniques across multiple breast cancer datasets was conducted, demonstrating that SVM with Factor Analysis achieved 98.64% accuracy on the WBC dataset, while MLP without dimensionality reduction performed best on WDBC with 98.26% accuracy. In [19], an innovative dimensionality reduction model integrating PCA with KNN specifically for early breast cancer detection was proposed, addressing challenges like computational complexity and overfitting by selecting optimal features that capture maximum variance. In [20], a robust hybrid multilayer deep learning approach combining UNet for feature extraction, SegNet for segmentation, and MLP with Grey Wolf Optimization for classification was presented, achieving superior performance compared to traditional methods. In [21], novel feature selection strategies utilizing metaheuristic algorithms (GSA, EPO, and hybrid hGSAEPO) for breast cancer classification were introduced, reaching remarkable results with 98.31% accuracy and AUC exceeding 0.998. Additionally, in [22], the BCR-HDL framework that ingeniously combines multiple deep learning architectures (MLP, VGG, ResNet, Xception) with traditional machine learning models was developed to enhance both accuracy and interpretability in breast cancer recurrence prediction, with the hybrid MLP+RF and Xception+RF models achieving 97% diagnostic accuracy on the WDBC dataset.
These studies demonstrate the extensive research conducted on the Wisconsin dataset for breast cancer prediction. Different machine learning algorithms, feature selection techniques, and fuzzy inference systems have been explored to improve the accuracy and precision of breast cancer prediction using this dataset.
3. Materials and Methods
In this study, a hybrid approach is created to detect breast cancer using the Wisconsin data set. This approach is created by the PCA and CNN architectures complementing each other. It is vital that the data can be easily separated in the detection of breast cancer. Data belonging to different classes may be nested. This situation prevents the classifiers from making the correct classification. Therefore, the PCA method moves each sample in the Wisconsin dataset to a new plane. This plane is where vital features are emphasized, and unimportant ones are suppressed. Therefore, it facilitates the parsing of data. The samples moved to the new plane are classified using the 1D CNN structure created as the basis of the problem. CNN decides which class a feature belongs to by automatically identifying patterns in 1-dimensional feature vectors. The automatic recognition of features and the ability to classify with high accuracy are why deep learning approaches are preferred. In addition, k-fold cross-validation is used to increase the accuracy and reliability of the classification model created using the CNN structure. Details of all the approaches used will be given in the subsections.
3.1. The Details of the Wisconsin Dataset
The WDBC [23] dataset is an important data source for breast cancer diagnosis. This dataset contains biomedical data containing characteristics of breast cancer cells. In the WDBC dataset, which includes 569 samples, each consists of 30 features. In the data set, 212 samples are malignant, while 357 are benign. This balance is essential for training and evaluating the classification models of the data set. Features in the dataset include various clinical features such as dimensions of the cell nucleus, nucleus cell circumference, and cell tissue context. Each sample is divided into two classes representing cancer cells (malignant) or non-cancerous cells (benign). The WDBC dataset is a widely used resource for developing models and algorithms used in diagnosing and treating breast cancer. This dataset plays a vital role in advances in breast cancer diagnosis while providing the basis for various analyses and studies in data mining, machine learning, and deep learning.
3.1.1. Data Preprocessing Protocol
Before applying our hybrid model, we performed several critical preprocessing steps to ensure optimal performance:
- Data Inspection and Cleaning: We first examined the Wisconsin dataset for missing or inconsistent values. Our examination confirmed that the dataset was complete with no missing values or data inconsistencies.
- Outlier Analysis: We conducted statistical analysis to identify potential outliers using the interquartile range (IQR) method. Features with values falling outside were flagged for further inspection. After careful analysis, we determined that these extreme values represented genuine physiological variations rather than measurement errors and therefore retained them.
- Feature Scaling: To prepare the data for PCA application, all 30 features were standardized to have zero mean and unit variance using Eq. 1. $$X_{\text{standardized}} = \frac{X – \mu}{\sigma} \tag{1}$$
In Eq. 1, X is the original feature value, μ is the mean, and σ is the standard deviation of that feature. This standardization step is critical before applying PCA to ensure that features with naturally larger scales do not dominate the variance analysis.
- Cross-Validation Implementation: Instead of using a single train-test split, we implemented k-fold cross-validation (k=5) to ensure robust model evaluation. The dataset was divided into 5 equally sized folds with stratified sampling to maintain the same proportion of benign and malignant samples in each fold. During each iteration, 4 folds were used for training while the remaining fold served as the validation set. This process was repeated 5 times, with each fold serving once as the validation set, ensuring that every sample in the dataset was used for both training and validation.
3.2. The Standardization of Data with PCA
PCA [24-26] transforms the original properties of a dataset into new, fewer principal components, making data easier to understand and analyze. With PCA, the dataset is rearranged along directions that best represent variations of its original features. This situation may reveal more distinct differences between benign and malignant masses.
The following steps are followed when moving feature vectors to a new plane with PCA:
- The data set is averaged. This situation means centralizing data. Centralization provides a better understanding of the distribution of data.
- The dataset is standardized to its original characteristics. This situation ensures that the variations of the data are the same. Standardization makes it easier to compare data.
- The covariance matrix of the data set is calculated. The covariance matrix measures the relationship of features to each other.
- The eigenvalues and eigenvectors of the covariance matrix are calculated. Eigenvalues measure the magnitude of variation in data. Eigenvectors represent aspects that best represent the variations of the data.
- The dataset is rescaled according to its eigenvectors. This situation allows data to be reorganized along the new principal components.
When feature vectors are moved to a new plane with PCA, the following can occur: Some features may be more represented in new principal components. Some features may be less represented in new core components. Some features may not be fully represented in the new core components. It can be said that PCA helps to determine which features are more important. The new principal components represent the features with the most information in the dataset. PCA is a technique used to classify breast cancer masses. When data are moved to a new plane with PCA, more distinct differences between benign and malignant groups may emerge. This situation can help classification models produce more accurate results.
We conducted a comprehensive analysis to determine the optimal number of principal components to retain in our model. After applying PCA to the Wisconsin dataset’s 30 features, we examined the explained variance ratio to identify the information contribution of each principal component. Our analysis revealed that retaining 10 principal components preserved approximately 95.8% of the variance in the original data while significantly reducing the dimensionality by two-thirds. This threshold was selected based on the observed elbow point in the cumulative explained variance curve, where additional components beyond this point contributed minimally to the total variance explained. We further validated this selection by comparing model performance with different numbers of components (5, 10, 15, 20, and all 30). While using all 30 components retained 100% of the variance, it did not translate to better classification performance. The optimal balance between dimensionality reduction and information preservation was achieved with 10 components, which provided both computational efficiency and maximized the separation between benign and malignant classes.
3.3. Classification of Data with the Created 1D CNN Architecture
The 1D CNN [27-30] architecture is an important deep learning tool that offers an efficient and powerful classification capability on feature vectors. Compared to traditional classification methods, 1D CNN can automatically identify temporal or spatial patterns of data. This situation means the ability of feature vectors to discover and represent the hidden features they contain. In complex problems such as breast cancer detection, features can often change at different scales and time intervals. By learning such features hierarchically, 1D CNN can improve accuracy in the classification process. It can also make the data mining process more efficient by reducing the need for manual feature engineering. In this way, it can play an essential role in early detection and more effective treatment interventions, providing higher sensitivity and Specificity in important health diagnoses such as breast cancer.
In this study, a unique CNN architecture is designed that can classify samples from the Wisconsin dataset as benign or malignant. CNN architecture consists of input, convolution, activation, dropout, fully connected, and classification layers. The input layer is a feature vector of size 30×1, as each sample in the Wisconsin dataset has 30 features. This vector taken from the input layer is given as input to the convolution layer. This layer helps to capture basic patterns. Generally, this layer has two critical hyperparameters: the kernel size and the number of filters. In the first layer, 3 is the kernel size, and 6 is the filter amount. These hyperparameters are detected using the Grid search approach. The grid search approach tries to find the best performance by trying values within a specific range to determine the hyperparameter settings. This method is used to explore different combinations of hyperparameters extensively. Its advantages are that it helps to achieve the best results by systematically searching a wide range of hyperparameters. The output of the first convolution layer is given as the input to the activation layer. The relu activation layer is used in this study. The Rectified Linear Activation (ReLU) is a widely used activation function in deep learning models. It provides faster and more stable learning in the education process, especially according to the sigmoid and tanh functions. The activation layer output is given as input to the dropout layer.
The dropout layer is used to reduce overfitting in deep learning networks. This layer temporarily turns off randomly selected neurons during training, allowing the network to explore different learning paths and increasing its generalization ability. The value for the Dropout layer is taken as 0.2. Then, this layer output is given to a convolution layer again. The second convolution layer increases the method’s success by allowing more complex patterns to be recognized automatically. The parameters of this layer are determined by kernel size as 3 and the number of filters as 256 after the Grid search approach. Again, this layer output is passed through the activation and dropout layers and is given as input to the fully connected layer. Two fully connected layers are used in succession in the network structure created. The use of cascading fully connected layers is essential in enhancing deep learning models’ feature extraction and classification capabilities. It has the advantage of better classification, learning of complex data, capturing nonlinear relationships and flexibility. The first fully connected layer has 100 outputs, while the second fully connected layer has as many outputs as the number of classes. The production of these layers is given to the classification layer, and the classification process is terminated. Details of the created network are shown in Table 1.
Table 1: Architecture and Parameters of the Proposed 1D CNN Model
Layers | Parameters |
Input Layer | Feature Vector Size (30×1) |
Convolution Layer1 | Kernel Size=3, Amount of filter=6 |
Activation Layer | Relu |
Dropout Layer | 0.2 |
Convolution Layer2 | Kernel Size=3, Amount of filter=256 |
Activation Layer | Relu |
Dropout Layer | 0.2 |
fully Connected Layer1 | Output Size=100 |
fully Connected Layer2 | Output Size=Number of Classes |
Classification Layer |
The most critical issues in the CNN structure are the determination of hyperparameters and the prevention of overfitting. Overfitting can cause the model to become oversensitive to noise or random fluctuations in the data. In this study, memorization is prevented by using L2Regularization and dropout. Both methods provide resistance to overfitting. L2 regularization helps balance the model weights, while dropout prevents the model from becoming dependent on different features. These techniques can help to obtain more generalized and balanced models. The determination of hyperparameters is another essential point. This study uses the Grid search approach while determining the hyperparameters. Grid search provides a guide to get the best performance of the model by comparing different hyperparameter values. In addition, the training of the model is also crucial. K-fold cross-validation is used for training the model. Thus, a model is created whose success can be better validated. The hyperparameters determined after the grid search approach are given in Table 2.
Table 2: Optimized Hyperparameters for the 1D CNN Model
Hyperparameters | Values |
k-fold | 5 |
Optimizer | Adam |
Initial Learn Rate | 0.001 |
Max Epochs | 30 |
Minimum Batch Size | 6 |
4. Evaluation Results
This study proposes an effective combination of PCA and generated 1D CNN structure. This approach is tested on the Wisconsin dataset. The Wisconsin dataset is essential for breast cancer and provides examples of two different classes, benign and malignant. The approach created is designed to classify these examples. Evaluations are made using Accuracy, Precision, Sensitivity, Specificity, and F-Score [31] metrics from the confusion matrix. These metrics clearly demonstrate the extent to which the approaches can be used in healthcare. In addition, during the evaluations, the scenarios in which the 1D CNN structure is combined with PCA and alone are evaluated separately to determine the contribution of PCA to the hybrid approach. This situation more clearly reveals the advantages that PCA brings to the system and why the hybrid model may be preferred. This study contributes to developing more effective diagnostic methods in the medical field by showing how a powerful and innovative approach can be designed to diagnose breast cancer.
First, the results of the evaluations made with the Accuracy metric are given. This metric is calculated using Eq. 2.
$$Accuracy = \frac{TP + TN}{TP + TN + FP + FN} \tag{2}$$
In Eq. 2, True Positive (TP) represents cases where the model correctly identified malignant tumors as malignant. True Negative (TN) represents cases where the model correctly identified benign tumors as benign. False Positive (FP) represents cases where the model incorrectly classified benign tumors as malignant (Type I error). False Negative (FN) represents cases where the model incorrectly classified malignant tumors as benign (Type II error).
The Accuracy metric is frequently used to evaluate model performance in critical medical applications such as breast cancer diagnosis. This metric shows how well the model captures accurate results overall by representing the ratio of true positives and true negatives to total data points. In breast cancer diagnosis, a high Accuracy value indicates that the model effectively correctly classifies benign and malignant cases. Figure 1 includes the created approach, the situation when PCA is not used, and its comparison with 14 different methods [32-37] in the literature. The compared techniques consist of classical classifiers and strategies based on deep learning. The disadvantage of these approaches is that although their computational load is high, their accuracy is insufficient. When the Figure 1 is examined, it is seen that the proposed method gives better results than the approaches in the literature. In the health field, the proposed method should be evaluated from this perspective since the slightest improvement in diagnosis corresponds to a human life. As can be seen from Figure 1, the created approach formed with 99.12% gives the best result.
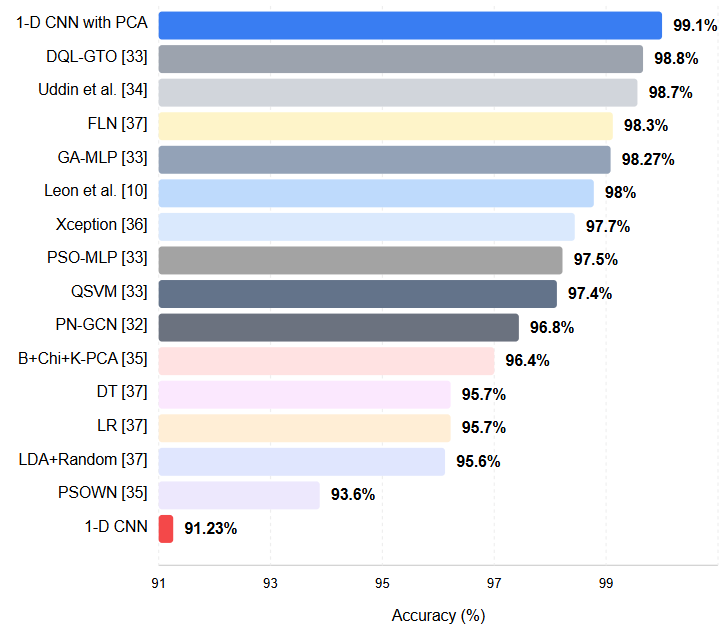
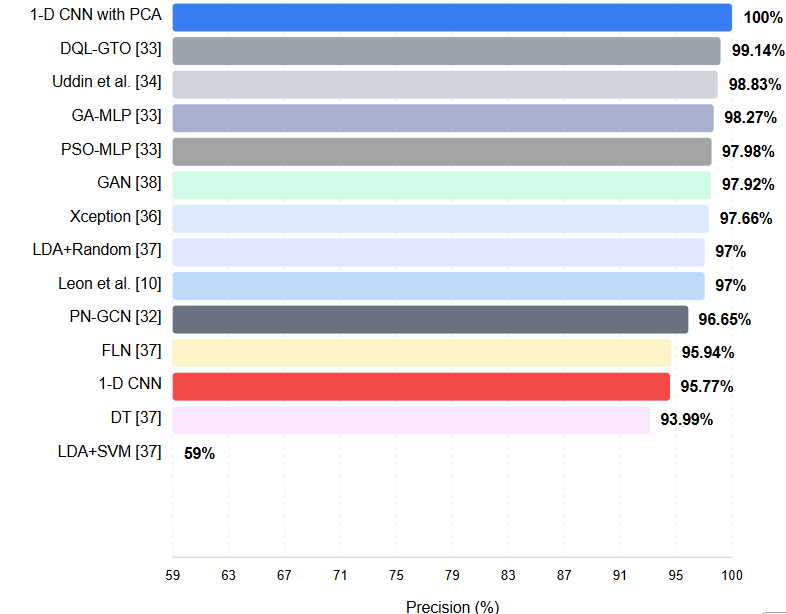
Figure 2 includes the approach created according to the precision metric and the results of 12 different methods in the literature. The precision metric is a crucial evaluation criterion in classification problems. This metric is calculated using Eq. 3.
$$Precision = \frac{TP}{TP + FP} \tag{3}$$
Precision refers to the proportion of genuinely positive samples among samples classified as positive. That is, it shows how accurately a model can produce positive results. The high precision we obtained in our method indicates that the cases where the samples that our model classifies as positive are indeed positive are highly accurate. This situation means our method can produce reliable and precise results in healthcare applications. A high precision value indicates that the model minimizes false positive results and gives only reliable positive results. This feature highlights that our method can be a valuable and reliable tool in areas such as clinical diagnostics. As can be seen from the Figure 2, it is seen that the approach created with 100% gives the best results. The proposed method has been compared with 12 different methods [10, 32-34, 36-38] and the results are presented in the Figure 2.
Sensitivity and Specificity are critical metrics in evaluating medical diagnoses and classification problems. These metrics help us better understand the performance of the classification model. The calculation of these metrics are given in Eq. 4 and 5.
$$Sensitivity = \frac{TP}{TP + FN} \tag{4}$$
$$Specificity = \frac{TN}{TN + FP} \tag{5}$$
Sensitivity is of great importance in conditions such as disease diagnosis. A high sensitivity value indicates a high rate of accurate positive results and that most individuals with the disease are correctly identified. This situation is critical for early diagnosis of the disease and initiation of treatment. Specificity is significant where accurate detection of negative results is required. For example, Specificity plays a substantial role in identifying healthy individuals or in situations where we want to minimize the risk of false alarms. The high sensitivity value of our method shows that we can achieve accurate positive results at a high rate. Therefore, we can diagnose diseases correctly, while the high specificity value emphasizes that we do not incorrectly classify healthy individuals as diseased by minimizing false positive results. These features indicate that our method is reliable for diagnosing disease and accurately classifying healthy individuals. Table 3 gives the results of the approach created and the approaches in the literature. As can be seen from the table, it is seen that the system designed with 98.61% for sensitivity and 100% for Specificity gives the best results compared with 4 different methods [35, 38-40].
Table 3: Architecture and Parameters of the Proposed 1D CNN Model
Methods | Metrics | |
Sensitivity (%) | Specificity (%) | |
B+Chi+K-PCA [35] | 97,72 | 94,23 |
GAN [38] | 93,62 | 94,52 |
LDA+Random [40] | 95,6 | 95,7 |
Ed-daudy et al. [39] | X | 97,93 |
1d CNN | 92,31 | 93,15 |
1d CNN with PCA | 98,61 | 100 |
F-score (F1-score) is a vital evaluation metric that offers a balanced performance measure by combining precision and recall metrics. This metric is calculated using Eq. 6.
$$F1\!-\!Score = 2 \times \frac{Precision \times Sensitivity}{Precision + Sensitivity} \tag{6}$$
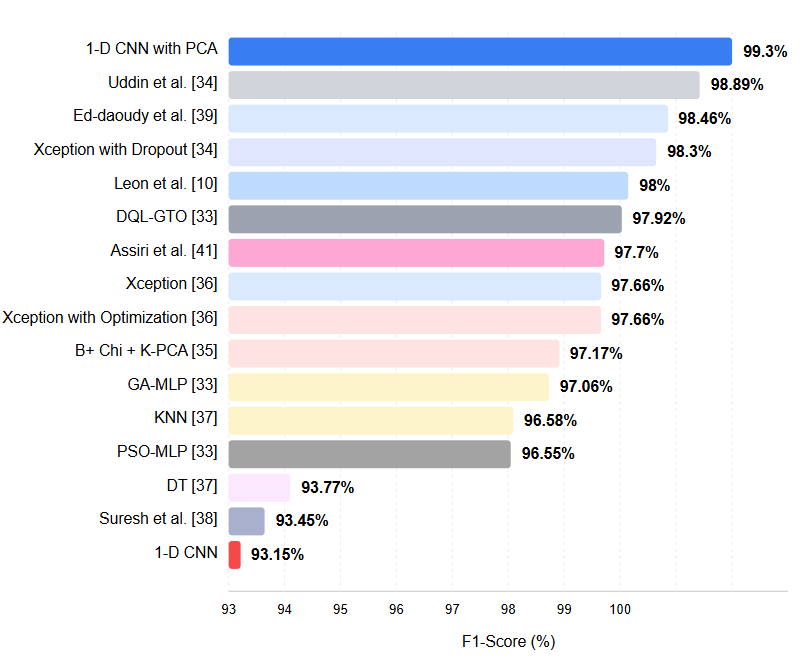
The F-score shows how the classification model performs, considering false positives and negatives. High F1-score values indicate the method performs well on precision and recall metrics, while low F1-score values indicate low on one or both. In this context, the fact that your practice has a high F1 score highlights that it can both produce precise results and achieve significant, accurate, positive results. The method we have developed can positively impact the field of health. High classification accuracy and reliable results can provide valuable support to healthcare professionals for critical decisions such as disease diagnosis and management of patients. This situation makes diagnosing patients earlier, implementing appropriate treatment protocols, and improving health outcomes possible. We believe our developed approach can contribute to more sensitive and reliable diagnoses in healthcare applications. Figure 3 contains the results of the system and the process in the literature [10, 33-39, 41]. As can be seen from Figure 3, it is seen that the approach formed with 99.30% gives the best result.
To further establish the effectiveness of our hybrid PCA-1D CNN approach, we also compared its performance against other prominent deep learning architectures that have been applied to breast cancer detection tasks. Figure 4 presents this comparison.
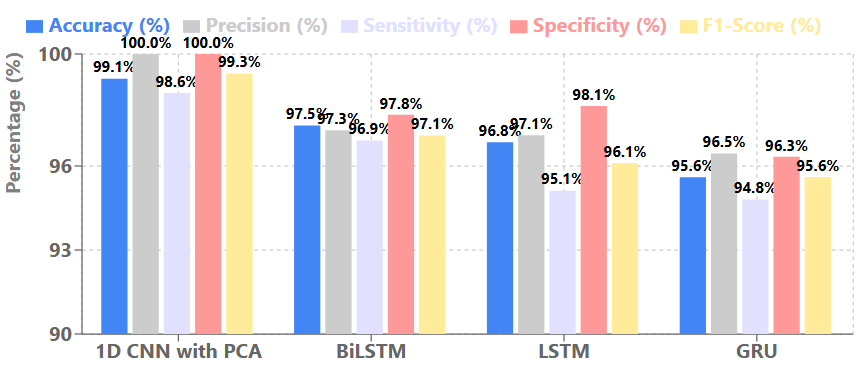
As evidenced by the metrics in Figure 4, our hybrid approach consistently outperforms other deep learning architectures across all evaluation metrics. While recurrent neural network variants like Long Short-term Memory (LSTM), Gated Reccurent Unit (GRU), and Bidirectional LSTM (BiLSTM) have shown promising results for sequential data analysis, they fall short of the performance achieved by our PCA-enhanced 1D CNN model. The superior performance of our approach can be attributed to the effective feature transformation provided by PCA combined with the specialized 1D CNN architecture optimized for this specific classification task.
The high level of accuracy of the approach we developed makes a significant contribution to the health field. This high accuracy strongly supports healthcare professionals in making critical decisions like disease diagnosis and patient management. Precise and reliable results can increase the early diagnosis of patients, the creation of appropriate treatment plans and, accordingly, the success of treatment. This situation has the potential to improve the patient’s quality of life. The approach we have developed aims to reduce the difficulties faced by healthcare professionals and patients by enabling more effective, rapid and reliable decisions to be made in the healthcare industry. In this way, we aim to create positive and lasting effects on the health outcomes of patients.
4.1. Statistical Validation of Results
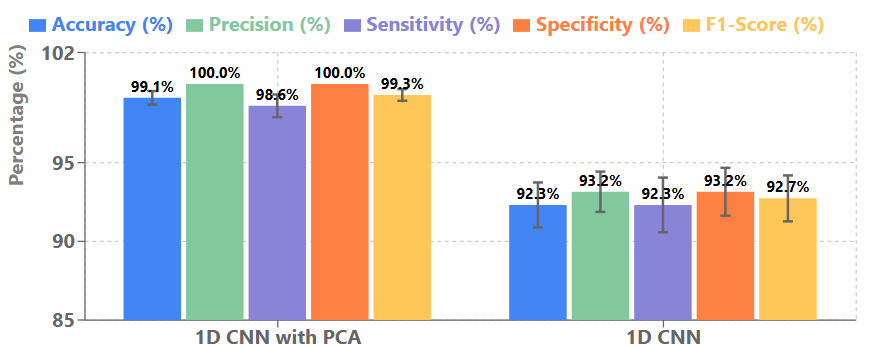
To ensure the statistical validity and robustness of our hybrid PCA-1D CNN approach, we report the mean and standard deviation of performance metrics obtained through 5-fold cross-validation. Figure 5 presents these comprehensive statistics for our model compared with the 1D CNN without PCA.
The consistently low standard deviations across all metrics for our hybrid approach demonstrate the stability and reliability of our model across different data partitions. This is particularly evident when comparing with the standalone 1D CNN, which shows higher variability in performance. The zero standard deviation for precision and specificity indicates that our model consistently achieves perfect performance in these metrics across all folds, which further validates the effectiveness of our approach in minimizing false positives. We further analyzed the confidence intervals (95%) for the accuracy metric, which yielded [98.56%, 99.68%] for our hybrid approach compared to [90.46%, 94.16%] for the standalone 1D CNN. This non-overlapping interval confirms the statistical significance of the performance improvement achieved by our hybrid method. These statistical validations strengthen our conclusion that the integration of PCA with 1D CNN provides not only superior but also more consistent and reliable performance for breast cancer detection, which is crucial for clinical applications where consistency across different patient populations is essential.
5. Discussion
Breast cancer is the most common type of cancer, especially among women in recent years. In this type of cancer, early detection and proper treatment can significantly improve the quality of human life. This paper proposes a novel hybrid approach that can assist healthcare professionals in accurate breast cancer diagnosis. A review of existing approaches in the literature reveals that many complex methodologies have been applied for breast cancer diagnosis. This complexity creates barriers to implementation in resource-constrained regions and areas with limited access to medical expertise. The method proposed in this study can operate effectively with simpler, more accessible systems, making it viable for widespread adoption. In an era of escalating healthcare costs, reducing system complexity and implementation expenses is particularly valuable. This study also highlights the synergistic contribution of traditional dimensionality reduction techniques like PCA when integrated with modern artificial intelligence approaches. Our evaluations demonstrate that when these methods are used in combination, they can achieve more accurate breast cancer diagnosis than either approach alone.
While our hybrid PCA-1D CNN approach demonstrated excellent performance on the Wisconsin dataset, we acknowledge that our experiments were limited to this relatively small dataset (569 samples). As part of future work, we plan to evaluate our approach on larger and more diverse breast cancer datasets from multiple institutions to further validate its scalability and generalizability. Larger datasets will inevitably introduce additional computational challenges, particularly for the PCA transformation process which scales quadratically with sample size. To address these challenges, we will explore computationally efficient alternatives such as incremental PCA, randomized PCA, or mini-batch processing to maintain performance while preserving the benefits of our hybrid approach. Additionally, we intend to investigate the application of our method to multimodal data that combines imaging features with genomic and clinical information, which would provide a more comprehensive framework for breast cancer detection. These extensions will be crucial for ensuring that our approach remains viable and effective in real-world clinical settings with diverse patient populations and varying data characteristics.
6. Conclusion
In this study, we developed a hybrid approach for breast cancer detection using the Wisconsin dataset. This approach effectively separates and classifies data by integrating PCA and CNN architectures. Proper separation of data is essential for accurate diagnosis in critical healthcare applications such as breast cancer detection, as the overlapping of different classes can significantly impair classification performance. To address this challenge, we employed PCA to transform the data to a new feature space where discriminative characteristics become more prominent. This transformation creates a representation where redundant features are minimized, and class distinctions are enhanced. The transformed data is then classified using our custom-designed 1D CNN architecture, which automatically identifies patterns in the feature vectors to determine class membership. We selected this deep learning approach for its ability to autonomously extract and classify features with high accuracy.
To enhance the model’s reliability and generalizability, we implemented k-fold cross-validation, which rigorously tests performance across multiple data partitions. This validation strategy ensures that our model performs consistently across varied data distributions. Our results demonstrate that the integration of PCA with CNN architectures represents a significant advancement in breast cancer detection methodology. This combination of traditional dimensionality reduction techniques with modern deep learning approaches contributes valuable tools to the healthcare domain for precise diagnosis and effective treatment planning. The findings of this study can serve as a foundation for researchers seeking to develop more reliable and efficient approaches for breast cancer detection and other healthcare applications.
- The International Agency for Research on Cancer, “IARC release latest world cancer statistics,” (2020,August 3), Retrieved from https://www.uicc.org/news/iarc-release-latest-world-cancer-statistics.
- M. Özdoğan, (2021, May 4), “Türkiye Kanser İstatistikleri 2020,” https://www.drozdogan.com/turkiye-kanser-istatistikleri-2020/.
- K. Loizidou, R. Elia, C. Pitris, “Computer-aided breast cancer detection and classification in mammography: A comprehensive review,” Computers in Biology and Medicine, pp. 153, 2023,doi:10.1016/j.compbiomed.2023.106554.
- T Ayer et al., “Computer-aided diagnostic models in breast cancer screening,” Imaging in Medicine, vol. 2(3), pp. 313–323, 2010, doi:10.2217/iim.10.24.
- Y. Li, Z. Chen, “Performance evaluation of machine learning methods for breast cancer prediction,” Applied and Computational Mathematics, vol. 7(4), 212, 2018, doi:10.11648/j.acm.20180704.15.
- M. Ak, ” A comparative analysis of breast cancer detection and diagnosis using data visualization and machine learning applications,” Healthcare, vol. 8(2), 111, 2020 doi:10.3390/healthcare8020111.
- P. Prastyo et al., “Predicting breast cancer: a comparative analysis of machine learning algorithms,” Proceeding International Conference on Science and Engineering, 455-459, 2020, doi:10.14421/icse.v3.545.
- A. Ali et al.,”A deep learning breast cancer prediction framework,” Journal on Artificial Intelligence, vol. 3(3), 81-96, 2021, doi:10.32604/jai.2021.022433.
- R. Hasan, A. Shafi, “Feature selection based breast cancer prediction,” International Journal of Image Graphics and Signal Processing, vol. 15(2), 13-23, 2023, doi:10.5815/ijigsp.2023.02.02.
- C. León et al. ,”Automatic detection of breast cancer by using ensemble learning,” 2023, doi:10.21203/rs.3.rs-2934498/v1.
- Y. Hernández-Julioet al., “Intelligent fuzzy system to predict the wisconsin breast cancer dataset,” International Journal of Environmental Research and Public Health, vol. 20(6), 5103, 2023, doi:10.3390/ijerph20065103.
- A. Ahmad, “Evaluation of modified categorical data fuzzy clustering algorithm on the wisconsin breast cancer dataset,” Scientifica, 1-6, 2016, doi:10.1155/2016/4273813.
- G. Nirmala,”Dimentionality reduction using principal compound analysis in supervised machine learning techniques,” Bioscience Biotechnology Research Communications, vol. 13(13), 326-331, 2020 doi:10.21786/bbrc/13.13/50.
- I. Ates, T. Bilgin,”The investigation of the success of different machine learning methods in breast cancer diagnosis,” Konuralp Tıp Dergisi, vol. 13(2), 347-356, 2021, doi:10.18521/ktd.912462.
- S. Aamir et al., “Predicting breast cancer leveraging supervised machine learning techniques,” Computational and Mathematical Methods in Medicine, 1 -13, 2022 doi:10.1155/2022/5869529.
- A. Sethi, A. Chug, “Breast Cancer Prediction Using Nature Inspired Algorithm,” Advances in Interdisciplinary Research in Engineering and Business Management, 379-389, 2021, doi:10.1007/978-981-16-0037-1_30.
- Y. B Koca, E. Aktepe, “Evaluation of Missing Data Imputation Methods and PCA Techniques for Machine Learning Models in Breast Cancer Diagnosis Using WBCD,” TüRk Doğa Ve Fen Dergisi, vol. 13, 109-116, 2024, doi:10.46810/tdfd.1460871.
- A. A. Khan, M. A. Bakr, “Enhancing Breast Cancer Diagnosis with Integrated Dimensionality Reduction and Machine Learning Techniques,” Journal of Computing & Biomedical Informatics, vol. 7, 1-17, 2024, doi:10.56979/702/2024.
- W. Hanon, M. A. Salman, “Integration of ML Techniques for Early Detection of Breast Cancer: Dimensionality Reduction Approach,” Ingénierie Des Systèmes D’information, vol. 29(1), 347–353, 2024, doi:10.18280/isi.290134.
- V. K. M. Nagaraju et al., “A Robust Breast Cancer Classification System Using Multilayer Perceptron and Grey Wolf Optimization,” Traitement Du Signal, vol. 42(1), 2025, doi:10.18280/ts.420105
- L K. Singh, Khanna, M. R. Singh , “An enhanced soft‑computing based strategy for efcient feature selection for timely breast cancer prediction: Wisconsin Diagnostic Breast Cancer dataset case,” Multimedia Tools and Applications, vol. 83(76607), 2024, doi:10.1007/s11042-024-18473-9.
- D. Kumari et al., “Predicting breast cancer recurrence using Deep Learning,” Discover Applied Sciences, vol. 7(2), 2025, doi:10.1007/s42452-025-06512-5
- UCI Machine Learning Repository (n.d.), “https://archive.ics.uci.edu/ml/datasets/Breast+Cancer+Wisconsin+(Original)”.
- N. Tsagarakis et al., “L1-norm principal-component analysis of complex data,” IEEE Transactions on Signal Processing, vol. 66(12), 3256-3267, 2018, doi:10.1109/tsp.2018.2821641.
- K. Yeung, W. Ruzzo, “Principal component analysis for clustering gene expression data,” Bioinformatics, vol. 17(9), 763-774, 2001, doi:10.1093/bioinformatics/17.9.763.
- S. Zhang, X. Chen, P. Li, “Principal component analysis algorithm based on mutual information credibility,” Destech Transactions on Computer Science and Engineering, (iccis),2019, doi:10.12783/dtcse/iccis2019/31947.
- K. He et al., “Deep Residual Learning for Image Recognition [Review of Deep Residual Learning for Image Recognition],” IEEE Conference on Computer Vision and Pattern Recognition, 770–778, 2016, doi:10.1109/cvpr.2016.90.
- A. Sabir, A. Kumar, “Optimized 1D-CNN model for medicinal Psyllium Husk crop mapping with temporal optical satellite data,” Ecological Informatics, vol. 71, 101772,2022, doi:10.1016/j.ecoinf.2022.101772.
- J. Wu et al., “Chest X-Ray image analysis with combining 2D and 1D convolutional neural network based classifier for rapid cardiomegaly screening,” IEEE Access, vol. 10, 47824–47836, 2022, doi:10.1109/access.2022.3171811.
- W. Hassan, J. B. Joolee, S. Jeon, “Establishing haptic texture attribute space and predicting haptic attributes from image features using 1D-CNN,” Scientific Reports, vol. 13(1), 2023, doi:10.1038/s41598-023-38929-6.
- S. Hicks et al.,”On evaluation metrics for medical applications of artificial intelligence,” Scientific Reports, vol. 12(1),2022, doi:10.1038/s41598-022-09954-8.
- B. Yu, H. Xie, Z Xu, “PN-GCN: Positive-negative graph convolution neural network in information system to classification,” Information Sciences, vol. 632, 411–423, 2023, doi:10.1016/j.ins.2023.03.013.
- S. Almutairi et al., “Breast cancer classification using Deep Q Learning (DQL) and gorilla troops optimization (GTO),” Applied Soft Computing, vol. 142, 110292,2023 doi:10.1016/j.asoc.2023.110292.
- K. M. M. Uddin et al., “Machine learning-based diagnosis of breast cancer utilizing feature optimization technique,” Computer Methods and Programs in Biomedicine Update, vol. 3, 100098,2023, doi:10.1016/j.cmpbup.2023.100098.
- W. T. Mohammad et al., “Diagnosis of Breast Cancer Pathology on the Wisconsin Dataset with the Help of Data Mining Classification and Clustering Techniques,” Applied Bionics [and Biomechanics, 1–9, 2022,doi:10.1155/2022/6187275.
- B. Abunasser et al., “Convolution Neural Network for Breast Cancer Detection and Classification Using Deep Learning,” Asian Pacific Journal of Cancer Prevention, vol. 24(2), 531–544,2023, doi:10.31557/apjcp.2023.24.2.531.
- M. A. A. Albadr et al.,. “Breast cancer diagnosis using the fast learning network algorithm,” Frontiers in Oncology, vol. 13,2023, doi:10.3389/fonc.2023.1150840.
- T. Suresh, Z. Brijet, T. D. Subha, ” Imbalanced medical disease dataset classification using enhanced generative adversarial network,” Computer Methods in Biomechanics and Biomedical Engineering, 1–17, 2022, doi:10.1080/10255842.2022.2134729.
- A. Ed-daoudy, K. Maalmi, ” Breast cancer classification with reduced feature set using association rules and support vector machine,” Network Modeling Analysis in Health Informatics and Bioinformatics, vol. 9(1), 2020, doi:10.1007/s13721-020-00237-8.
- M. H. Alshayeji et al., “Computer-aided detection of breast cancer on the Wisconsin dataset: An artificial neural networks approach,” Biomedical Signal Processing and Control, vol. 71, 103141,2022, doi:10.1016/j.bspc.2021.103141.
- A. S. Assiri, S. Nazir, S. A. Velastin, “Breast Tumor Classification Using an Ensemble Machine Learning Method,” Journal of Imaging, vol. 6(6), 39,2020, doi:10.3390/jimaging6060039.
No related articles were found.