Cavity Sensing for Defect Prevention in Injection Molding

(This article belongs to the Special Issue on Special Issue on Computing, Engineering and Sciences (SI-CES 2024-25) and the Section Manufacturing Engineering (MNE))
Export Citations
Cite
Haberchad, O. and Salih-Alj, Y. (2025). Cavity Sensing for Defect Prevention in Injection Molding. Journal of Engineering Research and Sciences, 4(5), 10–19. https://doi.org/10.55708/js0405002
Oumayma Haberchad and Yassine Salih-Alj. "Cavity Sensing for Defect Prevention in Injection Molding." Journal of Engineering Research and Sciences 4, no. 5 (May 2025): 10–19. https://doi.org/10.55708/js0405002
O. Haberchad and Y. Salih-Alj, "Cavity Sensing for Defect Prevention in Injection Molding," Journal of Engineering Research and Sciences, vol. 4, no. 5, pp. 10–19, May. 2025, doi: 10.55708/js0405002.
Real-time monitoring of injection molding parameters plays a pivotal role in enhancing product quality, reducing defects and improving production. This study presents a cavity data acquisition system for real time monitoring of process parameters inside the mold. The system consists of non-destructive in-mold sensors that monitor the status of the melt within the cavities. Furthermore, the geometry of the injected part is taken into consideration when selecting the position of the sensors. This enables early discovery of defects by studying abnormal variations of the monitored parameters in areas where these defects are suspected. A case scenario is shown in which we simulate the molding profile of a plastic part using SolidWorks Plastics. The suggested sensors’ placements are then derived. Results indicate that the piezoelectric sensor measures with a root mean square error (RMSE) that is less than 0.0004 V and a peak error of 0.0012 V. The proposed method promises more control over injection conditions inside the mold, as well as enhanced overall production quality
1. Introduction
Since the invention of polymers, plastic products have been widely employed to meet basic demands and to replace expensive materials while providing competitive performance. Plastic’s high popularity stems from its adaptability and capacity to mimic the functions of other materials while offering enhanced features such as corrosion resistance, low weight, flexibility, inexpensive production and maintenance costs [1].
Plastic manufacturing has significantly been used in many industries. The use of plastic in the automobile and aircraft industries led to a reduction in fuel consumption thanks to its light weight. Its usage in the medical industry improved safety and reduced contamination caused by metal equipment [2].
Different processes are used to produce plastic parts. This includes extrusion, thermoforming, blow molding, and injection molding.
Injection molding is a popular manufacturing technology. It is widely used in various industries, including automotive, medical, and electronics. The injection molding market have reached 305 billion USD in 2022 only, accounting for over one-third of total plastic manufacturing [3]. The sector has evolved significantly in recent decades. Concerns over plastic waste and Industry 4.0’s demand for digitalized processes, including cyber-physical systems, are driving these changes [4]. To address these challenges, different methods have been proposed to automate and optimize the injection molding process [5], [6].
To fully regulate the injection molding process, machine and in-mold parameters, as well as part quality, must be monitored [7]. Tracking machine parameters offers real-time insight into the polymer’s behavior during dehumidification, melting, and injection phases. Previous works have analyzed data from the injection machine to determine which parameters have the greatest impact on the quality of ejected parts [8]. This strategy produced notable outcomes. However, injection molding’s non-iterative nature led to varying results across multiple manufacturing cycles.
In mold process monitoring entails tracking the polymer melt (resin) during injection, cooling, and ejection. Previous works in the literature suggest that extracting data from a mold can provide better insights about melt status and behavior [7], [9].
Melt enters mold cavities later in the molding cycle. This stage involves sophisticated procedures including cooling, ejection, and most importantly, part formation. The polymer’s condition can be closely monitored as it transitions from liquid to solid using in-mold sensors. While sensors have been used in machines since the 1960s, cavity sensors represent a recent technological adoption (10-12 years) [10]. This is due to the complex mounting of these sensors inside the mold which delays their mass integration.
However, with an increasing migration towards automated monitoring of industrial processes, cavity sensing technology has gained more popularity, and an array of new sensors has been developed to ensure agile integration into machinery.
Cavity sensors typically use piezoelectric and strain gauges for pressure measurement and thermocouples to monitor temperature [11]. These are available in various sizes and mounting options, allowing for full customization to meet quality standards. However, numerous limitations have been affecting their performance. For instance, sensors mounted in molds can be damaged by high pressure and temperature changes, leading to corrosion and frozen layers. This results in measuring inaccuracies. Additionally, while direct contact with the melt can result in accurate measurements, it may also cause surface level defects in the final product.
Thin-film sensors have also been investigated. They are made of piezoelectric sensors that are deposited into the steel surface via sputtering, allowing for precise pressure monitoring in various parts of the mold [7]. Temperature changes, however, significantly disrupt the signals affecting measurement accuracy.
Other alternative sensors have been proposed, including wireless piezoelectric sensors [12], infrared sensors [13], and optical sensors [14]. Although they are still in their early stages of implementation in industry, they provide efficient and precise measurements without direct contact with the melt which expands the range of parameters that can be monitored.
To allow full integration of cavity sensors with the other components of the mold, different Data acquisition systems have been developed. This includes an Arduino microcontroller-based data acquisition module that allows the visualization of different mold parameters including mold temperature, cavity pressure, 3-axis acceleration, and extraction force [15]. These were measured based on commercially available sensors including thermocouples, pressure sensors, and force sensors. The developed system allowed affordable, simple, and real-time data acquisition and monitoring of process parameters. Additionally, the system was able to distinguish between normal and abnormal patterns in monitored parameters. Although process variations were successfully captured, the wired nature of sensors used can cause potential hazards due to mold’s movements. To overcome this issue, a multiple measurement sensor was adopted in [16] to measure temperature and pressure simultaneously. The sensor was equipped with a piezoelectric transducer for pressure measurement, and a K thermocouple for temperature measurement. This reduced the amount of holes required to insert sensors inside the cavities thereby minimizing structural damage to the mold. Other commercially available controllers include Priamus’ Fillcontrol, BlueLine Hardware and QFlow Systems Engineering.
Considering cavity sensors’ high efficiency in monitoring injection molding processes and addressing the lack of sufficient work recognizing the geometry of the part when selecting sensors, this work presents a data acquisition system for in-mold process control and monitoring. The system allows the measurement of injection molding process parameters inside the mold using cavity sensors. The main objective of the study is to select sensors capable of accurately monitoring cavity process parameters in areas where defects are suspected while taking into account the geometry of the part and without inducing destructive alterations to the mold. To achieve this, ultrasonic based sensors were proposed. These sensors are positioned based on the part’s molding profile to identify abnormal melt flow and reduce defects. Thank to their wireless transmission scheme, these sensor reduce the amount of wholes and wires inserted into the mold resulting in a more robust process monitoring. The proposed approach can promote sustainable injection molding by decreasing waste and adjusting to future changes in the manufacturing process.
The remainder of the paper is structured as follows. Section 2 describes the theoretical model for cavity data acquisition. Section 3 presents the proposed data acquisition system.

Section 4 details the obtained simulation results. Finally, Section 5 concludes the paper.
2. Theoretical Model for Cavity Data Acquisition
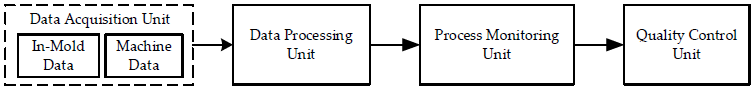
This section presents the injection molding process cycle data flow. Figure 1 depicts four levels of data processing: data acquisition unit, data processing unit, process monitoring unit, and quality control unit [17].
2.1. Data Acquisition Unit
Data collection begins with measuring process parameters using sensors incorporated in both the injection machine and the mold. The machine is equipped with a complex set of sensors that allow for full monitoring of various process parameters such as maximum injection pressure, screw position, and temperature in different screw zones.
Due to direct contact with the melt, in-mold sensors are incredibly effective in describing melt flow behavior while being less complex. For instance, these sensors can measure mold temperature and pressure, melt flow, velocity, and viscosity [7].
2.2. Data Processing Unit
The data obtained from injection molding machines and in-mold sensors is then processed. The collected signals are amplified and filtered to remove noise and enhance the data. The continuous signals generated by the sensors are then sampled to improve computational efficiency and synchronize the numerous data sources.
2.3. Process Monitoring Unit
At this stage, the processed datasets are utilized to monitor injection cycles. Machine and mold parameters are visualized via graphical interfaces, allowing operators to track variations in process parameters as well as melt rheology to ensure that no disruptions influence production [6].
2.4. Quality Control
Once the part is ejected out of the mold, it undergoes multiple control procedures. First, when the injection cycle ends, and later once the visual and dimensional features of the part stabilize. This ensures that the part meets the standards set by the customer.
3. Proposed Data Acquisition System
In this section a detailed description of the proposed data acquisition system is given. As illustrated in Figure 2, four steps are to be implemented to develop the model: analysis of part geometry, investigation of defects and their causes, sensor selection, and data transmission.
3.1. Analysis of Part Geometry using CAD Software
Part design is the first step in the mold creation process. Computer-aided design simulations, such as Autodesk, Ansys, and SolidWorks, have made part design more automated. Injection molding software can design parts and simulate melt behavior. This provides valuable insights into how parameters vary during the filling process. Additionally, it allows for early detection of defects during the injection process.
3.2. Analysis of Defects and Their Causes
After the part is manufactured, the next step in implementing the suggested cavity data acquisition system is to analyze the injection molding defects associated with the mold. Weld lines, shrinkage, warpage, and sink marks are some of the most prevalent defects.
3.2.1. Weld Lines
Weld lines are plastic flow traces that resemble the letters J or U. This defect occurs when two fronts flow from different directions meet, resulting in weak regions in the component [18].
3.2.2. Shrinkage
Shrinkage is the reduction in volume caused by polymer cooling. Inconsistent contraction due to temperature variations in the various regions of the part causes shrinkage [19]. Despite its common occurrence, excessive shrinkage can cause geometric errors in plastic parts.
The shrinkage can be expressed using equation (1), [20]:
$$s_i = \frac{d_i – d_{si}}{d_i}, \tag{1}$$
where s is the shrinkage, d is the cavity width, and is the part’s width. The i subscript indicates the sensor’s position. Using different sensors, temperature and pressure can be measured locally to calculate the overall shrinkage of the part.
3.2.3. Warpage
Warpage occurs when internal forces cause a part to bend and deviate from its original geometry. Warpage, as is shrinkage, is induced by uneven part contraction and ongoing cooling after ejection, which causes parts with slower cooling rates to bend [19].
3.2.4. Sink Marks
Sink marks appear on surfaces with substantial wall thickness on the opposite side [18]. Such defects could occur due to fluctuations in cavity temperature, in addition to variations in other process factors including cooling time and packing pressure [21].
3.3. Sensor Selection
Mold sensors monitor numerous parameters inside the cavity, including pressure and temperature. This work considers sensors that take into account both defects and part geometry. To avoid damaging the mold during installation, two sensors are proposed: a wireless piezoelectric sensor and an ultrasonic sensor.
3.3.1. Wireless Piezoelectric Sensors
These sensors monitor pressure by transmitting energy from melt pressure, which also powers them [12]. An energy converter converts mechanical energy from the melt into electrical energy. The energy converted is expressed as follows:
$$E = \tfrac{1}{2} C \left( \frac{n \cdot d_{33} \cdot P \cdot A_{fp}}{C} \right)^{2}, \tag{2}$$
where C is the total capacitance, is the charge constant, P is the pressure acting on the piezoceramic ring, 𝐴fp is the footprint area where the pressure is acting, and n is the number of piezoceramic rings. For instance, electric charge is generated under mechanical stress induced by melt pressure. The resulting charge can be expressed as the product of the pressure acting on the ring, the footprint area over which the pressure is acting, and the charge constant. The electrical behavior of the piezoelectric rings can be approximated as a parallel plate capacitor. The ratio of the charge over the total capacitance of the system models the voltage generated, and it is related to the square root of the energy as expressed in equation 2.
The resulting electrical energy is discretized into electrical pulses using a threshold modulator. A signal transmitter converts the pulses into ultrasonic waves, which are subsequently delivered to a receiving unit outside the cavity.
3.3.2. Ultrasonic Sensors
Ultrasonic sensors are non-destructive and can measure parameters including melt homogeneity, temperature, and thickness [7]. Ultrasonic transducers use the converse piezoelectric effect to propagate ultrasonic waves [22]. Equations (2), (3), and (4) indicate how longitudinal ultrasonic velocity can be related to pressure and temperature using specific volume [23].
$$c_L = \left( \frac{1}{\rho \kappa} \right)^{\tfrac{1}{2}}, \tag{3}$$
where 𝑐𝐿 is the longitudinal ultrasonic velocity, is the density of the polymer melt, and κ is the adiabatic compressibility expressed as:
$$\kappa = -\tfrac{1}{v} \left[ \left( \tfrac{\partial v}{\partial P} \right)_{T} + \tfrac{T}{c_p} \left( \tfrac{\partial v}{\partial P} \right)_{P}^2 \right], \tag{4}$$
where P is the melt pressure, T is the melt temperature, cp is the specific heat capacity, and 𝜈 is the specific volume described by the Tait equation as [23]:
$$v(T,P) = v_{0}(T) \left[ 1 – C \cdot \ln \left( 1 + \tfrac{P}{B(T)} \right) \right] + v_{t}(T,P), \tag{5}$$
where 𝜈0 is the zero pressure isotherms, B(T) is a temperature dependent function, and C= 0.0894 is a universal constant [24].
As the melt temperature increases, the sound velocity decreases in an approximately linear manner. On the other hand, increased melt pressure drives sound velocity to higher levels.
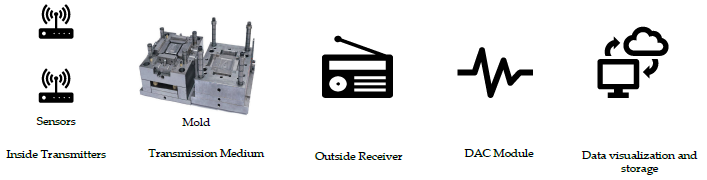
3.4. Data Transmission
Given the sensors used, the data acquisition scheme is based on the transmission of ultrasonic waves, allowing wireless communication between the transmitter and receiver [25]. To illustrate, when cavity parameters are monitored, they are transformed into a voltage, which is then discretized into pulses using a threshold modulator [12]. The pulsing voltage causes the piezoelectric material to be displaced, resulting in ultrasonic waves [22]. These waves can travel through the mold’s walls. Then they are received by an external receiver, which turns them back into voltage. The cavity measurements are recovered by multiplying the number of received ultrasonic pulses by the modulator’s threshold. To display and save the measurements, a data acquisition module (DAC) can be employed to transform the analogue signal to a digital one. Figure 3 shows the overall transmission scheme.
4. Simulation Results
4.1. Simulation Setup
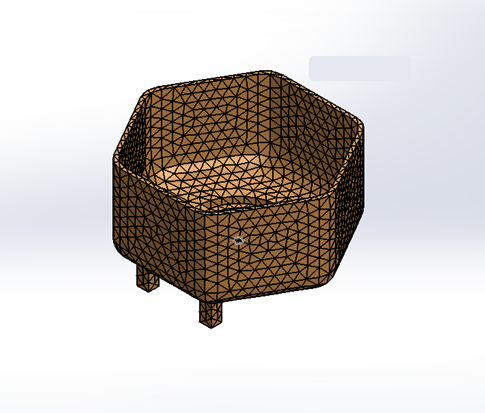
To visualize the proposed system’s mechanisms, a computer-aided engineering (CAE) simulation has been constructed in SolidWorks Plastic. We began by designing the part, as shown in Figure 4. The part investigated was designed to cause the previously mentioned defects.
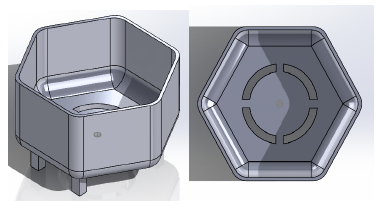
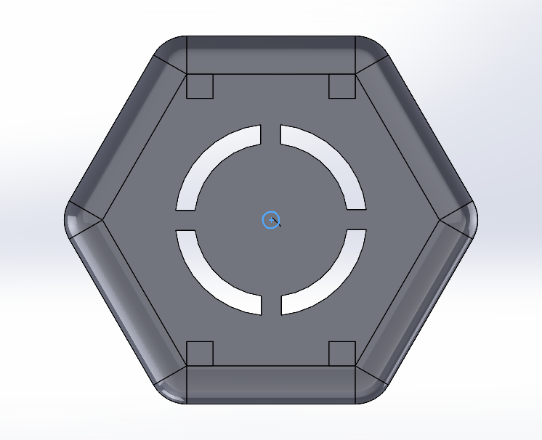
Then we proceed with the plastic flow analysis. The latter begins by defining the materials used. The chosen polymer is Acrylonitrile Butadiene Styrene (ABS), and its parameters are described in the SolidWorks plastic database, as seen in Table 1. This is followed by defining process parameters values for the simulation as expressed in Table 2. After that, the injection gate (through which the melt enters the cavity) was placed in the center of the part as seen in Figure 5.
Table 1: Material properties of ABS.
Property | Value |
Melt Flow rate | 35 g/10min |
Max shear rate | 50000 1/s |
Max shear stress | 0.3 MPa |
Poisson’s Ratio | 0.39 |
Elastic Modulus | 2250 |
Melt Temperature | 230 °C |
Max. Melt Temperature | 280 °C |
Min. Melt Temperature | 200 °C |
Mold Temperature | 50 °C |
Ejection Temperature | 90 °C |
Furthermore, a solid mesh with a total of 17410 triangular components measuring 5.19 mm was created as illustrated in Figure 6.
The simulation is then run, and the distribution of the various parameters and defects are shown.
Table 2: Simulation process parameter values.
Process parameter | Value |
Melt temperature | 230 °C |
Mold temperature | 50 °C |
Injection pressure limit | 100 MPa |
Pure cooling time | 31.163 s |
4.2. Parameter Visualization
This section visualizes the various variables that control the process. The data was acquired after performing the plastic flow simulation in SolidWorks Plastics.
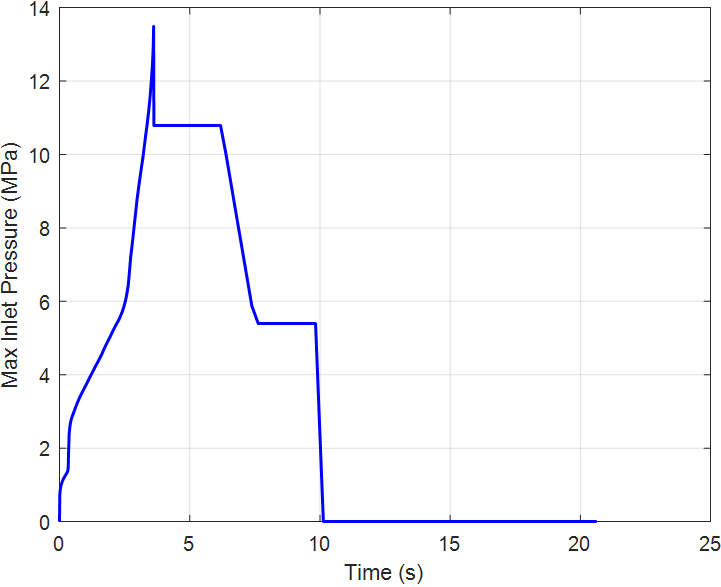
In Figure 7, the max inlet pressure is visualized. We notice that the pressure increases until it reaches a maximum value of 13.488 MPa and then it decreases.
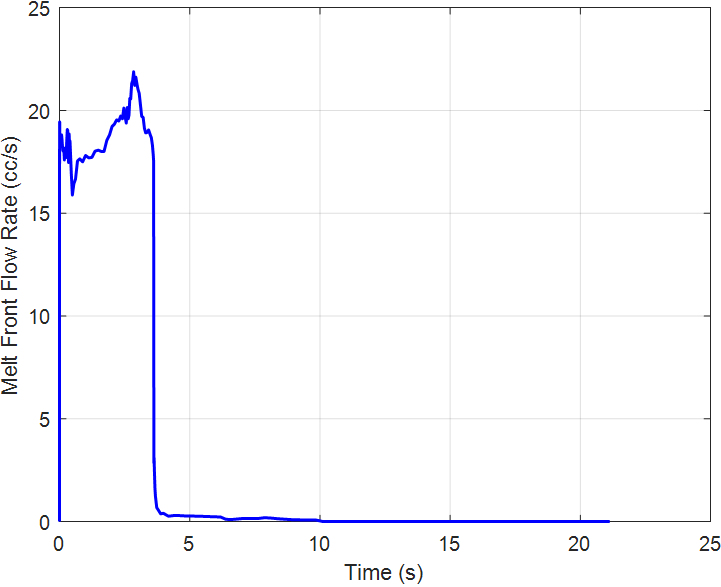
In Figure 8, the melt front flow rate versus time is visualized. We notice that the melted front flow rate varies increasingly until reaching a maximum value of 21.883 cc/s.
4.3. Analysis of Defects
In addition to analyzing the distribution of parameters within the cavity, fill and warp analysis enable us to identify potential defects that may appear during the molding process. The previously reported defects had been identified within the part after the simulations were completed.
Figure 9 depicts the distribution of sink marks in the portion. We notice that these marks are located in the lower area of the part because it has a high wall thickness, as well as in the four extruded pieces bearing the part, which have a high thickness and generate a depression on the other side of the part.
Figure 10 demonstrates the distribution of volumetric shrinkage. We observe that both the upper part and the gate endure significant shrinkage.
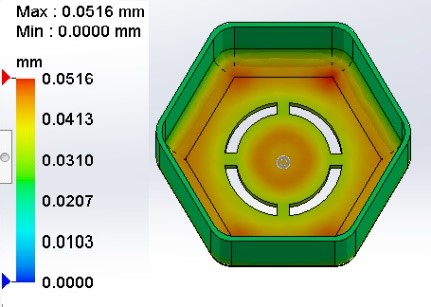
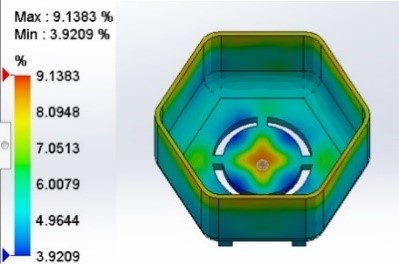
Figure 11 depicts the distribution of weld lines throughout the part. We notice that the weld lines are placed near the holes in the part, indicating that two melt flow fronts intersect in those areas.
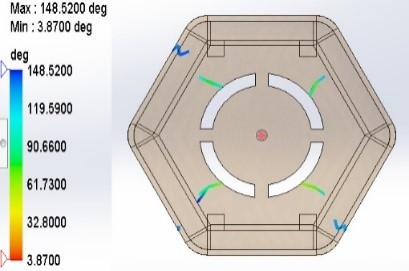
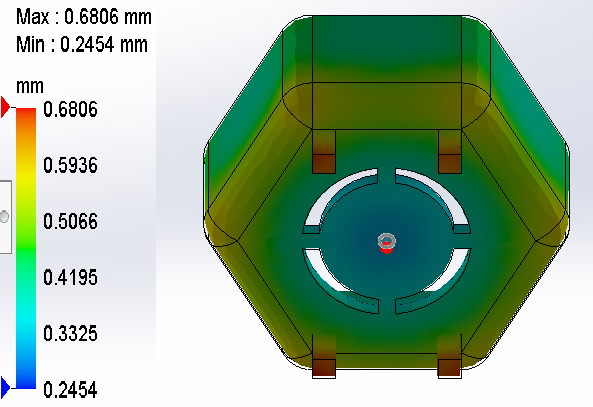
Figure 12 depicts the distribution of the total displacement of the part. The walls experience moderate warp levels, while the lower area experience greater warp.
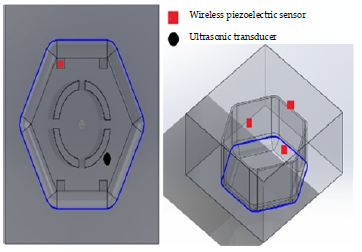
4.4. Sensor’s Placement
The system requires a total of five sensors, as shown in Figure 13. One wireless piezoelectric sensor will be installed where a sink mark is suspected in order to monitor pressure changes. Three more wireless piezoelectric sensors are utilized to monitor the part’s shrinkage and displacement: one in the part wall, one at the top, and one at the bottom. One ultrasonic transducer is used to measure temperature in the area where weld lines may appear.
4.5. Piezoelectric Sensor Measurement
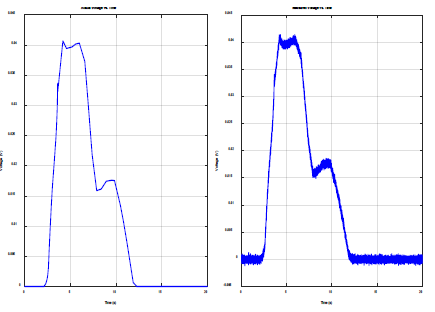
Using data from the CAE simulation, we evaluate the signal transmitted by the piezoelectric sensor, Figure 14 illustrates the MATLAB block diagram. The input is the pressure of the area where sink marks are monitored. This pressure is transformed into a voltage [12]. Then noise is added to emulate real-world measurement disturbances from industrial environment.
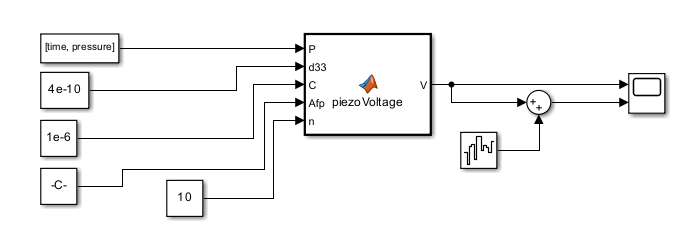
Figure 15 illustrates the actual voltage while Figure 16 illustrates the measured one. We notice that the measured voltage depicts the variations of the actual voltage. By calculating the root mean square error (RMSE) and the peak error we found values of 0.0003 V and 0.0012 V respectively. This indicates that the proposed sensor accurately depicts the variations of pressure in the specified region, allowing early detection of the appearance of sink marks.
5. Cost Study
To assess the system’s profitability and its potential impact on plastic part manufacturing, we propose a cost analysis based on a large production volume injection molding process [26]. The production cost of the part and the system’s implementation expenses are shown in Table 3. Production volume, production technique, mold type and cost, lead time to final component, material cost, labor cost, and outsourcing cost are all factors that go into estimating the product’s cost. Fixed costs on the other hand cover the data acquisition system’s initial deployment fees.
Table 3: Detailed costs.
Variable Costs | Amount (USD) |
Part cost | 1.70 |
Production volume per month | 100,000.00 |
Total | 170,000.00 |
Fixed cost | |
Sensor price | 750.00 |
DAC module | 108.00 |
Overhead costs | 4,000.00 |
Selling expenses | 1,000.00 |
Investment costs | 5,000.00 |
Management expenses | 2,000.00 |
total | 12,858.00 |
Sales | |
Part price | 4.00 |
Total | 400,000.00 |
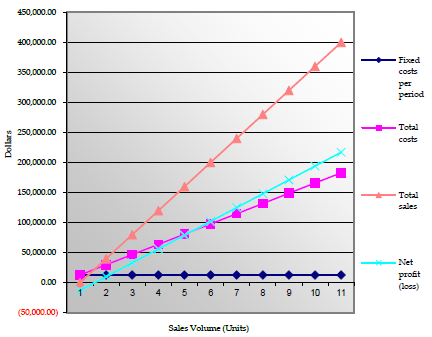
To measure the effect of the system on production we implemented a breakeven analysis as seen in Figure 16. The break-even point is calculated using the following equation (5):
The breakeven point for the suggested system was 5,590 units. Considering a monthly production and sales volume of 100,000 units, the system’s implementation expenses will be recovered within the first month of adoption.
It is also important to mention that the acceptable percentage of scrab can vary between 1% to 5%. If we consider a monthly plastic production of 100,000 parts weighing 20 g, the total amount of plastic waste generated monthly will be between 20 kg to 100 kg. These values are very high considering that the cost of raw material ranges from $1 to $5 per kilogram, and the high carbon footprint of ABS estimated at 146 g CO2e/kg [27]. Therefore, successful implementation of the system will lead to a reduction of scrab, and pollution generated by injection molding.
6. Conclusion
In this paper, a cavity data acquisition system for in-mold process monitoring was proposed. The system allowed non-destructive measurement of cavity process parameters thanks to the use of piezoelectric and ultrasonic sensors.
The system has been developed in various phases, starting with part analysis using CAD software, followed by an investigation of defects and their causes, the sensors selected have then been described, and finally, the transmission scheme has been detailed.
Simulation results illustrated that CAD software can simulate melt behavior while allowing early detection of abnormalities and planning of sensor positioning. Similarly, piezoelectric sensors demonstrated accurate measurement of pressure showcasing that ultrasonic-based transmission of data is the best method for nondestructive monitoring of injection parameters within the cavity.
A draft cost analysis has been proposed to illustrate the cost effectiveness of the system and the short recovery of investment costs.
These results highlight the ability of the system to control injection conditions inside the mold while also improving production quality and reducing injection molding costs.
Although virtual testing provided an efficient evaluation of the system, on-site testing would allow practical investigation and examination of how the dynamic nature of the process may affect the system’s capabilities. Additionally, the performance of the proposed sensors can be compared to emerging sensors such as infrared and to other commercially available sensors. Furthermore, the proposed system can be evaluated on other plastic parts to test its reliability on injection systems with varying degrees of complexity.
Future work would address the highlighted limitations and investigate the integration of a real-time control system to allow automated adjustment of in-mold parameters.
Conflict of Interest
The authors declare no conflict of interest.
1. Introduction
Since the invention of polymers, plastic products have been widely employed to meet basic demands and to replace expensive materials while providing competitive performance. Plastic’s high popularity stems from its adaptability and capacity to mimic the functions of other materials while offering enhanced features such as corrosion resistance, low weight, flexibility, inexpensive production and maintenance costs [1].
Plastic manufacturing has significantly been used in many industries. The use of plastic in the automobile and aircraft industries led to a reduction in fuel consumption thanks to its light weight. Its usage in the medical industry improved safety and reduced contamination caused by metal equipment [2].
Different processes are used to produce plastic parts. This includes extrusion, thermoforming, blow molding, and injection molding.
Injection molding is a popular manufacturing technology. It is widely used in various industries, including automotive, medical, and electronics. The injection molding market have reached 305 billion USD in 2022 only, accounting for over one-third of total plastic manufacturing [3]. The sector has evolved significantly in recent decades. Concerns over plastic waste and Industry 4.0’s demand for digitalized processes, including cyber-physical systems, are driving these changes [4]. To address these challenges, different methods have been proposed to automate and optimize the injection molding process [5], [6].
10 |
To fully regulate the injection molding process, machine and in-mold parameters, as well as part quality, must be monitored [7]. Tracking machine parameters offers real-time insight into the polymer’s behavior during dehumidification, melting, and injection phases. Previous works have analyzed data from the injection machine to determine which parameters have the greatest impact on the quality of ejected parts [8]. This strategy produced notable outcomes. However, injection molding’s non-iterative nature led to varying results across multiple manufacturing cycles.
Figure 1: Block diagram of the considered cavity data acquisition system.
In mold process monitoring entails tracking the polymer melt (resin) during injection, cooling, and ejection. Previous works in the literature suggest that extracting data from a mold can provide better insights about melt status and behavior [7], [9].
Melt enters mold cavities later in the molding cycle. This stage involves sophisticated procedures including cooling, ejection, and most importantly, part formation. The polymer’s condition can be closely monitored as it transitions from liquid to solid using in-mold sensors. While sensors have been used in machines since the 1960s, cavity sensors represent a recent technological adoption (10-12 years) [10]. This is due to the complex mounting of these sensors inside the mold which delays their mass integration.
However, with an increasing migration towards automated monitoring of industrial processes, cavity sensing technology has gained more popularity, and an array of new sensors has been developed to ensure agile integration into machinery.
Cavity sensors typically use piezoelectric and strain gauges for pressure measurement and thermocouples to monitor temperature [11]. These are available in various sizes and mounting options, allowing for full customization to meet quality standards. However, numerous limitations have been affecting their performance. For instance, sensors mounted in molds can be damaged by high pressure and temperature changes, leading to corrosion and frozen layers. This results in measuring inaccuracies. Additionally, while direct contact with the melt can result in accurate measurements, it may also cause surface level defects in the final product.
Thin-film sensors have also been investigated. They are made of piezoelectric sensors that are deposited into the steel surface via sputtering, allowing for precise pressure monitoring in various parts of the mold [7]. Temperature changes, however, significantly disrupt the signals affecting measurement accuracy.
Other alternative sensors have been proposed, including wireless piezoelectric sensors [12], infrared sensors [13], and optical sensors [14]. Although they are still in their early stages of implementation in industry, they provide efficient and precise measurements without direct contact with the melt which expands the range of parameters that can be monitored.
To allow full integration of cavity sensors with the other components of the mold, different Data acquisition systems have been developed. This includes an Arduino microcontroller-based data acquisition module that allows the visualization of different mold parameters including mold temperature, cavity pressure, 3-axis acceleration, and extraction force [15]. These were measured based on commercially available sensors including thermocouples, pressure sensors, and force sensors. The developed system allowed affordable, simple, and real-time data acquisition and monitoring of process parameters. Additionally, the system was able to distinguish between normal and abnormal patterns in monitored parameters. Although process variations were successfully captured, the wired nature of sensors used can cause potential hazards due to mold’s movements. To overcome this issue, a multiple measurement sensor was adopted in [16] to measure temperature and pressure simultaneously. The sensor was equipped with a piezoelectric transducer for pressure measurement, and a K thermocouple for temperature measurement. This reduced the amount of holes required to insert sensors inside the cavities thereby minimizing structural damage to the mold. Other commercially available controllers include Priamus’ Fillcontrol, BlueLine Hardware and QFlow Systems Engineering.
Considering cavity sensors’ high efficiency in monitoring injection molding processes and addressing the lack of sufficient work recognizing the geometry of the part when selecting sensors, this work presents a data acquisition system for in-mold process control and monitoring. The system allows the measurement of injection molding process parameters inside the mold using cavity sensors. The main objective of the study is to select sensors capable of accurately monitoring cavity process parameters in areas where defects are suspected while taking into account the geometry of the part and without inducing destructive alterations to the mold. To achieve this, ultrasonic based sensors were proposed. These sensors are positioned based on the part’s molding profile to identify abnormal melt flow and reduce defects. Thank to their wireless transmission scheme, these sensor reduce the amount of wholes and wires inserted into the mold resulting in a more robust process monitoring. The proposed approach can promote sustainable injection molding by decreasing waste and adjusting to future changes in the manufacturing process.
11 |
The remainder of the paper is structured as follows. Section 2 describes the theoretical model for cavity data acquisition. Section 3 presents the proposed data acquisition system.
Figure 2 : System model of the data acquisition system.
Section 4 details the obtained simulation results. Finally, Section 5 concludes the paper.
2. Theoretical Model for Cavity Data Acquisition
This section presents the injection molding process cycle data flow. Figure 1 depicts four levels of data processing: data acquisition unit, data processing unit, process monitoring unit, and quality control unit [17].
2.1. Data Acquisition Unit
Data collection begins with measuring process parameters using sensors incorporated in both the injection machine and the mold. The machine is equipped with a complex set of sensors that allow for full monitoring of various process parameters such as maximum injection pressure, screw position, and temperature in different screw zones.
Due to direct contact with the melt, in-mold sensors are incredibly effective in describing melt flow behavior while being less complex. For instance, these sensors can measure mold temperature and pressure, melt flow, velocity, and viscosity [7].
2.2. Data Processing Unit
The data obtained from injection molding machines and in-mold sensors is then processed. The collected signals are amplified and filtered to remove noise and enhance the data. The continuous signals generated by the sensors are then sampled to improve computational efficiency and synchronize the numerous data sources.
2.3. Process Monitoring Unit
At this stage, the processed datasets are utilized to monitor injection cycles. Machine and mold parameters are visualized via graphical interfaces, allowing operators to track variations in process parameters as well as melt rheology to ensure that no disruptions influence production [6].
2.4. Quality Control
Once the part is ejected out of the mold, it undergoes multiple control procedures. First, when the injection cycle ends, and later once the visual and dimensional features of the part stabilize. This ensures that the part meets the standards set by the customer.
3. Proposed Data Acquisition System
In this section a detailed description of the proposed data acquisition system is given. As illustrated in Figure 2, four steps are to be implemented to develop the model: analysis of part geometry, investigation of defects and their causes, sensor selection, and data transmission.
3.1. Analysis of Part Geometry using CAD Software
Part design is the first step in the mold creation process. Computer-aided design simulations, such as Autodesk, Ansys, and SolidWorks, have made part design more automated. Injection molding software can design parts and simulate melt behavior. This provides valuable insights into how parameters vary during the filling process. Additionally, it allows for early detection of defects during the injection process.
3.2. Analysis of Defects and Their Causes
After the part is manufactured, the next step in implementing the suggested cavity data acquisition system is to analyze the injection molding defects associated with the mold. Weld lines, shrinkage, warpage, and sink marks are some of the most prevalent defects.
3.2.1. Weld Lines
Weld lines are plastic flow traces that resemble the letters J or U. This defect occurs when two fronts flow from different directions meet, resulting in weak regions in the component [18].
3.2.2. Shrinkage
Shrinkage is the reduction in volume caused by polymer cooling. Inconsistent contraction due to temperature variations in the various regions of the part causes shrinkage [19]. Despite its common occurrence, excessive shrinkage can cause geometric errors in plastic parts.
The shrinkage can be expressed using equation (1), [20]:
12 |
where s is the shrinkage, d is the cavity width, and is the part’s width. The i subscript indicates the sensor’s position. Using different sensors, temperature and pressure can be measured locally to calculate the overall shrinkage of the part.
Figure 3 : Transmission scheme of data extracted from cavity sensors.
3.2.3. Warpage
Warpage occurs when internal forces cause a part to bend and deviate from its original geometry. Warpage, as is shrinkage, is induced by uneven part contraction and ongoing cooling after ejection, which causes parts with slower cooling rates to bend [19].
3.2.4. Sink Marks
Sink marks appear on surfaces with substantial wall thickness on the opposite side [18]. Such defects could occur due to fluctuations in cavity temperature, in addition to variations in other process factors including cooling time and packing pressure [21].
3.3. Sensor Selection
Mold sensors monitor numerous parameters inside the cavity, including pressure and temperature. This work considers sensors that take into account both defects and part geometry. To avoid damaging the mold during installation, two sensors are proposed: a wireless piezoelectric sensor and an ultrasonic sensor.
3.3.1. Wireless Piezoelectric Sensors
These sensors monitor pressure by transmitting energy from melt pressure, which also powers them [12]. An energy converter converts mechanical energy from the melt into electrical energy. The energy converted is expressed as follows:
where C is the total capacitance, is the charge constant, P is the pressure acting on the piezoceramic ring, is the footprint area where the pressure is acting, and n is the number of piezoceramic rings. For instance, electric charge is generated under mechanical stress induced by melt pressure. The resulting charge can be expressed as the product of the pressure acting on the ring, the footprint area over which the pressure is acting, and the charge constant. The electrical behavior of the piezoelectric rings can be approximated as a parallel plate capacitor. The ratio of the charge over the total capacitance of the system models the voltage generated, and it is related to the square root of the energy as expressed in equation 2.
The resulting electrical energy is discretized into electrical pulses using a threshold modulator. A signal transmitter converts the pulses into ultrasonic waves, which are subsequently delivered to a receiving unit outside the cavity.
3.3.2. Ultrasonic Sensors
Ultrasonic sensors are non-destructive and can measure parameters including melt homogeneity, temperature, and thickness [7]. Ultrasonic transducers use the converse piezoelectric effect to propagate ultrasonic waves [22]. Equations (2), (3), and (4) indicate how longitudinal ultrasonic velocity can be related to pressure and temperature using specific volume [23].
where is the longitudinal ultrasonic velocity, is the density of the polymer melt, and κ is the adiabatic compressibility expressed as:
where P is the melt pressure, T is the melt temperature, cp is the specific heat capacity, and 𝜈 is the specific volume described by the Tait equation as [23]:
where is the zero pressure isotherms, B(T) is a temperature dependent function, and C= 0.0894 is a universal constant [24].
As the melt temperature increases, the sound velocity decreases in an approximately linear manner. On the other hand, increased melt pressure drives sound velocity to higher levels.
3.4. Data Transmission
13 |
Given the sensors used, the data acquisition scheme is based on the transmission of ultrasonic waves, allowing wireless communication between the transmitter and receiver [25]. To illustrate, when cavity parameters are monitored, they are transformed into a voltage, which is then discretized into pulses using a threshold modulator [12]. The pulsing voltage causes the piezoelectric material to be displaced, resulting in ultrasonic waves [22]. These waves can travel through the mold’s walls. Then they are received by an external receiver, which turns them back into voltage. The cavity measurements are recovered by multiplying the number of received ultrasonic pulses by the modulator’s threshold. To display and save the measurements, a data acquisition module (DAC) can be employed to transform the analogue signal to a digital one. Figure 3 shows the overall transmission scheme.
- B. P. Federation, “Plastics applications,” British Plastics Federation. [Online]. Available: https://www.bpf.co.uk/plastipedia/applications/Default.asp
- M. Naik, “5 ways plastics revolutionized the healthcare industry,” MPO Magazine, Oct. 09, 2017. [Online]. Available: https://www.mpo-mag.com/exclusives/5-ways-plastics-revolutionized-the-healthcare-industry/
- K. Pulidindi and K. Ahuja, “Injection molded plastics market size, growth report – 2032,” Global Market Insights Inc. [Online]. Available: https://www.gminsights.com/industry-analysis/injection-molded-plastic-market
- G. Berger-Weber and S. S. Aminabadi, “The injection mold as a cyber physical system: Using simulation to train its artificial intelligence,” in Proc. 29th Leoben Kunststoffkolloquium, Leoben, Austria, vol. 29, pp. 1–10, Sep. 2021.
- J. Krantz et al., “In-mold rheology and automated process control for injection molding of recycled polypropylene,” Polym. Eng. Sci., vol. 64, no. 9, pp. 4112–4127, Jun. 2024, doi: 10.1002/pen.26836.
- M. Baum, D. Anders, and T. Reinicke, “Enhancing injection molding simulation accuracy: A comparative evaluation of rheological model performance,” Appl. Sci., vol. 14, no. 18, p. 8468, Sep. 2024, doi: 10.3390/app14188468.
- T. Ageyeva, S. Horváth, and J. Kovács, “In-mold sensors for injection molding: On the way to Industry 4.0,” Sensors, vol. 19, no. 16, pp. 1–21, Aug. 2019, doi: 10.3390/s19163551.
- B. Silva, J. Sousa, and G. Alenya, “Machine learning methods for quality prediction in thermoplastics injection molding,” in Proc. Int. Conf. Electr., Comput. Energy Technol. (ICECET), Cape Town, South Africa, pp. 1–6, Dec. 2021, doi: 10.1109/ICECET52533.2021.9698455.
- G. Gordon, D. O. Kazmer, X. Tang, Z. Fan, and R. X. Gao, “Quality control using a multivariate injection molding sensor,” Int. J. Adv. Manuf. Technol., vol. 78, no. 9–12, pp. 1381–1391, Jan. 2015, doi: 10.1007/s00170-014-6706-6.
- V. Vara, “The benefit of pressure sensor in injection moulding,” Efficient Innovations. [Online]. Available: https://www.efficientinnovations.in/the-benefit-of-pressure-sensor-in-injection-moulding/
- A. Schott et al., “Development of thin-film sensors for in-process measurement during injection molding,” Procedia CIRP, vol. 120, pp. 619–624, Jan. 2023, doi: 10.1016/j.procir.2023.09.048.
- L. Zhang et al., “A self-energized sensor for wireless injection mold cavity pressure measurement: Design and evaluation,” J. Dyn. Syst. Meas. Control, vol. 126, no. 2, pp. 309–318, Jun. 2004, doi: 10.1115/1.1767850.
- A. S. Babalola, “Design and construction of a sensor analytic system for the monitoring of the parameters of a plastic injection mould,” Front. Eng. Built Environ., vol. 1, no. 1, pp. 32–40, May 2021, doi: 10.1108/FEBE-02-2021-0003.
- A. Bur and C. Thomas, “An optical sensor for polymer injection molding,” Electrochem. Soc. Trans., 2000. [Online]. Available:.https://tsapps.nist.gov/publication/get_pdf.cfm?pub_id=851715
- T. E. P. Gomes et al., “Development of an Open-Source Injection Mold Monitoring System,” Sensors, vol. 23, no. 7, p. 3569, Mar. 2023, doi: 10.3390/s23073569.
- R. M. C. Bernardo et al., “Instrumentation and In-mould Data Acquisition System for Injection Moulding Process,” 2023 4th Int. Conf. Artif. Intell., Robot. Control (AIRC), Cairo, Egypt, 2023, pp. 53–57, doi: 10.1109/AIRC57904.2023.10303047.
- O. Haberchad and Y. Salih-Alj, “A cavity data acquisition system for defect prevention in injection molding,” in Proc. 10th Int. Conf. Appl. Syst. Innov. (ICASI), Kyoto, Japan, pp. 244–246, 2024, doi: 10.1109/ICASI60819.2024.10547795.
- B. Olmsted and M. Davis, *Practical Injection Molding*, 1st ed. Boca Raton, FL, USA: CRC Press, 2001, pp. 1–232, doi: 10.1201/9781482294590.
- N. Zhao et al., “Recent progress in minimizing the warpage and shrinkage deformations by the optimization of process parameters in plastic injection molding: A review,” Int. J. Adv. Manuf. Technol., vol. 120, no. 1–2, pp. 85–101, Feb. 2022, doi: 10.1007/s00170-022-08859-0.
- S. Jiang et al., “Reducing the sink marks of a crystalline polymer using external gas-assisted injection molding,” Adv. Polym. Technol., vol. 2020, pp. 1–8, Feb. 2020, doi: 10.1155/2020/3793505.
- M. Kariminejad et al., “Ultrasound sensors for process monitoring in injection moulding,” Sensors, vol. 21, no. 15, pp. 1–22, Jul. 2021, doi: 10.3390/s21155193.
- V. Speranza, U. Vietri, and R. Pantani, “Monitoring of injection moulding of thermoplastics: Adopting pressure transducers to estimate the solidification history and the shrinkage of moulded parts,” Strojniški Vestn. – J. Mech. Eng., vol. 59, no. 11, pp. 677–682, Jul. 2013, doi: 10.5545/sv-jme.2013.1000.
- K. Straka et al., “To the measurement and influences of process parameters variations on the axial melt temperature profile in the screw chamber of an injection molding machine,” in Proc. SPE ANTEC, Anaheim, CA, USA, pp. 1645–1651, May 2017.
- B. Praher et al., “Ultrasound based monitoring of the injection moulding process: Methods, applications and limitations,” AIP Conf. Proc., pp. 159–162, Jan. 2014, doi: 10.1063/1.4873755.
- Y. Li et al., “An optimal design method for improving the efficiency of ultrasonic wireless power transmission during communication,” Sensors, vol. 22, no. 3, p. 727, Jan. 2022, doi: 10.3390/s22030727.
- “How to estimate injection molding cost?,” Formlabs. [Online]. Available: https://formlabs.com/global/blog/injection-molding-cost/
- J. Tinz, T. De Ancos, and H. Rohn, “Carbon Footprint of Mechanical Recycling of Post-Industrial Plastic Waste: Study of ABS, PA66GF30, PC and POM Regrinds,” Waste, vol. 1, no. 1, pp. 127–139, Dec. 2022, doi: 10.3390/waste1010010.