Electric Transmission from Sarawak to Singapore Using Cable Suspended within O&G Pipes

(This article belongs to the Section Electrical Engineering (ELE))
Export Citations
Cite
Karunakaran, P. , Oaman, M. S. , Maaji, S. S. and Sung, C. C. (2025). Electric Transmission from Sarawak to Singapore Using Cable Suspended within O&G Pipes. Journal of Engineering Research and Sciences, 4(5), 20–33. https://doi.org/10.55708/js0405003
Prashobh Karunakaran, Mohd Shahril Oaman, Salim Sulaiman Maaji and Chee Cheng Sung. "Electric Transmission from Sarawak to Singapore Using Cable Suspended within O&G Pipes." Journal of Engineering Research and Sciences 4, no. 5 (May 2025): 20–33. https://doi.org/10.55708/js0405003
P. Karunakaran, M.S. Oaman, S.S. Maaji and C.C. Sung, "Electric Transmission from Sarawak to Singapore Using Cable Suspended within O&G Pipes," Journal of Engineering Research and Sciences, vol. 4, no. 5, pp. 20–33, May. 2025, doi: 10.55708/js0405003.
Running HV cables within pipes has been done since the 1970s but not fully utilizing the piping expertise developed by the O&G industry since 1859. The O&G industry has laid pipes on the seabed over a vast area north of Sarawak. This research studies the feasibility of utilizing this available industry to send power from Sarawak to Singapore. A HV cable will be suspended at the center of O&G pipes pumped with air at 7 amt. Another pipe will return the air back to Sarawak to be cooled and recycled. This will simulate the higher power transmission capability of overhead lines compared to submarine cables. The media is currently broadcasting that a submarine cable will send power from Sarawak to Singapore. But without thermal dissipation for the Joule heating generated over the 700 km cable, there will be reduced efficiency and a higher probability of failure. The lab experiment done was to send 0 – 50A, in steps of 5A, in a cable suspended at the center of pipes of varying Ø. The eddy current generated heat on the pipe was measured. This data is then extrapolated to forecast if 1000 A is sent in a Ø = 2m pipe.
1. Introduction
1.1. Current plan and associated challenges
The current plan which was broadcasted in the media is to send electricity from hydroelectricity power rich Sarawak to Singapore via a 700 km long HVDC (High Voltage Direct Current) XLPE (cross-linked polyethylene) insulated submarine cable.
But Table 1 indicates a significantly higher capability of bare overhead (O/H) lines in power transmission compared with XLPE insulated submarine cables.
The current longest XLPE submarine cable in the world today is between Norway and the Netherlands which is only 580 km and 700 MW. Comparatively the current longest O/H cable is 2,375 km, 7,100 MW, bare aluminum in Brazil between Madeira to Rio de Janeiro [1]. Therefore, the O/H line in Brazil is 409% longer than the XLPE insulated submarine cable in Norway
Table 1: A comparison of the transmission capability of HDPE covered cable versus bare O/H lines
Longest submarine cable | 580 km, 450 kV, 700 MW |
Longest bare O/H line | 2,375 km, 600 kV, 7,100 MW |
$$\frac{2375}{580} \times 100 = 409\% \ \text{longer}$$
$$\frac{7100}{700} \times 100 = 1014\% \ \text{more power}$$
And the power carrying capacity of the O/H line in Brazil is 1014% higher than the submarine cable in Norway.
The figure mentioned in the media for the currently proposed XLPE insulated submarine cable is 6 billion USD while the O&G (Oil & Gas) piping contractor who was consulted in Bintulu, Sarawak estimated that the CIP (Cable in Pipe) system proposed in this research will cost MYR 1 billion (USD 213 million) which is 2,816% cheaper than the XLPE submarine cable method.
$$\frac{6000000000}{213000000} \times 100 = 2,816\%$$
The reason for the low power carrying capacity of XLPE cables is that there is no vent for the heat generated as electrons encounter resistance in the cable because it is covered by a significant amount of XLPE insulation which traps heat within the cable. Electricity flow in a conductor is due to electron flow within the conductor and the greater longitudinal flow versus lateral flow, the lower the electrical resistance as well as heat generated. Higher insulation over the conductor causes higher lateral flow in the conductor which produces more heat and therefore eventually even more lateral flow. In superconductors the electron flow does not scatter, which explains its zero resistance.
Fig. 1 is an observation from the experiment described in the methodology of this paper. It can be noticed from the infrared image that the PVC insulated portion of the cable is white color which is the maximum heat measurable by the infrared camera as depicted in heat legend at the right of the image. The portion of the cable which is stripped of the PVC (therefore bare Cu) is green to yellow in color which is cool according to the legend. In this experiment, 63 A was sent in a bundle of 4 X 2.5 mm2 cables. Each 2.5 mm2 cable can carry 21 A, therefore 4 X 2.5 mm2 can carry 21 X 4 = 84 A, but is carrying 63 A in this experiment. Wires will experience significant temperature increases due to Joule heating when the current it is carrying is close or above the current carrying capacity of the cable.
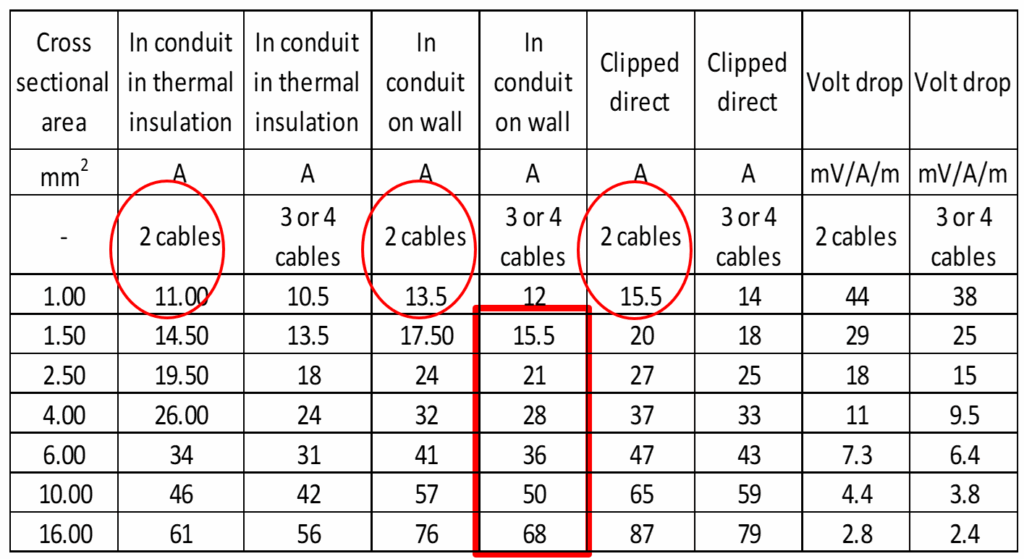
Another indicator that covering cable with a high dielectric strength material reduces the current carrying capacity is shown in Table 2 which is the table published by The Institution of Engineering and Technology (IET) and is used by wiremen to decide which cable to use in most Commonwealth countries. Three red circles are drawn on the three columns, the first of which is where two cables are in a conduit within thermal insulation meaning the conduits are buried in cement walls. The second red circle is on the column where the two cables are in a conduit fixed on a wall and the third red circle is on the column where the cable is directly clipped on the wall. The insulation surrounding the conductor is highest in the first of these columns, second highest in the second column and least in the third column. Therefore, it can be noted that the current carrying capacity is inversely proportional to the amount of insulation around the cable increasing from 11 A, 13.5 A to 15.5 A [2].
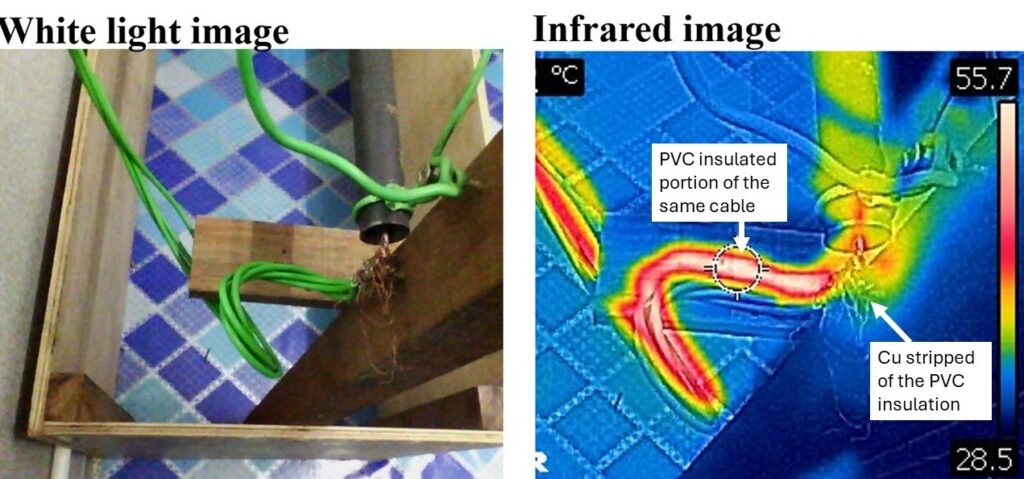
Table 2: The IET table used in deciding which wireman use to determine wire size
1.2. Brief description of solution worked upon in this work
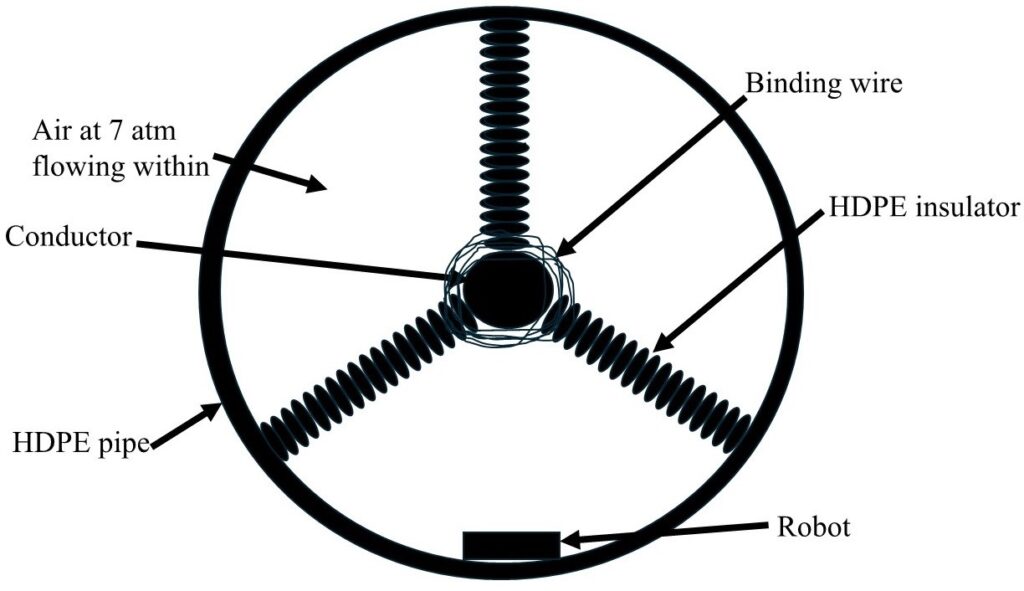
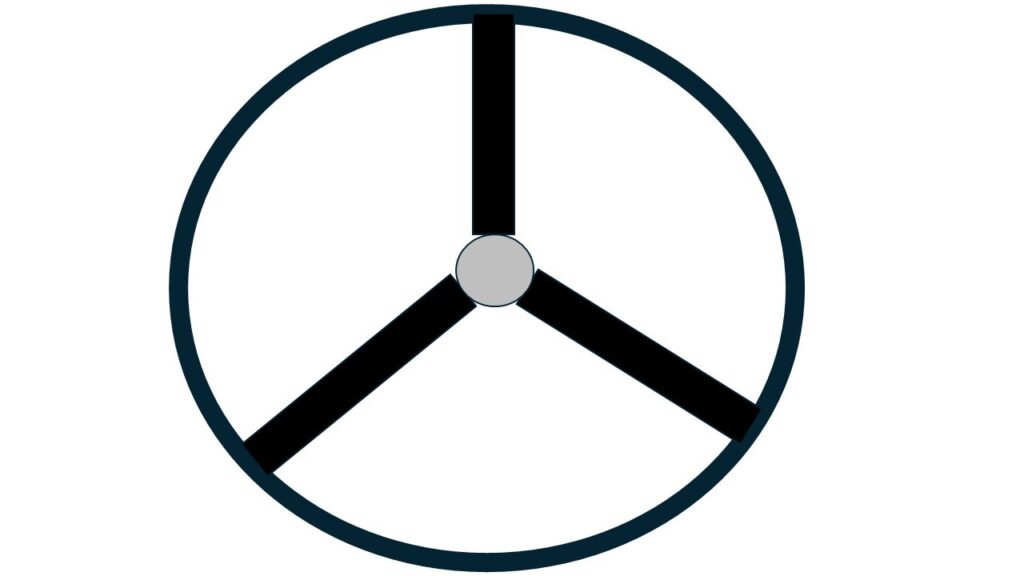
It is possible to simulate O/H conditions under the sea following the schematic of Fig. 2. Each O&G pipe is 11.5 m. Binding wire can be used to fasten the conductor to the three insulators at the star point. Air at 7 atm can be pumped within the pipe and a second pipe will send the air back to Kuching to be cooled and recycled in the pipe with the conductor. This is a hypothesis, but it might be necessary to send the higher dielectric strength and less combustible N2 within the pipe. The cheaper air (78% N2) must be tried prior to using N2. It must be noted that the highest pressure for gas in O&G pipes is 197.4 atm. Therefore if 7 atm does not provide sufficient dielectric strength, the pressure can be increased up to 197 atm.
The purpose of the robot in the figure is to enable human operators to view what is happening within the pipe via a camera. These robots will be energized by harvesting electromagnetic energy from the power line.
2. Literature review
According to Wong, J. (2025, February 28) article in the Borneo Post newspaper article, the proposed XLPE submarine cable between Sarawak and Singapore is carrying 1GW. This will require a 500 m2 (0.0005 m2) aluminum (ρ = 2.65 X 10⁻⁸) at 1 GW (1000 A X 1000 kV):
$$P = VI \tag{1}$$
$$1 \, GW = (1000 \, kV) I$$
$$\frac{1 \times 10^{9} W}{1 \times 10^{6} V} = I$$
$$I = 1000 \, A$$
The resistance in a conductor follows equation (2) and the heat or Joule heating of the conductor follows equation (3).
$$R = \frac{\rho L}{A} \tag{2}$$
$$R = \frac{2.65 \times 10^{-8} \times 700 \, km \times 1000 \, m}{0.0005 \, m^{2}}$$
$$R = 37.1 \, \Omega$$
$$P_{loss} = I^{2}R \tag{3}$$
$$P_{loss} = 1000^{2}(37.1)$$
$$P_{loss} = 37,100 \, watt$$
$$P_{loss} \approx 37 \, kW \quad (1 \, kW = 1 \, kJ \, \text{per second})$$
Therefore, for every 1000 A sent to Singapore, 37 kilojoules per second will be lost, or 0.004% of the energy is emitted by the Al cable as heat every second.
$$\frac{37 \, kJ}{1 \, GJ} \times 100\% = 3.7 \times 10^{-3} \approx 0.004\%$$
The problem is that at 1000 kV, the chance of dielectric breakdown through the XLPE is much higher. This means the thickness of the XLPE must be increased but when this thickness is increased, the heat is further trapped within the XLPE cable. Assuming the worst-case scenario of no heat escaping the XLPE covered cable, which is a reasonable assumption because at 1000 kV in the Al cable, that much plastic insulation is required to prevent arching to the 0 V sea water. With this assumption, the magnitude of heat trapped within the 700 km cable over a year will be:
$$37 \, \tfrac{kJ}{s} \times 60 \, \text{seconds} \times 60 \, \text{minutes} \times 24 \, \text{hours} \times 365$$
$$Energy \, build \, up \, per \, year = 1.16 \times 10^{12} \, J$$
$$= 1160 \, \tfrac{GJ}{year}$$
It must be noted that it takes 150 kJ/kg to melt XLPE and 390 kJ/kg to melt aluminum. Therefore, it is possible the cable may even melt if electricity is sent through it from Kuching to Singapore.
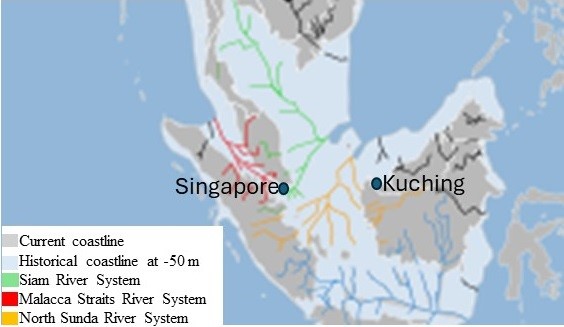
Another important factor comparing the Norway-Netherlands line to the planned Kuching-Singapore line is that Norway is one of the coldest countries on earth with an average ocean bed depth of 2000 m and temperatures of 1−2 °C throughout winters and summers. Comparatively the Sunda Shelf as depicted in Fig. 3 between Kuching and Singapore is one of the shallowest seabed on earth with an average depth of 50 m and temperature of 23.6 °C. The Sunda Shelf was created after an ancient global warming event that impounded the Sunda Shelf (1.85 million km2 in surface area), which separated Borneo from the rest of Asia; this is why it is one of the shallowest seas on earth, with much of it being only 20 m deep [3].
All the above data listed so far in this paper indicates that it is better to simulate O/H line conditions for the power link between Kuching and Singapore. This can be achieved via suspending the bare conductors in O&G pipes as shown in Fig. 2.
One of the arguments for using the standard XLPE submarine cable is that large companies like Siemens are supporting it and if they build it, they must wager the reputation upon it. But the current cable builder is not from any of the largest electrical equipment suppliers on earth, which are GE Vernova, Siemens, ABB and Schneider.
Underground (U/G) cables are banned in Thailand. Therefore, the prevalence of overhead lines alongside dense telecommunication lines on poles are a notable characteristic of Thailand’s utility infrastructure. But despite that ugliness, Thailand has the cheapest internet access in Southeast Asia (SEA).
One Telco technician informed this author that in Kuala Lumpur where it often floods in the tunnels they used to carry telecommuting fiber optic cables, electronic switches are frequently covered with water which damages them. Because of this, customers who were promised a certain GB of data transmission will get only a fraction of it. Such a scenario would not occur in Thailand with O/H lines. It is also much easier to maintain O/H lines. Digging with excavators for underground cable repair often results in roads and pavements that are never fully restored to their original condition.
Another significant aspect of the proposed submarine cable from Sarawak to Singapore is its historical context: advertisements for the Bakun Dam, widely publicized in local papers since the 1970s, consistently featured a corresponding submarine cable. In 2009, this author inquired with a senior manager of the local electrical authority (LEA) about the fate of that line. He responded that the LEA’s extensive research concluded significant power loss would occur by the time the line reached Johor which is about 1 km from Singapore (Peter Ngaim, personal communication, June 21, 2009).
A concern expressed about this CIP system is that there may be leaks of sea water into the pipe. But the O&G industry has long developed pipes to handle 7 atm of pressure of oil or gas. A leak of sea water into the pipe will cause an earth fault (E/F) and the protection system will trip the line from Sarawak to Singapore. The only consequence may be a tripping of power in Singapore which will not be considered a big issue by the 8.1 billion people on earth today. Other power stations in Singapore, Malaysia or Indonesia can easily back up the loss power in a short span of time.
Comparatively a leak of oil or gas out of an O&G pipe will cause international headlines in all news media and even a large company like Shell plc’s stock market value will plummet as explained by a manager in Shell plc, [Karunakaran Praveen, personal communications, 26/1/2022]. Therefore, the risk of a leak is far greater for the O&G industry compared to the electric companies planning to send electricity from Kuching to Singapore.
This much lower tolerance for failure for the O&G industry has resulted in a long continual development of the integrity of O&G pipes, which can be trusted to a very high percent for the designed purpose in this research.
The Life Cycle Assessment (LCA) using the cradle-to-grave methodology of pumping the pipe with N2 can be significantly high therefore it is better to try using 7 atm of air for a few km of CIP (Cable in Pipe) before expanding it to 700 km.
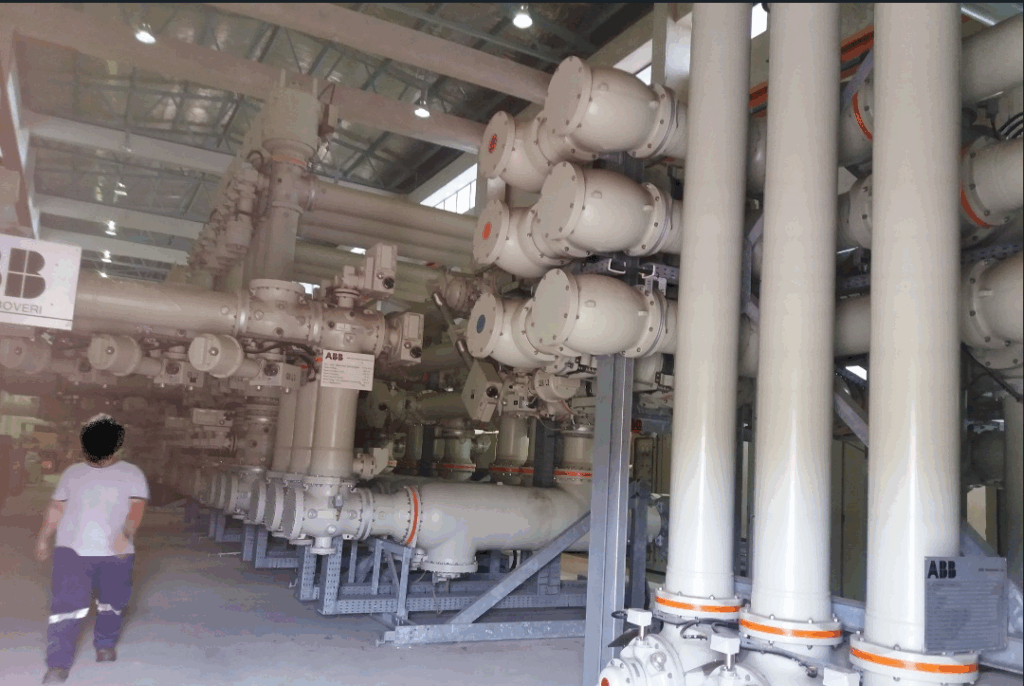
A CIP method of transmitting power is already commonly used in GIS (Gas Insulated Substation). Fig. 4 depicts the GIS substation in Bintulu, Malaysia. The cost is high probably because it was totally designed by the electric power industry and not utilizing the long expertise in the piping field of the O&G companies. GIL (Gas Insulated Lines) lines have been developed since the 1970s.
In AIS (Air Insulated Substation) the high voltage cables need a specific separation distance which is proportional to their voltage level. Therefore, in places like Tokyo or Hong Kong where land prices are extremely high, it is worth it to use GIS substations where GIL enables placing the HV (High Voltage) lines closer to each other, thereby saving cost of real estate. The pipes in GIL lines are pumped with a mixture of N2 and SF6.
GIL lines, specifically manufactured by Siemens, are also used to send HV power down coal mines where the tunnels are not big enough to provide suitable separation distance between the HV phase lines and the humans. Similarly in hydroelectricity power stations, the turbines must be located very low since they are tapping the power of gravity. From the turbine, a shaft from it turns the generator rotor. But this shaft cannot be too long because it will break due to the torsional forces acting on it. But power from the generators must be sent to the top surface if AIS substations need to be used. Therefore, many hydroelectric power stations place the generator just above the turbine and use GIL lines to send power to the AIS substations located at the top of the dam. As for electricity transmission, the current longest GIL line is from Suzhou to Taizhou in China, which is 5.5 km at 1000 kV [4].
The oil and gas (O&G) industry has a long history of laying pipelines off the coast of Sarawak. During a visit to an O&G piping vendor’s office in Miri, this author observed a large map of Sarawak’s offshore area displaying detailed pipeline routes. The extensive network of pipes visually appeared to cover an area larger than Sarawak’s landmass, underscoring the vastness of the subsea infrastructure. While the majority of these pipes are constructed from carbon steel, a small proportion are made of High-Density Polyethylene (HDPE). These pipelines commonly transport oil and gas at pressures in the tens of atmospheres (e.g., 10-100 atm) in shallow waters (less than 500 meters deep), with pressures in deepwater applications (over 1500 meters deep) potentially reaching hundreds of atmospheres, and in specialized cases (such as high-pressure well flowlines), even exceeding 800-1000 atmospheres (Soegiarto, Bennet, personal communications, 21/6/2023].
The Georgia Power company, USA provided the results of their study which is that U/G XLPE cables can cost eight times more than O/H lines, has a lifespan of half of O/H lines (35 years for U/G cables versus 80 years for O/H), repair time of 192 hours (> one week) compared to three hours for O/H lines. While their advantages are only beauty and ability to withstand typhoons better [5].
Other than being a university lecturer, this author is a lecturer of electrical engineering for electrical contractors. The government requires the contractors to attend such courses to get points to renew their contractor licenses. Once as he was teaching all the top electrical contractors in the second biggest city in Sarawak, Malaysia where he mentioned all the above results from Georgia Power company, USA. All the contractors agreed but the largest contractor company owner raised his hand to say that there is one advantage for U/G cables which is that he makes a lot of profit if he uses U/G cables. At eight times the price for U/G cables, 20% profit of 100 million is surely less than 20% profit of 800 million.
The Paschen Curves are commonly used to determine the relationship of pressure (in Torr) and the distance between electrodes for different gases [6]. Using SF6 for the CIP project, as is currently widely used as a dielectric in the electric industry, is impractical because it has the highest global warming potential (GWP). SF6 is also an infrared (IR) absorber. It is because of these facts that the electric industry is currently finding an alternative to SF6 due to environmental concerns [7]. Studies have shown that the highest dielectric strength is achieved by a mixture of 60% SF6 and 30% N2 [8]. N2 is an inert and environmentally friendly gas which comprises 78% of the current atmosphere. Between 1970 – 2000, GIL used 100% SF6 as the dielectric. From 2000 – 2024 a mixture of SF6 and N2 has been used in GIL. Currently synthetic gases are being developed to be the dielectric for GIL because of the global warming potential of SF6. SF6 will only break up in the atmosphere after 3200 years compared to 650 years for CO2 [9].
Table 3 shows the dielectric strength of various materials of interest to this topic. Distilled water seems to have a much higher dielectric strength than SF6 and it is liquid which is easier to prevent leaks from pipes holding it but it has been proven in labs that when 50 kV is in the cable, even distilled water can electrolyze into H2 and O2 which is an explosive mixture near possible arcs in the pipes so that is not a viable material to be within the pipe [10].
Table 3: Dielectric strength of various materials
Material | Dielectric strength in MV/m |
Air | 3 |
SF6 | 9.8 |
N2 | 3.92 |
Distilled water | 70 |
Benzene | 163 |
Vacuum (200µPa) | 40 |
Polypropylene (PP) | 22 |
XLPE | 27 |
CH4 | 3 |
A question may be asked, that to keep things as similar as possible to the O&G industry, can methane (CH4) be used as the dielectric. But this is impractical because methane is very flammable, and arcs formation is a possibility from a 1000 kV conductor. Table 3 shows that benzene has a high dielectric strength but is also too explosive.
Vacuum also has good dielectric strength, but it is hard to maintain a vacuum. Besides the pipe may collapse, the material in the pipe must have a higher pressure than the bottom of the Sunda shelf. A related information is that VCB (Vacuum Circuit Breaker) are only used for medium voltages like 11 kV or 33 kV and not for HV because of the possibility of leakage into the contact separation chamber especially via the seals of the moving contact. The third last material in Table 3 is PP (polypropylene plastic) with a dielectric strength of 22 has been used since the beginning of the electric industry and is gradually being replaced with XLPE because of the higher dielectric strength (27 from Table 3).
Therefore, the cheapest option is air and if the dielectric strength is insufficient, N2 is the next best option. The difference in dielectric strength between N₂ and air is relatively small, but air has O2 which can combust while N2 is generally considered a non-combustible gas. It must be noted that O/H lines carry up to 1000 kV with separation distance between lines at about 15 m [11]. But at 7 atm the separation distance will be:
$$\frac{15m}{7 \, atm} = 2.14 \, m$$
That is between a line carrying 1000 kV to another line carrying 1000 kV. From 1000kV to 0V which is at the pipe’s surface (sea water), the separation distance can reduce to half, or:
$$\frac{2.14 \, m}{2} = 1.07 \, m$$
Therefore, a pipe of 2 m diameter would be sufficient if 7 atm air is used as the dielectric.
The least flammable gasses are the Noble gasses, (He, Ne, Ar, Kr, Xe and Rn) [12]. But they are expensive to procure at such high amounts. Comparatively, N2 is considered non-flammable because it cannot sustain combustion on its own even at extremely high temperatures, which a 1000 kV electric arcs can create. The reason is that the triple bond between the two N is very strong. A tremendous amount of energy is required to break this bond. At very high temperatures and pressure the triple bonds between the two N can be weakened enough to participate in chemical reactions as in the Haber process where NH3 is formed [13].
The advantage of joining the grids of these countries is to enable sharing of power. Similarly, Europe decided to utilize intermittent renewable energy as much as possible therefore the ENTSO-E (European Network of Transmission System Operators for Electricity) was joined and locked at 50 Hz and generates 670 GW [14]. With such a large grid, in case there is a sudden no wind situation over the large wind farm north of the UK, solar farms in Spain can back it up. So, if there is an ASEAN grid, a sudden cloud cover over a solar farm in Malaysia can be backed up by geothermal energy from Indonesia.
The ENTSO-E has a spinning reserve of 80 GW [15]. The spinning reserve can be explained as the pressing of the accelerator of the combustion engine a little extra. In case there is a sudden lack of supply compared to demand (as when there is a sudden cloud cover over a large solar farm or a sudden no wind situation over wind farms), extra DC is sent to the rotor of the rest of the generators, and immediately extra AC comes out of the stator coils. But with the extra DC in the rotor, it becomes a stronger electromagnet, the stator coils will also have extra AC current which also makes it a stronger electromagnet. This extra electromagnetic force attracting the rotor and stator will slow down the rotor from 50 Hz which will cause the protection system to trip the grid. But since the accelerator in this power station is already being pressed extra, there is enough mechanical power to make the rotor turn at 50 Hz despite the higher attraction between the rotor and stator. The speed of the rotor is controlled by the governor.
The reason the protection system must trip the grid when the rotor slows (frequency reduces) can be explained as two generators with three coils in the stator, namely the L1, L2 and L3 coils. When the rotor electromagnet passes L1 coil in one generator, the AC waveform for L1 wire will be its peak voltage. But if at that moment in the other generator, the electromagnet passes the L2 coil instead of L1, this generator will have the AC wave at below 0 V. But in the grid, L1, L2 and L3 wires are joined with 275 kV cables, therefore the first generator will have a peak voltage of:
$$\frac{275 \, kV}{0.707} \approx 388 \, kV$$
The second generator will have a voltage of about -30 kV. Therefore, the 275 kV O/H lines will have +388 kV from one generator and -30 kV from the second generator, therefore the wire will experience:
$$+388 \, kV – (-30 \, kV) = 418 \, kV$$
This will blow up the smaller of the two generators. This means if in one generator, the rotor passes L1 coil, it must pass the L1 coil in all generators in the grid. This is called synchronizing of all generators.
The above scenario is true if all the generators are ICE (internal combustion engine) or coal steam turbines where the rotors turn at 50 Hz. But if the generator is hydroelectric, the rotation speed is slower than 50 Hz, therefore less poles in the stator are used to overcome it. Gas turbines on the other hand spin at a much higher speed than ICE, therefore more poles in the stator are used. But AC waves in all the generators must be synchronized before they can be joined to the grid. To understand this, it is useful to relate it to the formula for generators which is:
$$n_{S} = \frac{120f}{p} \tag{4}$$
where 𝑛𝑆 = speed of the generator in RPM, f = frequency, p = number of poles.
Spinning reserve isn’t solely for sudden drops in wind or solar generation; it’s also crucial for maintaining grid stability during other unforeseen events, such as unexpected generator outages or transmission line failures. It is a must in case a power generating engine trips anywhere in the grid. The missing power from that generator cannot be just absent, it must be backed up and this is done by increasing the DC in the rotor solenoids in all the other generators and immediately extra AC comes out of the stator coils. In Sarawak, the spinning reserve or the extra pressing of all the accelerators is 30% of the total power output.
Malaysia’s largest state, Sarawak, is a hydroelectricity hub due to its equatorial location, which ensures high and consistent rainfall, and the mountains along its Indonesian border. These two key factors for hydroelectric power—ample water flow from the abundant rain and significant head (height) from the terrain—are particularly pronounced in Sarawak. The state receives an average of 157 inches of annual rainfall, five times the 31-inch average of temperate countries. Sarawak’s mountainous border with Indonesia makes it a rarity among equatorial nations, unlike Congo, Gabon, and Brazil, which lack similarly extensive elevated regions. Tanzania and Kenya are equatorial anomalies of a different kind; likely affected by the same factors that led to the desertification of the Sahara, they receive less rainfall than temperate countries.
Brazil has the third largest hydroelectric dam in the world but half of it is located in Paraguay due to the lack of high mountains in Brazil and half of the profit from the dam goes to Paraguay [16]. It must be noted that hydroelectric dams are the most profitable business in the world. For example, if the Bakun dam produces 2.4 GW and sells its electricity at the rate it sells to households, which is $0.07 per kWh, the profit is:
$$\frac{2400 \, MW \times 24 \times 365 \times 0.07}{1000 \, kW} = \$1,471,680,000$$
This means that ≈ USD 1.5 billion can be made in a year from that dam with an estimated cost of only the labor cost of the few people working on the dam which can easily be covered with about a million USD. Comparatively the few km long LNG (Liquified Natural Gas) plant in Bintulu, Sarawak makes about that much per year but has lots of expenses like purchasing gas and continuously changing parts. One manager of the LNG plant moved to the high-tech industry located in Kuching, Malaysia for 10 years. When he eventually left the high-tech industry to be a contractor for the LNG plant where he previously worked but could not recognize most parts as they were continuously upgraded over time. He eventually gave up on that venture [Ang, Hong Huat, personal communications, 16/2/2019].
Comparatively, a staff of the Batang Ai dam in Sarawak stated that it never failed over the 21 years he worked there and there was no change of parts at all [Dominic Lai, personal communications, 2/16/2015]. Dams are just too simple to fail; it is just water falling down and turning a Francis turbine and a shaft from this turbine goes up to spin a generator’s shaft.
The economic potential of high-water flow was recognized relatively late in Southeast Asia. The construction of the first hydroelectric dam in Sarawak occurred only in the 1980s, a stark contrast to Brazil, which built its first in 1883. This early investment has positioned equatorial Brazil as the world’s second largest hydroelectricity producer, after China.
Beyond its high rainfall and mountainous terrain, Sarawak’s demographics and economic history further support its focus on hydroelectricity. Despite comprising 37% of Malaysia’s land area, it accounts for only 8% of the national population, resulting in a low population density in its resource-rich regions that facilitates dam construction and water impoundment [17].
Historically reliant on timber harvesting and oil palm cultivation, Sarawak faces economic transitions. Timber is a declining industry due to dwindling old-growth forests. While oil palm has been significant, its long-term viability in Sarawak’s elevated, less nutrient-rich soils is questionable. The increased fertilizer costs anticipated in subsequent planting cycles threaten its profitability. Therefore, the abundant and renewable energy potential of hydroelectricity offers a sustainable and increasingly attractive alternative for Sarawak’s economic future.
Therefore, the state government planned to build hydroelectric dams as a future source of income and jobs for the people of Sarawak. While local electric utility staff initially expressed skepticism about power sufficiency, the subsequent availability of hydroelectricity unlocked unexpected economic opportunities. For example, the founder of the Bintulu aluminum factory leveraged World Bank financing due to the renewable power source, achieving remarkable financial success and becoming one of Malaysia’s top five wealthiest individuals.
Despite its long history of oil drilling in Sarawak since 1910 and previous reliance on fossil fuels for its energy needs, Shell plc has adopted the LEA’s electricity (which is 70% hydroelectric) due to the enhanced World Bank loan prospects and improved global profile associated with utilizing renewable energy.
3. Methodology and results
Numerous experiments were done in this research to utilize carbon steel pipes to measure the feasibility of suspending power cables in the middle of such pipes. Eddy current losses on the pipes were measured. But with the latest HDPE pipes, arching or eddy current losses will not be a concern. An O&G piping consultant based in Kuala Lumpur who was consulted about the feasibility of this research was very positive and stated that a HDPE carrying only 7 atm of air or N2 can even last for 100 years [Soegiarto, Bennet, personal communications, 21/6/2023]. He also informed that HDPE O&G pipes are currently being used among a small percentage of pipes laid off the coast of Malaysia. With HDPE pipes, the possibility of arcing to the circumference can easily be eliminated. But this research is done assuming the long-established steel pipes will be used.
The experiments performed for this research is assuming the most economically viable method of transmitting power from Kuching to Singapore is used, which is using an AC cable suspended in an O&G pipe with air at 7 atm pumped within it. The air will be sent in the pipe carrying the electric cable and in Singapore the air will enter another pipe and be sent back to Kuching to be cooled and sent back into the first pipe.
The O&G industry has been using steel pipes since 1859, therefore most of the problems associated with it have been rectified. Using AC, the high cost (including maintenance) of the AC to DC converters can be avoided.
The problem with using steel pipe for this transmission system is that eddy current will be formed on the pipe.
In the experiment done in the lab, current varying from 0 A to 50 A was sent through bare wire of 2.5 mm2 X 4 which is suspended in the middle of steel pipes and the heat generated on this pipe is measured using an infrared camera. Each 2.5 mm2 wire has a current carrying capacity of 21A therefore 4 X 2.5 mm2 can carry 21 X 4 = 84 A. The current applied to the cable was stepped up from 0A to 50 A, with each 5 A increment achieved by energizing additional columns of incandescent bulbs.
To prepare the cable, a length of about 2 m of 2.5 mm2 cable was initially stripped of the PVC insulation by tying one end to a solid metal structure in the lab and using a wire stripper to strip it gradually. Then 4 X 2.5 mm2 bare wires were placed next to each other and tied to the same solid metal structure in the lab. At the other end, the 4 X 2.5 mm2 bare wires were clamped in the chuck of a drill and the drill chuck was clamped fast. Then as the drill is operated, the 4 X 2.5 mm2 wires wound around each other in a tight helix.
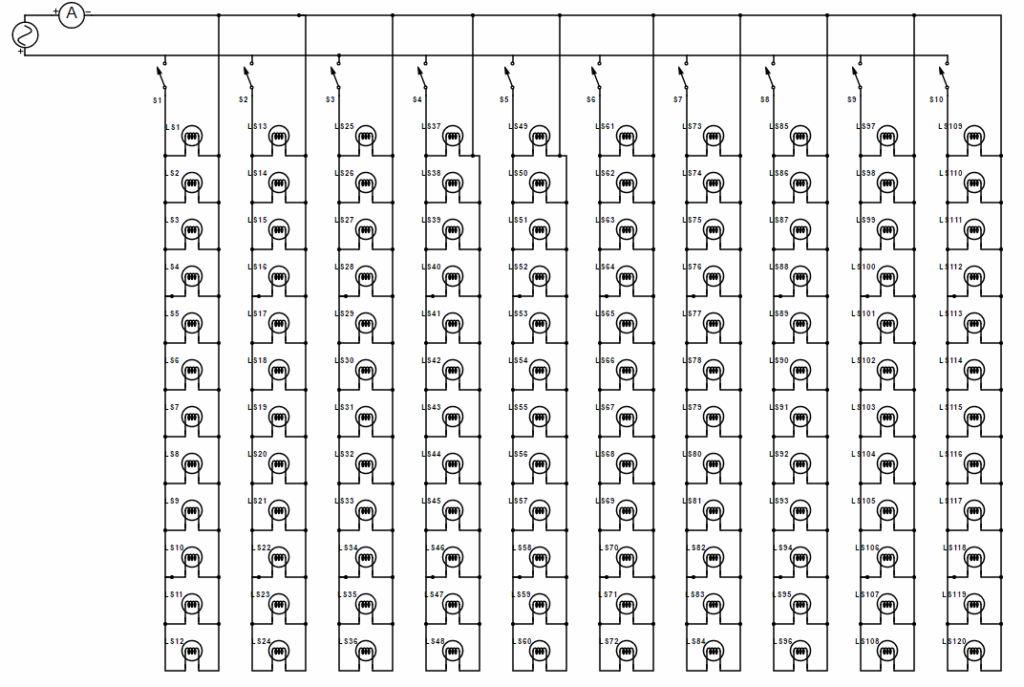
The heat on the steel pipe is measured as the current sent through the cable is varied. Fig. 5 is a schematic of how all the 120, 100W incandescent bulbs are connected and Fig. 6 is its physical appearance. As shown in the schematic of Fig. 5, there is a switch at the top of each column, meaning each column can manually be switched making this setup a current generator to slowly increase current in the 4 X 2.5 mm2 cable and the corresponding heat it generates on the steel pipe surrounding it can be measured and extrapolated. Fig. 7 is the setup to measure the heat on the steel pipe surrounding the cable.
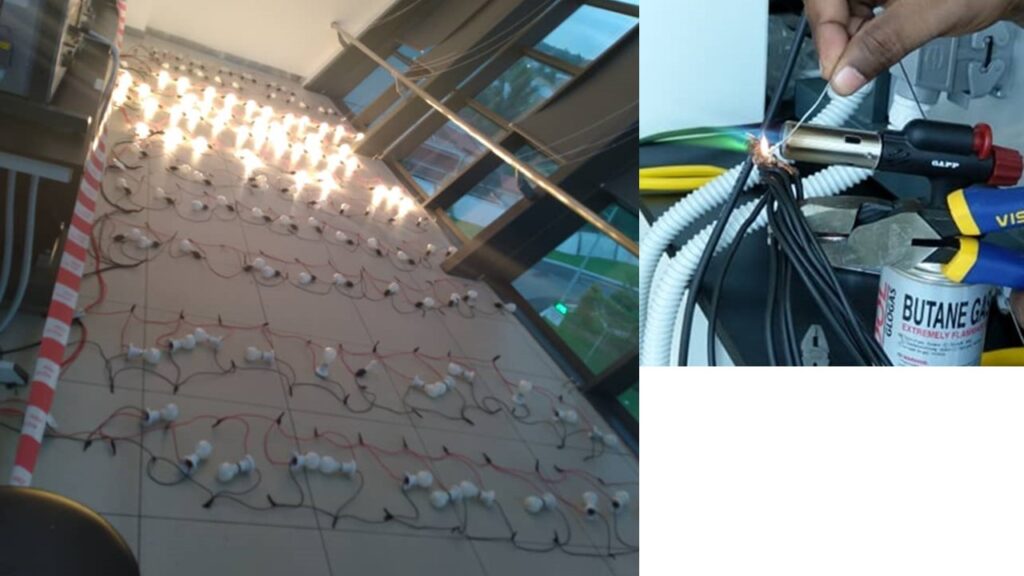
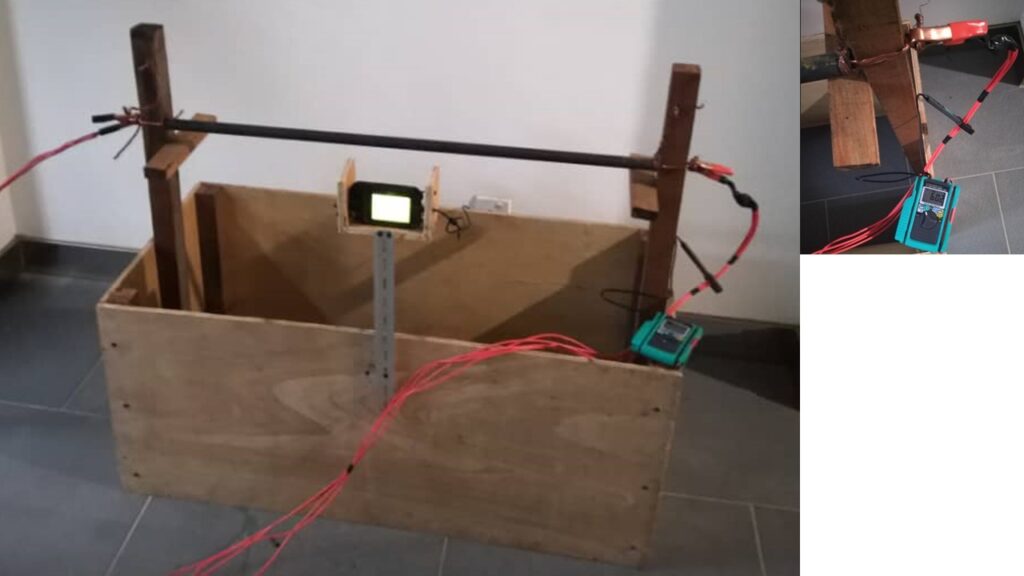
Fig. 6 right image depicts how 8 X 2.5 mm2 wires are soldered. A butane gas flamer was used to heat the wires to solder the joint. Only the end of the joint can be flamed, and the heat will flow down, and it will be hot enough to melt solder wire. If the whole joint is flamed, it was observed that solder will not stick onto the joint. An explanation for this is that the Cu turned to CuO which is light orange in color. It must be noted that heated Cu is one of the most colorful metals ranging from light orange, which will gradually turn to black as it turns to fully CuO and eventually become green as sulfur enters it. This is why the Cu Statue of Liberty in NY is currently green. An electric soldering iron cannot generate enough heat to solder 8 X 2.5 mm2 wire joints. The same method is used in the joining of large wires in the construction of very large motors but using O2 acetylene instead of a butane torch.
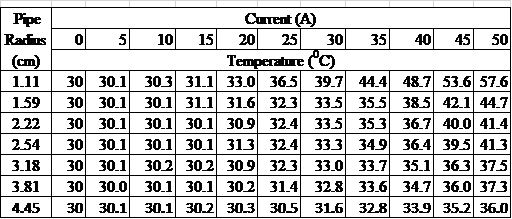
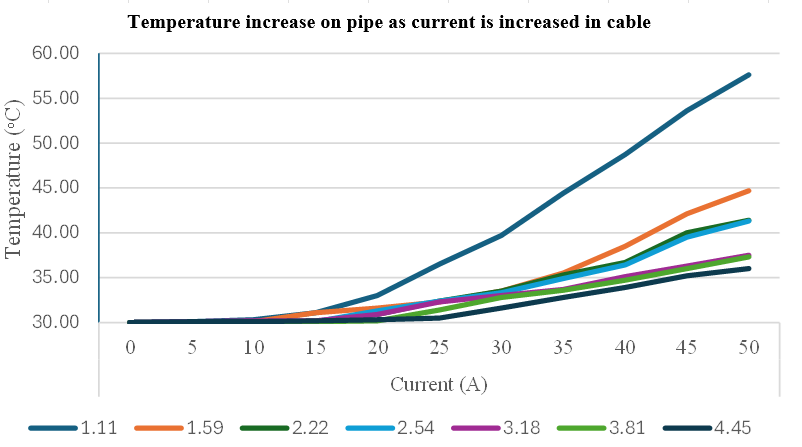
Table 4 is the results obtained, and Fig. 8 are the results depicted as a graph. The legend of the different colors at the bottom of the chart indicates the diameter of the pipes surrounding the bare Cu cable carrying current which was varied from 0 A to 50 A in steps of 5A. Obviously the line graph for the smallest pipe with Ø = 1.11 cm goes straight up indicating it is the hottest and the black line graph has the lowest slope because of the bigger pipe of Ø = 4.45 cm surrounding the conductor. For this pipe, the heat on the pipe just went just 6oC above ambient. Using Excel to extrapolate the temperature rise to 1000 A, the temperature if Ø = 4.45 cm pipe is used will be 187oC. But if the diameter of the pipe is extrapolated to Ø = 2 m with the cable within carrying 1000 A, there will be zero detectable heat or eddy current.
This heat data is extrapolated to 1000 A which is the loading currently suggested in the media for the proposed XLPE submarine cable from Kuching to Singapore.
Table 4: The results of the sending AC current in a cable suspended within a pipe
Some other researchers, even IEEE reviewers, state that the heat measured on the pipe surrounding the cable is due to Joule heating. But Fig. 9 and Fig. 10 illustrate that the heat on the pipe is due to eddy current and not Joule heating. The infrared camera used is FLIR C2 which takes two pictures consecutively, a picture of the infrared waves emitted by objects and a picture of the white light emitted as depicted in the left and right image of Fig. 9.
In the infrared image of Fig. 9, the steel pipe on the right has (2.5 mm2 X 4) L wires and (2.5 mm2 X 4) N wires or a total of 8 wires are within the steel pipe. A current of 50 A flows through L and 50 A returns through N wires. On the steel pipe on the left, there are (2.5 mm2 X 4) X 2) = 8 L wires within the steel pipe. The L wires were rolled through the pipe twice. It can be observed in the infrared image of Fig. 9 that the right steel pipe is at the highest temperature in the scale of temperatures located in between the infrared and white light image. And the steel pipe with the 4 L and 4 N wires which the student is pointing at is almost at ambient temperature.
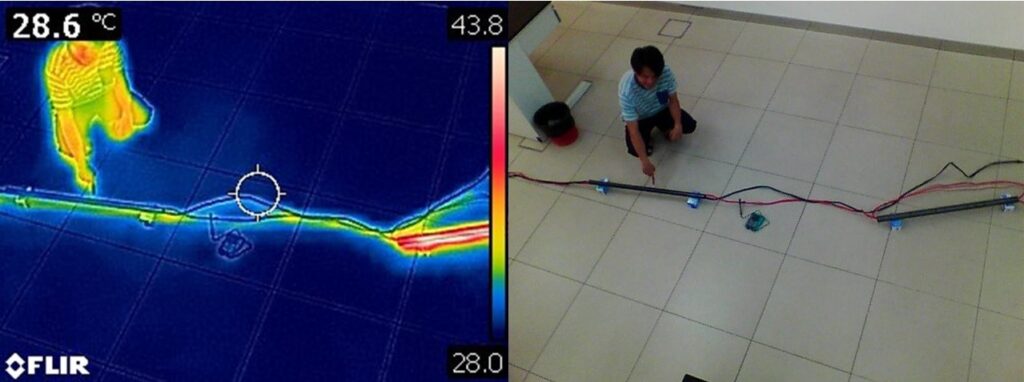
If Joule heating is the cause of the heat generated on the steel pipe, both pipes should have the same heat because both steel pipes have (8 X 2.5mm2) wires and the current flowing in the wires in both pipes is 100A.
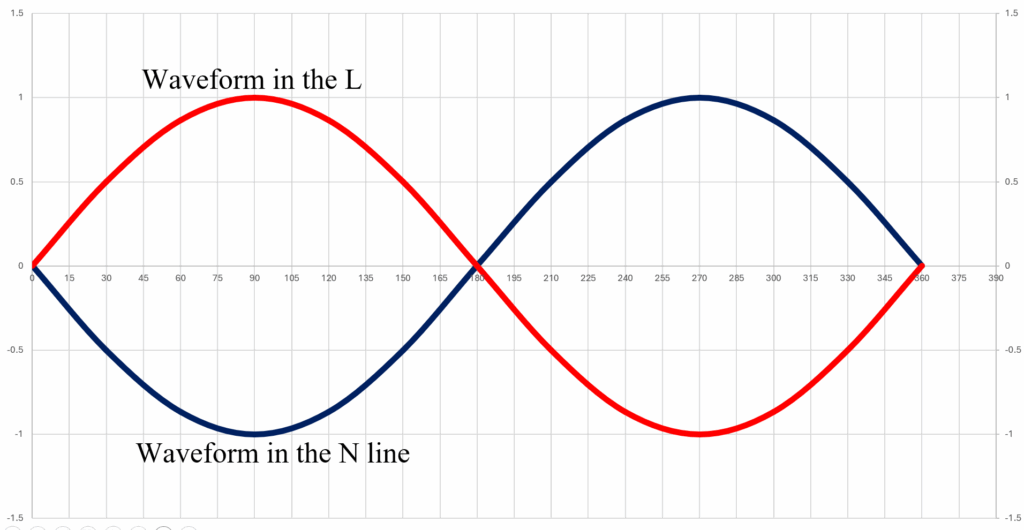
To understand what is happening, assume the pipe is only one wavelength long. Fig. 10 depicts that current is flowing as a sine wave in the L wires. But the current in the N wires is flowing in a sine wave with opposite amplitude. Therefore, the magnetic field generated by the L wires will superimpose the magnetic field generated by the N wires. Therefore, there is ≈ zero remaining magnetic field (assuming all the factors affecting conductivity are the same) within the pipe and therefore ≈ zero eddy current generated on the steel pipe and therefore ≈ zero heat generated on the steel pipe.
Steel pipes were chosen for this experiment because, at the outset of this research, the prevalence of HDPE in a small percentage of oil and gas (O&G) pipes was unknown. The dielectric strength of air at 7 atm is sufficient for this setup. Furthermore, a safety system could be implemented to shut down the line in the event of air pressure decreasing.
Steel was used by O&G because of its strength and durability to withstand up to 1000 atm pressure. Its other advantages are the versatility due to the big industrial base and machines to modify it. It is also easily available, being the fourth most abundant element on the earth’s crust.
Distinguishing the eddy currents induced in the pipe from Joule heating within the cable is crucial. Joule heating arises when the current surpasses the cable’s carrying capacity, as shown in Table 2 (e.g., 21A for a 2.5 mm² wire in conduit). Exceeding this limit results in resistive heating, a principle employed in materials like nichrome, known for their high-temperature tolerance despite significant current flow [18]. This heating stems from collisions between electrons and ions in the conductor, increasing their kinetic energy and manifesting as a temperature rise. To isolate eddy current effects on the pipe in this experiment, the maximum applied current to the cable was 50A, significantly below its 84A carrying capacity for the 4 X 2.5mm² wires.
To physically understand eddy current, one can use the right hand shaped according to the Fleming’s Right Hand Rule (FRHR). FRHR is defined as the thumb (F) pointing at the direction of movement of the magnet; normally taught in schools as F = Force. The index finger is pointing in the direction of the magnetic field (B) and the middle finger is pointing in the direction of the generated current (I).
A magnet with 10 magnetic field lines can be represented as a hand pointing as the FRHR passes a wire below it at a right angle. What the wire will see when the magnet is far away is initially 0 magnetic field line. Then it will see 2, then 3, 4, 5, 6, 7, 8, 9, then 10 field lines as the magnet is right above the wire. Therefore, what the wire will see is a varying Field density. So instead of defining the F as Force as is taught in high schools, it is better to define it as varying Field density (which still uses F). Even if the strongest magnet in the world (which has the highest magnetic field density) is placed just above the conductor but not moved, there will be no current generated in the conductor below it. In other words, only a variable Field density enables current to be generated in the conductor below it.
To understand how eddy current is generated in a wire carrying AC current, one can use the right hand shaped as FRHR moving up and down over the right hand’s lower arm. The FRHR represents a single electron. In AC, electrons move back and forth because, if the current is from the L1 phase within the generator. As the L1 phase coil in the generator’s stator is passed by the N pole of the rotor solenoid (which is energized with DC), current will travel to the loads of the country. And when this N pole passes the anticlockwise coil located at the bottom of the stator, current will come back from the loads of the country. Thus, each electron moves back and forth in an AC wire. But as the rotor solenoid’s N pole passes the top clockwise coil, the solenoid’s S pole will pass the anticlockwise coil located at the stator’s bottom. This will provide double the current for the load.
As the right hand which is shaped as the FRHR moves back and forth over the left-hand’s lower arm. Assume a single electron has 10 magnetic field lines. At the top and bottom of the left hand’s lower arm (end of the back-and-forth movement), there will be 10 magnetic fields lines around the electron since the speed of the electron is zero; just as the speed of a stone thrown up will experience zero speed before coming down due to gravity. But as it moves to the center of the left lower arm, the speed of the electron will increase till it is at a maximum at the center of the left lower arm. The electron will travel so fast that the magnetic field lines will linger even if the electron has passed a particular point in the wire. Therefore, at the center of the lower left arm, there will be a maximum number of field lines and at the two ends there will only be 10 field lines. Meaning there is a varying Field density (F of the FBI is present) as an electron moves back and forth within a point in a wire. Since an electron is a magnet which already has B, I will be generated. It can be observed from the FRHR that the current generated will be from the center of the wire to the outside. This current generated is termed as eddy current and it causes all flow of electrons in an AC wire to be only at the outer diameter; this is termed as skin effect. This is why in a typical O/H line, the structure is to have seven strands of steel surrounded by four layers of aluminum. Aluminum is brittle while steel will provide strength. This will enable the towers to be spaced further thereby saving cost since the cost of the towers is one of the most expensive portions of O/H line cost. The current does not flow through the steel wires because of the skin effect.
For DC transmission using O/H lines, even if the DC current is of very high magnitude, thereby making the magnetic field lines density very high, the magnetic Field density is not varying therefore there is no F and therefore no I generated. Therefore, the skin effect does not happen in DC lines so the whole cross-sectional area of the cable can be utilized for transmission. This is why DC lines can typically carry 100% or two times the current carried by AC lines. It must be noted that for O/H lines, steel reinforcement at the center must still be used to enable the towers to be spaced as far as AC towers, but despite that if DC is used, double the current can be carried [19].
If a steel pipe is placed around a conductor carrying AC, there will be a continuous eddy current generated which will push out the electrons flowing in the cable to the skin, plus the same magnetism will generate eddy current flow in the pipe surrounding the cable. This generated current has no polarity and will therefore behave like hurricanes of current within the steel pipe which will generate heat.
In the procedures of laying 11 kV and above U/G cables, the cable must be placed within a steel pipe if the cable passes a drain or under a road. But if only one single Φ cable is placed in a steel pipe, it can be observed that it will get hot. Experiments were done to determine if the eddy current generated is a linear function of the current sent through the conductor. Initially voltage was varied in the experiment but there was no heat generated in the steel pipe surrounding the conductor. This is further proof that voltage is a measure of electric field and current is a measure of magnetic field. The two fields are at a right angle to each other. An electric field is a field which will move a polarized ion, a magnetic field has no effect on a polarized ion. A voltmeter measures the magnitude of the electric field while an ammeter measures the magnitude of the magnetic field.
The eventual objective of this research is to send 1 GW of power between Kuching and Singapore using HVDC suspended at the center of steel pipes which are currently used by the O&G industry. Each pipe is 11.5 m and at the end of each pipe three insulators can be made to suspend the power cable at the star point as shown in Fig. 1. Air can be pumped to the pipe and another pipe will bring back the air or N2 from Sarawak to be refrigerated and recycled back to the pipe carrying the conductor. Air or N2 is mentioned because N2 could be too expensive for this 700 km pipe; further research on choosing air or pure N2 is needed as the dielectric. Barges must be long enough to stretch the drum of cable on the barge. Then an 11.5 m steel pipe is brought to the beginning of the cable and dragged to the other end of the barge. A star point shaped plastic insulator which will enable suspending the cable at its star point is then dragged from the beginning of the cable to the other end and fitted into the pipe. The three plastic insulators need to have a plastic base to hold it together as it is pushed into the pipe. Therefore, as shown in Fig. 11, a cylindrical plastic base is needed to hold the three insulators together. Then binding wire is used to fasten the 500 mm2 cable to the three insulators. This process is repeated with a second pipe dragged from the beginning of the cable to the other end of the barge. And the two steel pipes are welded. The plastic insulators must be placed far enough within the pipe such that the heat from the welding does not melt it.
Research done so far indicates that air at about 7 atm of air should be sufficient dielectric for the 1000 kV transmission. The Sunda Shelf shown in Fig. 3 has an average depth of 50 m. At this depth the pressure is:
$$P = D \times g \times d \tag{5}$$
$$P = 1024 \, \tfrac{kg}{m^{3}} \times 9.8 \, \tfrac{m}{s^{2}} \times 50 \, m = 501{,}760 \, Pa$$
$$P = 4.9583 \, atm \approx 5 \, atm$$
Where P = Pressure, D = density of water, g = gravity, d = depth. Therefore, at the seabed, 5 atm is exerted on the steel pipe. The O&G industry typically sends gas at 10-1000 atm. Obviously, the pressure within the pipe needs to be above the pressure the sea water exerts upon the pipe. Therefore, air needs to be sent into the pipe at 7 atm. This way, in case of a leak, there will be positive pressure out of the point of leak. The point of leak will most likely be at the joint point of the steel pipe. The joint point of the pipe where steel pipe is joined by welding could be done improperly thereby enabling water seepage. Therefore, it is highly recommended that robotic welding be used to provide consistency in the welding process.
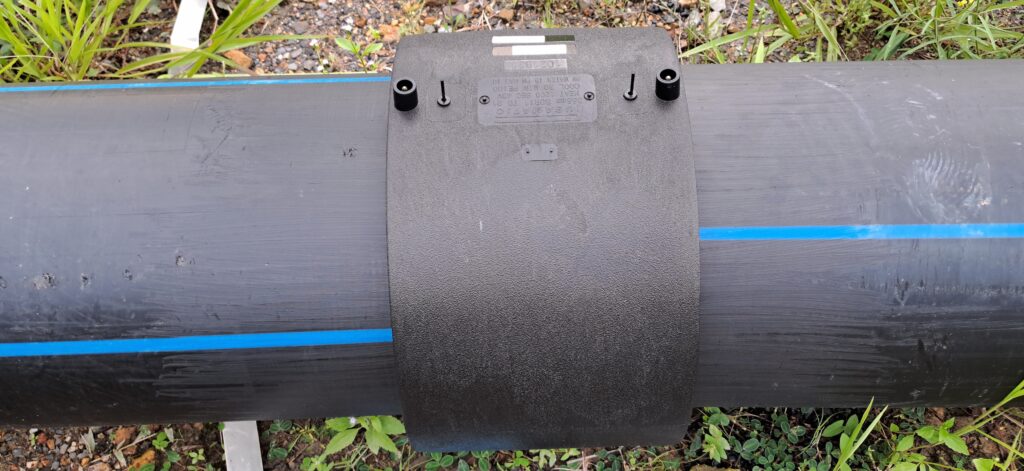
For HDPE pipes the joints are done with heat fusion. As water seeps within the pipe, there will be a 1000 kV to 0V (sea water) arcing. For HDPE pipes there will be a cover over the joint as shown in the HDPE water pipe shown on Fig. 12.
The dielectric strength of the air should be sufficient to withstand arcing. The choice of 7 atm is because the pumps to build up such pressure have already been built by the O&G industry and a new pump need not be developed specifically to send electricity within a pipe. This is assuming N2 and CH4 follow the ideal gas law of equation (4).
$$PV = nRT \tag{6}$$
The dielectric strength of air and N2 at 1 atm is around 3 MV/m. The steel or HDPE pipes used by the O&G range can range from Ø = 914 – 2000 mm. If a Ø = 2000 mm is used, the dielectric strength of the air or N2 from the center of the pipe to the pipe will be:
$$7 \, atm \times 3 \, \tfrac{MV}{m} = 21{,}000 \, \tfrac{MV}{m}$$
For this design, the conductor will be having 1000 kV, therefore the protection from arching needed is only 1000 kV. But at 7 atm, the smallest pipe currently used by the O&G industry can be used which will provide a dielectric strength of the N2 of:
$$7 \, atm \times \tfrac{914 \, mm}{1000} \times 3 \, \tfrac{MV}{m} = 19{,}194 \, \tfrac{MV}{m}$$
It must be noted that if DC is used, the breakdown voltage is two times higher meaning that it will be two times harder for arcs to happen with DC. This is because when AC is used there is a space charge accumulation around imperfections in the insulator. These space charges can create fields and cause breakdowns easier.
With a dielectric strength of 19,194 MV/m even AC can be used but to synchronize the grid of Sarawak and Singapore will be a challenge, the safest way to synchronize the two grids is to shut down all power in Sarawak for a probably half a day and restart all engines with Singapore’s frequency. Many claim that modern equipment can handle synchronization. But if synchronizing the grid of Sarawak and Singapore fails by even a millisecond, the result can be catastrophic. Note that the interconnection is 1000kV. One cycle is 20 ms. Even if the synchronizing is off by 5 ms a phase I of Singapore could be at 0 V at one moment of time, but Sarawak will be at peak voltage divided by two because the sine wave will be quarter cycle up from 0 V:
$$\frac{1000 \, kV}{0.707 \times 2} = 7072 \, kV$$
Which will be high enough to destroy lots of equipment in the Sarawak grid. This potential loss is far worse than shutting down power of the Sarawak grid and slowly synchronizing each generator to Singapore’s frequency. It is not practical to shut down Singapore’s power since Singapore’s economy is larger than Malaysia’s economy of 13 states where Sarawak is only one state.
HVDC is currently used in joining grids of different frequencies. There is a HVDC line utilized to join the grids of West Malaysia and Thailand. HVDC towers and lines cost 30% less than HVAC towers and lines.
4. Conclusion
This work was done to facilitate the aspiration of the government to send 1 GW of power from Sarawak to Singapore over 700 km. Justifying this research is the fact that it is highly unlikely that the currently planned XLPE insulated conductor will be able achieve 1 GW transmission over 700 km simply because there is no vent for the Joule heating in the cable. The insulation must be quite thick because of the possibility of a 1000 kV in the cable to 0 V of the sea water and therefore this insulation will trap the Joule heating of the cable.
The proposed system in this research is because Sarawak has been drilling oil since 1910 and there is a vast network of submarine O&G pipes north of Sarawak. There are also lots of very eager contractors and consultants within Sarawak who can easily lay a O&G pipe between Kuching to Singapore with a conductor suspended at its center. Air will be pumped within this pipe and another pipe will bring back the air to Kuching to be cooled and sent back to Singapore. This air will be at 7 atm because the O&G industry has already built pumps to pressurize the gas to that pressure.
A key finding of this research was the presence of HDPE pipes in a small percentage of existing submarine O&G infrastructure. While this experiment assumed the use of traditional steel pipes, which have been employed by the O&G industry since 1859, the potential for using HDPE pipes presents a significant advantage: it would substantially reduce concerns about arcing from the 1000 kV cable to the 0 V seawater. The primary limitation of HDPE pipes in this context, however, is their relative novelty and thus, their less extensive time-tested history within the O&G industry compared to steel.
HVDC is a good choice for this cable for two reasons. Firstly, the Singapore grid is at a different frequency from the Sarawak grid and a HVDC line can connect two different frequency grids without the need for synchronizing. Secondly, HVDC can carry current without eddy current loss. Only Joule heating loss is possible with HVDC. But the AC to DC converter is very expensive, including its maintenance cost.
The aim in this work is to study the feasibility of using a Ø = 2 m pipe and 1000 GW (1000 A at 1000 kV) which is the current value broadcasted in the media for the proposed XLPE insulated submarine line between Sarawak and Singapore.
The next step in this research is to get research funding to lay about 1 km of steel pipes and run 11 kV of power within it since that is the lowest HV used before LV voltages for domestic consumption in Sarawak.
Acknowledgement
This research was sponsored by a grant from University of Technology Sarawak (UTS) with reference: UTS/Research/<4/2017/14>(01)
- Prashobh Karunakaran et al, “Electricity Transmission Under South China Sea by Suspending Cables Within Pipes,” IEEE Xplore. Electronic ISBN:978-1-7281-6221-8, 10.1109/INCET49848.2020.9154119.
- Tricker, R. (2021). “Wiring Regulations Pocket Book. Routledge,” https://doi.org/10.1201/9781003165170.
- McGrath, Clemens S. M et al., “Pleistocene Sunda Shelf submersion-exposure cycles initiate vegetation,” Walker Circulation feedback. Geology, 51(11), 1053-1056, https://doi.org/10.1130/G51412.1.
- L. Zhang, Y. Yin, W. Shi. “Research on the Lightning Protection of UHV Long-distance GIL System,” In 2023 8th Asia Conference on Power and Electrical Engineering (ACPEE) (pp. 1163-1167), IEEE, https://doi.org/10.1109/ACPEE57237.2023.10103681
- P. Argaut, “Underground Cables,” Springer Handbook of Power Systems, 759-866, 10.1007/978-981-32-9938-2_10
- J. G. Theis, G. R. Werner, T. G. Jenkins, J.R. Cary. “Computing the Paschen curve for argon with speed-limited particle-in-cell simulation,” Physics of Plasmas, 28(6), https://doi.org/10.1063/5.0051095
- P. Billen, B. Maes, M. Larrain, J. Braet, “Replacing SF6 in electrical gas-insulated switchgear”: technological alternatives and potential life cycle greenhouse gas savings in an EU-28 perspective. Energies, 13(7), 1807, https://doi.org/10.3390/en13071807
- Zulkarnain Y. Siregar et al., “The Dielectric Power of Mixed Gas Insulation of SF?-CO? and SF?-N?,.” In 2022 International Seminar on Intelligent Technology and Its Applications (ISITIA) (pp. 355-359). IEEE, https://doi.org/10.1109/ISITIA55981.2022.9854746
- U. Riechert, “Compact high voltage direct current gas-insulated systems,” In 2020 IEEE International Conference on High Voltage Engineering and Application (ICHVE) (pp. 1-4). IEEE, https://doi.org/10.1109/ICHVE50860.2020.9280047
- R. Arora, W. Mosch, ”High voltage and electrical insulation engineering,” John Wiley & Sons, https://doi.org/10.1002/9781119568940
- H. Liang, Q. Xie, “Shaking table test on 1000 kV UHV transmission tower-line coupling system,” In Structures (Vol. 27, pp. 650-663), Elsevier, https://doi.org/10.1016/j.istruc.2020.06.017
- Donald Porcelli, C.J. Ballentine, R. Wieler, R., “An overview of noble gas geochemistry and cosmochemistry,” Reviews in mineralogy and geochemistry, 47(1), 1-19, https://doi.org/10.2138/rmg.2002.47.1
- S. Kim, F. Loose, F., P. J. Chirik, “Beyond ammonia: nitrogen-element bond forming reactions with coordinated dinitrogen,” Chemical reviews, 120(12), 5637-5681,https://doi.org/10.1021/acs.chemrev.9b00705
- H. Zsiborács, A. Vincze, G. Pintér, H. Baranyai, “The accuracy of PV power plant scheduling in Europe: an overview of ENTSO-E Countries,” IEEE Access, 11, 74953-74979, https://doi.org/10.1109/ACCESS.2023.3297494
- Rancilio Bovera, D. Falabretti,M Merlo, “Data-driven evaluation of secondary-and tertiary-reserve needs with high renewables penetration: The italian case.”, Energies, 14(8), 2157, https://doi.org/10.3390/en14082157
- V. Fruet, D. Campos, L. Caridad, “Itaipu Binational Dam: A Quantitative Analysis of the Economic and Social Impacts in Paraguay. Successful or not?”, SAGE Open, 13(4), 21582440231216820,..https://doi.org/10.1177/21582440231216820
- P. Karunakaran et al., “Eddy Current versus Joule Heating Effects for a Cable Suspended in an Iron Pipe,” IEEE Explore. Electronic ISBN:978-1-7281-9744-9. https://doi.org/10.1109/INOCON50539.2020.9298266
- G. L. Zhunkovskii, O.N. Grigoriev, D. V. Vedel, “Interaction of Titanium Diboride with Nickel and Ni–20% Cr Alloy (Nichrome),” Powder Metallurgy and Metal Ceramics, 60(9), 586-596, 10.1007/s11106-021-00277-y
- P. Karunakaran, ”Electrical Power Simplified,” AuthorHouse. ISBN-13: 978-1504965422