Designing Critical and Secondary Information in Augmented Reality Headsets for Situational Awareness

(This article belongs to the Special Issue on Special Issue on Computing, Engineering and Sciences 2023-23 and the Section Artificial Intelligence – Computer Science (AIC))
Export Citations
Cite
Woodward, J. , Smith, J. , Wang, I. , Cuenca, S. and Ruiz, J. (2023). Designing Critical and Secondary Information in Augmented Reality Headsets for Situational Awareness. Journal of Engineering Research and Sciences, 2(3), 1–15. https://doi.org/10.55708/js0203001
Julia Woodward, Jesse Smith, Isaac Wang, Sofia Cuenca and Jaime Ruiz. "Designing Critical and Secondary Information in Augmented Reality Headsets for Situational Awareness." Journal of Engineering Research and Sciences 2, no. 3 (March 2023): 1–15. https://doi.org/10.55708/js0203001
J. Woodward, J. Smith, I. Wang, S. Cuenca and J. Ruiz, "Designing Critical and Secondary Information in Augmented Reality Headsets for Situational Awareness," Journal of Engineering Research and Sciences, vol. 2, no. 3, pp. 1–15, Mar. 2023, doi: 10.55708/js0203001.
Augmented Reality (AR) headsets are being used in different contexts (e.g., the oil industry, healthcare, military); however, there is a lack of research and design recommendations on how information should be presented in the AR headset displays, especially for aiding users’ situational awareness. We present two studies: one examining if existing findings on the perceptibility of three types of visual stimulus (color, text, shapes) can be applied to AR headsets for critical information, and one analyzing three different presentation styles (Display, Environment, Mixed Environment) for textual secondary information in AR headsets. Our study on secondary information is an extension of prior work. For critical information, we found that existing visual perception findings can be applied to AR headsets; there is a hierarchy of salient visual features. Understanding that we can utilize prior work on visual features helps in designing salient critical information for AR headset displays. For secondary information, we found that having the text in the Display and Environment presentation styles assisted in participants’ perception and comprehension when compared to the Mixed Environment presentation style. Based on our results, we provide design recommendations on how to present critical and secondary information in AR headset displays to aid in users’ situational awareness, which is essential in safety crucial domains such as the military.
1. Introduction
Augmented reality (AR) systems combine virtual elements with the real-world environment [1]. Compared to more traditional AR platforms (e.g., tablets, smartphones, computers), AR headsets are becoming more popular due to providing more mobility, hands-free capabilities, and user immersion [2,3]. AR headsets are entering the consumer market [4], and are also being employed in industrial settings [5]. However, prior research studies have focused on examining the applicability of using AR headsets in various environments and not on investigating how to design the information in the display, especially for aiding users’ situational awareness. Situational awareness consists of three levels: perception and detection of elements in the environment (level 1), comprehension and interpretation (level 2), and prediction of the future status of the environment (level 3) [6,7]. Situational awareness is separate from users’ decision making [7] and is essential in safety crucial domains [8]. A lack of situational awareness has been attributed to tragedies, such as aircraft crashes [8], oil spills [9], and errors in anesthesia [10].
Since AR keeps users aware of their surroundings while providing additional virtual information in real-time, AR has the capability to increase users’ situational awareness. Prior work has examined applying AR headsets for users’ situational awareness in a wide range of contexts, such as the military [11], maintenance [12], construction [13], and healthcare [14]. However, prior work has mainly studied the applicability of AR instead of investigating how to design the visual information for aiding users’ situational awareness (e.g., [14–17]). In addition, there has been conflicting results with using AR, such as both higher and lower situational awareness [15,16,18] and cognitive workload [19,20]. Therefore, it is important to study how the design of information affects users’ situational awareness, since not considering the design and simply applying AR to situations may not be beneficial (e.g., lower situational awareness).
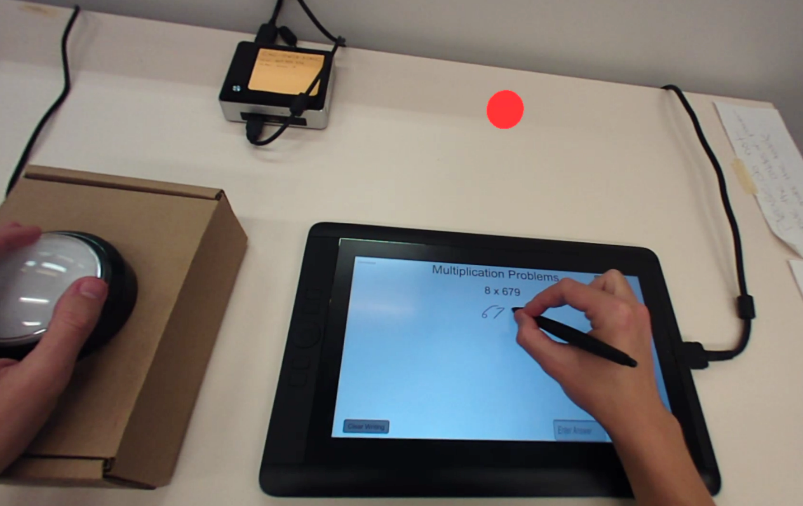
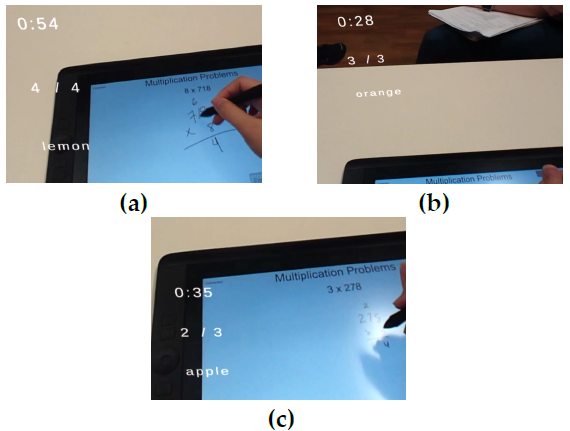
In this paper, we examine how the presentation of visual information in AR headsets can affect users’ situational awareness (i.e., level 1 perception and level 2 comprehension). In terms of information necessity, visual information can be separated into two categories: central or critical information (e.g., hazard warnings, essential information) and peripheral or secondary information (e.g., current time, nonessential information) [21]. Critical information is essential to comprehend when completing a task, while secondary information may be beneficial but not necessary. Therefore, we conducted two separate studies focusing on critical and secondary visual information. In our critical information study, we focused on perception through examining if existing findings on the perceptibility of three types of visual stimulus (color, text, shapes) can be applied to AR headsets. Previous work in visual perception has found a hierarchy of salient features. For instance, people can more easily detect color than shapes and text [22,23]. However, it is unclear if these findings translate to AR headsets due to these headsets possessing technological and perceptual challenges. The low resolution and loss of visual acuity in AR headsets can negatively affect legibility, object recognition, and depth perception [24,25]. Also, the environment and transparency of virtual elements can impact users’ color perception in AR headsets [24,26]. Understanding if we can apply existing perception findings to AR headsets will aid in the design of salient critical information. In our experiment, participants had to monitor visual stimulus in an AR headset while completing math problems on a tablet, and press a physical button when they noticed a specific visual condition in the headset (Figure 1). The math problems were used as a cognitively demanding task for the participants to focus on. The visual stimulus was locked to the AR headset display view. We designed the stimulus to always be present because critical information should be prominent and immediately perceptible [27,28].
While visual saliency is essential for critical information, secondary information does not have this restriction, and therefore can display larger quantities of detailed information as text (date, time, descriptions, etc.). Since secondary information does not need to be as visually salient, there are more opportunities to integrate it with the environment. Therefore, for our second study, we investigated three different presentation styles for textual secondary information in the context of aiding both perception and comprehension: locked to the display view (Display), located in the environment (Environment), and a mix of both (Mixed Environment). As in the critical information study, participants had to monitor the textual information in an AR headset while solving math problems. Our study on secondary information is an extension of prior work [29]. This paper updates and expands upon the original work by adding additional literature, an exploratory study on the location of elements, the experiment on critical information, and more results from the study on secondary information.
In our critical information study, we found similar results to prior work with participants having a faster response time for color, and a slower response time and higher cognitive workload for text. In our secondary information study, we found that the Display and Environment presentation styles improved perception and comprehension of textual secondary information; participants had a higher recall of information. Our results provide a new understanding of how different types of visual stimulus for critical information and different presentation styles for textual secondary information in AR headsets can aid users’ situational awareness. We contribute design recommendations on how to present visual information in AR headsets for users’ situational awareness. Recognizing how to design visual information in AR headsets to improve situational awareness has a wide range of implications in safety crucial environments, such as surgery.
2. Related Work
We focus our review of prior work on two categories: (1) using AR for situational awareness and (2) examining the presentation of information in AR headsets.
2.1. AR for Situational Awareness
Prior work has started studying using AR for users’ situational awareness in safety domains, such as the military [14,16,17,30,31]. The authors in [31] created an AR system (FlyAR) to support Unmanned Aerial Vehicle (UAV) flight navigation. FlyAR supports live flight supervision by overlaying the flight path onto a live video stream on a tablet PC, as well as using graphical elements to show height and distance between points. The authors in [16] also developed an AR system for UAV operators, in which flight data was overlaid onto a video stream of the flight on a computer screen. Before the AR system, operators would have to look at two separate screens. The authors found that the AR system improved the operators’ situational awareness. In the security domain, [32] proposed a conceptual AR computer-based design for combining social media data (e.g., twitter posts) with contextual information (e.g., Google Maps) to increase emergency operators’ situational awareness. The authors iterated on the design based on a workshop with AR and situational awareness experts but did not implement and evaluate the designs in a real-world context.
AR has also been analyzed in the context of driving [17,33,34]. In [17], the authors proposed an AR car windshield system to increase drivers’ situational awareness by providing warning information to the driver. For example, it would detect another vehicle and add color depending on how close the vehicle was. The authors in [33] designed an AR driving system that provides warnings on the car windshield for pedestrian collision (e.g., a yellow outline). The authors conducted a driving simulator study and found that the AR visual cues enhanced drivers’ awareness of pedestrians. In [34], the authors examined object segmentation visualizations for automated vehicles. They found that including the segmentation visualizations over the car windshield, instead of a tablet on the console, resulted in participants having lower cognitive workload and higher situational awareness, especially for color segmentations over both dynamic and static objects.
While the studies listed above investigated using AR for situational awareness, they only analyzed traditional displays (e.g., car windshields, computer screens), not AR headsets. AR headsets provide more user immersion and freedom, as well as contextual integration with the environment. Previous studies have started to examine using AR headsets for aiding users’ situational awareness, such as to monitor patient information [14,15]. In [14], the authors investigated if AR headsets can aid anesthesiologists in monitoring patient information during surgery. They conducted a simulated operating environment study and found that the anesthesiologists that used the AR headset spent less time looking at the anesthesia machine and detected patient events faster. The authors in [15] analyzed if AR headsets could help nurses’ patient alarm management decisions and situational awareness by showing patient vital signs. The authors found that using the AR headsets resulted in nurses having higher situational awareness, less errors in recognizing alarms, and faster alarm reaction times.
Prior work has also examined employing AR headsets in the military and security domains [11,30,35,36]. In [11], the authors developed an AR headset system that displays tactical information (e.g., navigation waypoints) for soldiers on foot. The authors in [35] analyzed using an AR headset to show real-time navigational information for the US Coast Guard. They ran a training simulation and found that the AR headset increased operator track keeping and situational awareness; however, it lowered operator responsiveness. For remote pilots of UAVs, [36] investigated using AR headsets to show telemetry details. The authors found that the AR headsets allowed the pilots to focus more on keeping the aircrafts in their field of view, instead of looking at the ground control station. In [30], the authors examined using AR headsets to provide distributed team awareness, specifically in the security domain (e.g., collecting evidence). One team member would be physically present in the environment with an AR headset while a remote team member would be watching a video stream from the headset camera on a computer screen. The remote member could add and edit virtual content displayed in the collaborator’s headset (e.g., arrow pointing to specific evidence). They found that the team member wearing the AR headset had higher cognitive workload and lower alertness, while the remote team member had a higher understanding of the situation.
AR headsets are also being utilized in other domains to aid in users’ situational awareness, such as firefighting [37,38] and agriculture [39]. The authors in [37] analyzed a proof-of-concept design for using an AR headset in a simulated fire scenario. In the design, the optimal path to the fire would be displayed, as well as fire extinguisher locations. They found that the proof-of-concept reduced travel distance and improved firefighting efficiency. In [38], the authors designed and built an AR headset prototype, which displayed thermal imaging and object segmentation visualizations to help firefighters see their environment during situations with limited sight (e.g., heavy smoke). For agriculture, [39] created an AR system to help farmers monitor their agricultural machines. The locations and status of the machines would be shown in the AR headset display.
These studies highlight the applicability of using AR headsets in domains that require situational awareness; however, they did not analyze how to present the visual information in the headsets. None of the studies compared different designs of information, which can impact users. Prior work has shown that AR headsets can result in slower completion times [40,41], higher discomfort [42], and higher cognitive workload [43] when compared to traditional methods (e.g., paper instructions). Therefore, not considering the design of information and simply applying AR headsets to different contexts may not be beneficial. We go beyond prior work by examining different types of visual stimulus for critical information and different presentation styles for secondary textual information in the context of situational awareness.
2.2. Presentation of Information in AR Headsets
Prior work has started to examine the presentation of information in AR headsets [23,44–49]. During a maintenance assembly task, [48] compared using an AR headset (3D animations vs. video instructions) to traditional paper-based instructions. The authors found an improvement in participants’ task performance (e.g., faster completion time, fewer errors) when using the AR headsets compared to paper instructions. For the AR headset, while it varied between 3D animations and video instructions, the participants could always see textual instructions and an image of the current tool they needed; the text design remained the same. The authors found that 3D animations, when compared to videos, in an AR headset lowered task completion times. In [47], the authors investigated different AR headset interface designs during a warehouse job simulation (i.e., finding order parts). The designs included text-based versus graphic-based designs, as well as always-on versus on-demand information. They found that graphic-based and always-on information helped users’ task performance by reducing completion times and errors. The authors in [49] examined user preferences on how to convey information in industrial AR interfaces. The study consisted of a questionnaire with mockup images of an AR interface. The 3D CAD models were the most preferred, with text being the least preferred. However, the study only focused on assembly, did not use an actual AR device, and did not examine different designs and presentations of text. In addition, prior work recommends that text should not be completely removed for task instructions [50].
In [51], the authors developed an AR headset prototype to help users understand conversations in a noisy echoic environment. The prototype distinguishes between speakers by putting a symbol above their head (i.e., a blue triangle with a white flag and number). When a speaker talks, the audio is transcribed and displayed in the AR headset. The text is shown in black on a static off-white panel at the bottom of the display along with the number associated with the current speaker. The authors did not look at different text designs, only feasibility of the prototype. In [44], the authors analyzed different text positions in an AR headset for reading. When the text was in the top-right, users had higher cognitive workload and lower comprehension when compared to the center and bottom-center locations. The center and bottom-center locations resulted in users having lower cognitive workload and higher comprehension. They also examined two presentation styles: line-by-line scrolling and word-by-word. The word-by-word style resulted in higher user comprehension when users were sitting and reading, while the line-by-line scrolling style had higher comprehension when users were walking and reading.
Previous studies have investigated text and background panel colors in AR systems. The authors in [52] found that using white text with a blue panel background was the best for user readability in AR headsets. In [53], the authors conducted a crowd-sourcing study on user preferences for colors for text and background panels in AR smartphone applications. Most of the participants preferred red or blue background panels with white text. However, prior work has also recommended transparent backgrounds [45], which was not an option for participants in [53]. The authors in [45] conducted a user study, in which participants organized items in a grocery store while viewing product information in an AR headset in two modes: see through mode (i.e., transparent) or panel overlay (i.e., opaque background). The participants preferred the product text to be displayed in the center of the headset in see through mode (i.e., no background) for readability, as well as being able to easily switch between the information and environment. In [54], the authors tested different AR headset text magnification designs for low-vision users. The authors found that the participants liked the transparent background panels and that anchoring content in 3D space can support a more natural and flexible reading experience.
These prior studies examined the presentation of information in AR headsets, but mainly focused on readability and user preferences instead of situational awareness. It is important to examine how information should be presented in AR headsets to aid in users’ awareness since these devices are being used in a wide range of contexts that require situational awareness (e.g., healthcare). For our studies, we focused on analyzing how different presentation styles for textual secondary information and different types of visual stimulus for critical information in AR headsets can aid in users’ perception and comprehension (i.e., the first two levels of situational awareness).
3. Exploratory Study: Location
We first conducted an exploratory study to determine the best location to place the visual stimulus in our experiments. We wanted to choose the location, in which the participants would have the fastest reaction time possible. For this study, participants had to press a physical button when they noticed a dot appear in a Meta 2 AR headset [55]. The study was conducted in a windowless room with consistent lighting and took 5 to 10 minutes. In the application, a white 3D cube (25.4 millimeter (mm) edge length) remained in the middle of the field-of-view, while white dots (6.35 mm diameter) would appear in different locations along the periphery. Even though prior work has shown that reaction time increases for stimulus in the periphery [56,57], we focused on peripheral locations because we wanted to examine the perception of information that would not block the users’ view or distract them from their main task. The participants were instructed to focus on the 3D cube and to hit the button when they noticed a white dot appear. The dot would appear in one of sixteen locations along the periphery; there was 75 mm between each dot to create all sixteen locations. When the participant pressed the button or if the participant did not notice the dot after 2 seconds, the dot disappeared. The next dot would then appear in a different location after a random time interval (1-4 seconds). Each participant viewed 80 dots total (5 dots per location). The location order was originally randomized, and then the same order was used for every participant. Participants volunteered without compensation.
3.1. Equipment
The AR application was created using Unity [58], and was run on a Meta 2 AR headset [55]. The headset features a 90-degree field-of-view with a 2560 x 1440 resolution. The physical button had a 76.2 mm diameter. We used a rectangular cardboard box (228.6 mm x 152.4 mm x 76.2 mm) as a base for the button.
3.2. Participants
We had a total of 12 adult participants (M = 23.42 years, SD = 3.55); however, we excluded one female participant for not wearing their corrective lenses. Therefore, we had a total of 11 participants for analysis (M = 23.09, SD = 3.53). Out of the 11 participants, six participants were female, one participant was left-handed, and five participants had used an AR headset at least one time before. All of the 11 participants had normal or corrected-to-normal vision (e.g., eyeglasses).
3.3. Data Analysis and Results
For analysis, we examined the participants’ response time by location. Response time was calculated as the time it took a participant to press the button after a dot appeared in the headset. We excluded the times in which the participant did not notice the dot and it disappeared. We grouped the 16 individual locations into three categories: left, center, and right. The center included the six dot locations at the top and the bottom not located on the left and right edges. A Shapiro-Wilks test found that the data was normal; however, a Mauchly Test for Sphericity showed that the data did not have equal variances (p < 0.01). A one-way repeated measures ANOVA (RM-ANOVA) with a Greenhouse-Geisser correction found a significant main effect of location on response time (F1.17,10.54 = 9.48, p < 0.01). A Bonferroni post-hoc comparison showed that the participants had a significantly faster response time for the center locations (M = 0.399s, SD = 0.086) compared to the right-side locations (M = 0.444s, SD = 0.172); this is similar to prior work, which has found lower detection accuracy for the right-side of the visual field [59]. There was no significant difference in response time between the center and left-side locations (M = 0.418s, SD = 0.138).
To further analyze the locations, we examined: (1) the corner locations compared to the remaining locations, and (2) the top locations versus the bottom locations. For both the corner locations and the top versus bottom locations, a Shapiro-Wilks test found that the data was normal, and a Levene’s test showed that the data met the assumption of equal variances. A paired-sample t-test found a significant main effect of corner locations on response time (t (9) = 2.92, p < 0.05). The participants had a significantly slower response time (M = 0.452s, SD = 0.202) for the corner locations compared to the remaining locations (M = 0.408s, SD = 0.102). A paired-sample t-test found no significant difference between the top and bottom locations (t (9) = 1.27, n.s.).
Based on our results, we decided to place the different types of visual stimulus in the top-center of the field-of-view for our first study on critical information, to increase perceptibility. For our second experiment on presentation styles for secondary information, we placed the textual information on the left-side of the field-of-view (avoiding the corner locations). We decided to place the secondary information on the left-side because we did not want the quantity of the information to block the participant’s view, and there was no significant difference in response time between the center and left-side locations. Also, people exhibit a leftward visual bias, known as pseudoneglect [60,61], which results in higher detection accuracy and faster motion processing for elements on the left when compared to the right [59,61,62]; even for computer screens [59]. Although pseudoneglect occurs in both right-handed and left-handed people, it is not evident in cultures that read right-to-left [63]. Therefore, it is important to keep in mind users’ cultural groups and differences when placing elements in headset displays.
4. Experiment 1: Critical Information
In our critical information study, we focused on examining three different types of visual stimulus in an AR headset: color, text, and shapes. These types of visual stimulus are commonly utilized to denote information, such as in warning signs [64]. The goal was to analyze if prior results on the perceptibility of types of visual stimulus could be applied to AR headsets. Previous work in visual perception has found a hierarchy of salient features. For instance, people more easily detect color than shapes and text [22,23]. However, it was unclear if these findings translate to AR headsets due to these headsets possessing technological and perceptual challenges. The low resolution and loss of visual acuity in AR headsets can negatively affect legibility, object recognition, and depth perception [24,25]. Also, the environment and transparency of virtual elements affects users’ color perception in AR headsets [24,26]. Determining if we could apply existing findings to AR headsets allows us to further understand how to design critical information.
4.1. Participants
We had a total of 37 adults participate (M = 22.19 years, SD = 5.59); however, we excluded one female participant due to equipment failure, resulting in a total of 36 participants for analysis (M = 22.22 years, SD = 5.67). Twelve participants were female, two participants were left-handed, and ten participants had used an AR headset before. We did not recruit participants who were color-blind or dyslexic, and all of our participants had normal or corrected-to-normal vision.
4.2. Method and Design
While wearing an AR headset, participants completed multiplication problems on a touchscreen tablet and different types of visual stimulus appeared in the headset: color, text, or shapes (Figure 2). The participants would only see one type of visual stimulus at a time, not a mix of all three. We placed the stimulus in the top-center of the headset field-of-view based on our results from our exploratory study.
For each visual stimulus type (e.g., color), the visual condition displayed would constantly change (e.g., switching between different colors). Participants were instructed to hit a physical button with their non-dominant hand when they saw a specific visual condition (e.g., color red). The participants took part in the study for approximately 60 minutes in a windowless room, and either volunteered without compensation or received extra credit in a course they were taking.
After consenting to participate, participants completed a demographic questionnaire. The participants then completed a 4-minute practice round of multiplication problems on the tablet without wearing the AR headset to get comfortable with the math application; which was not used in analysis. After the math practice, participants put on the AR headset and began the main study. In the main study, there were six study blocks (approximately 4-minutes each), two blocks per visual stimulus type (color, text, shapes). After completing two blocks for a visual stimulus type, the participants would take the NASA Task Load Index (TLX) [65] for that visual type, which is used to determine participants’ perceived cognitive workload. The participants would then complete the next two blocks for a different visual type, the NASA TLX, and then move on to the last visual type blocks. The order of the visual types was counterbalanced across participants. After the participants completed the six study blocks, they were also asked questions about their subjective preference.
4.2.1. AR Application Design
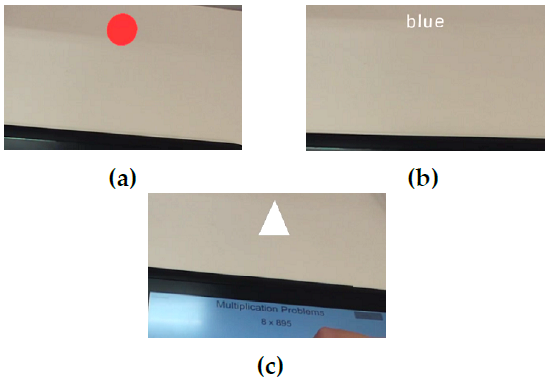
Each visual stimulus type had a total of four different options that would constantly change in the headset in a randomized order and for a randomized duration. The four options for each type of visual stimulus included: (a) color: red, green, yellow, and blue; (b) text: “red”, “green”, “yellow”, and “blue”; and (c) shapes: circle, triangle, star, and square. All types of visual stimulus had the same color saturation and brightness and had the same width (12.7 mm). For color, only the color of the circle changed (Figure 2a). Both the text and shapes (Figures 2b and 2c) were white, since black is transparent in AR headsets. The text height was 5 mm, which is consistent with Meta AR design recommendations [66], and in Liberation Sans font since prior work recommends using sans-serif fonts for text readability [67].
During each study block, the participant would view a total of 32 visual conditions (4 options x 8 occurrences). For example, if it was a color block it would constantly change between the four colors, and each specific visual condition (e.g., color blue) would appear eight times. The current visual condition (e.g., color red in Figure 2a) would remain in the headset display for a random time interval (6 to 9 seconds) before switching to the next visual condition. If the participant pressed the button it would automatically switch to the next visual condition, regardless of the amount of time left for the current visual condition. The last visual condition in that block would remain visible in the headset until the participant finished the current math problem and then both applications would end. Each study block was approximately 4 minutes. The blocks were not exactly 4 minutes because each visual condition would change after a random time interval, and the study block would not end until the participant finished the last math problem.
Since there were only two blocks for each type of visual stimulus, we had to determine the two visual conditions for when the participant would hit the button. For color, the participants hit the button when they saw the color red for one block and the color green for the other block because adults have faster reaction times for red and green colors, compared to yellow and blue [68]. For text, the participants hit the button when they saw the word “red” for one block and the word “blue” for the other block. Prior work has shown that word processing time increases as the number of letters increase [69], therefore we chose the two shortest words (out of the four options) to have the fastest reaction time possible. For shapes, the participants hit the button when they saw a circle for one block and a triangle for the other block. We chose a circle and triangle because they are used by the International Organization for Standardization (ISO) to represent mandatory actions and warnings [64].
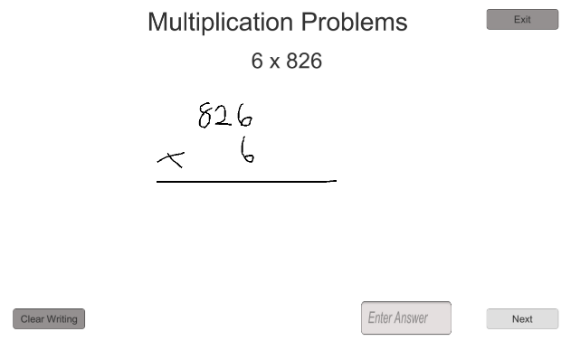
Figure 3: Screenshot from our math application.
4.2.2. Math Application Design
We decided for the participants to focus on math problems while monitoring the visual stimulus in the AR headset because mental math calculation uses people’s working memory [70]. Working memory falls under short-term memory and is necessary for sudden perceptual cognitive tasks, such as language comprehension and reasoning [71]. By having participants focus on a task that uses their working memory, we can examine the salient properties of the different types of visual stimulus in the AR headset. We purposefully designed our math application to be more cognitively taxing (i.e., utilize more working memory) in order to keep the participants’ attention on the math application, instead of the visual stimulus in the AR headset; not primarily focusing on the information in the headset is consistent with demanding real-world settings (e.g., surgery).
Our math application consisted of single-digit x three-digit multiplication problems (Figure 3). We chose multiplication problems because they have a slower solve time compared to addition problems [72]; therefore, requiring more of the participants’ attention. We also implemented other design decisions to make the application more cognitively taxing, such as presenting the single-digit first because prior work has shown that adults are slower when the smaller number is first [73]. The single-digit ranged from 2 to 9 because multiplication with 0 or 1 utilizes retrieving a rule (e.g., everything multiplied by 0 equals 0) instead of a solution [74]. The three-digit also did not end in 0 or 1, and did not include three of the same digit (e.g., 444) due to the tie-effect [75]. The tie-effect states that response time for an operand pair with identical digits is faster. None of the multiplication problems repeated in the math application.
Figure 3 shows a screenshot from our math application. The current math problem would appear at the top of the screen (e.g., 6 x 826). The participants had an area to work out the problem using a stylus pen, before inputting their answer and hitting a button to go onto the next problem. The participants had to input an answer to move on, but the answer did not have to be correct. Each participant finished the number of problems they could do in the set block time. We instructed the participants to take their time and focus on getting correct answers.
4.3. Equipment
Both the AR application and multiplication application were created using Unity [58]. The AR application was run on the same Meta 2 headset as the exploratory location study, and the math application was run on a Wacom Cintiq Companion Hybrid tablet [76]. The tablet has a 1080 x 1920 resolution, and the screen is 13.3 inches, measured diagonally. The physical button was the same button that was used in the location study.
4.4. Data Analysis and Results
We analyzed the types of visual stimulus (color, text, shapes) by examining the response time and error rate for the visual stimulus, the math solve time, and the participants’ cognitive workload and preference.
4.4.1. Response Time
We determined response time by calculating the time it took a participant to press the button after the correct visual condition appeared in the AR headset. When calculating response time, we did not include any incorrect button hits; for example, if the participant hit the button when the square shape appeared when the correct condition was a triangle. A Shapiro-Wilks test on response time per visual stimulus showed that the data was non-normal (W = 0.97, p < 0.01). We applied a log-transform [77] to the distributions and used the transformed data for analysis, but the mean response times we report are the actual measured values. A Mauchly Test for Sphericity showed that the data had equal variances. A one-way repeated measures ANOVA (RM-ANOVA) found a significant main effect of type of visual stimulus (color, text, shapes) on response time (F2,70 = 34.84, p < 0.0001). A Bonferroni post-hoc comparison showed that the participants had a significantly faster response time for color (M = 1.33s, SD = 0.37), than shapes (M = 1.67s, SD = 0.4) or text (M = 1.92s, SD = 0.54).
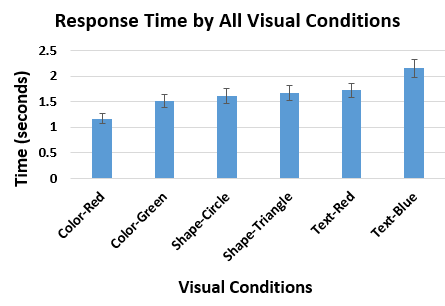
We further analyzed response time by examining all separate visual conditions (color red, color green, circle shape, triangle shape, “red” text, and “blue” text) (Figure 4). A Shapiro-Wilks test on response time per visual condition showed that the data was skewed (W = 0.95, p < 0.0001). We applied a log-transform [77] to the distributions and used the transformed data for analysis, but the mean response times reported in the paper are the actual measured values. A Mauchly Test for Sphericity showed that the data did not have equal variances (p < 0.05); therefore, we applied a Greenhouse-Geisser correction. A one-way RM-ANOVA found a significant main effect of type of visual condition (color red, color green, circle shape, triangle shape, “red” text, and “blue” text) on response time (F3.99,139.41 = 23.03, p < 0.0001). A Bonferroni post-hoc comparison showed that the participants had a significantly faster response time for color red (M = 1.17s, SD = 0.4) and a significantly slower response time for “blue” (M = 2.14s, SD = 0.68) when compared to all other visual conditions. There was no significant difference between the circle shape (M = 1.62s, SD = 0.59) and triangle shape (M = 1.69s, SD = 0.48). Altogether, participants had the fastest response time for color, more specifically for the color red, and had the slowest response time for text.
4.4.2. Error Rate
In our study, we examined three possible types of errors: not hitting the button when the correct visual condition appeared (missing the correct visual condition), hitting the button for the wrong visual condition (wrong button hit), and overall error rate (i.e., combining the two types). A Shapiro-Wilks test on error rate per visual stimulus found that the data was severely skewed for all three types: missing the correct visual condition (W = 0.68, p < 0.0001), wrong button hit (W = 0.56, p < 0.0001), and overall error rate (W = 0.77, p < 0.0001). For overall error rate, a Mauchly Test for Sphericity found that the data met the assumption of equal variances; therefore, we applied the Aligned Rank Transform [78]. A one-way RM-ANOVA found no significant effect of visual stimulus type on overall error rate (F2,70 = 2.89, n.s.). All types of visual stimulus had a low error rate: color (1.65%), text (1.3%), and shapes (1.04%).
Next, we analyzed when the participants missed the correct visual condition. A Mauchly Test for Sphericity found that the data met the assumption of equal variances; therefore, we applied the Aligned Rank Transform [78]. A one-way RM-ANOVA found no significant effect of visual stimulus type on missing the correct visual condition (F2,70 = 0.54, n.s.). We analyzed the wrong hit errors (e.g., hitting the button for the text “green”, when the condition was “blue”). A Mauchly Test for Sphericity showed that the data did not have equal variances (p < 0.0001). Since the data was not normal and did not meet the assumption of equal variances we conducted a Friedman test, which found a significant main effect of visual stimulus on hitting the button for the wrong condition (χ2 (2) = 9, p <0.05). A Bonferroni post-hoc comparison showed that color had significantly more wrong hit errors than shapes and text; there was no difference between text and shapes.
To examine the wrong hit errors further, we analyzed all separate visual conditions (color red, color green, circle shape, triangle shape, “red” text, and “blue” text). A Mauchly Test for Sphericity showed that the data did not have equal variances (p < 0.0001). Since the data was not normal and did not meet the assumption of equal variances we conducted a Friedman test, which found a significant main effect of type of visual conditions on wrong hit errors (χ2 (5) = 34.8, p <0.0001). A Bonferroni post-hoc comparison found that only color green had significantly more wrong hit errors than all other visual conditions. There was a total of 39 wrong hit errors, and 66.7% (26/39) of them were during the color green condition. During the color conditions, the colors red, green, blue, and yellow would cycle in the headset. We found that 96.15% (25/26) of the wrong hits during the color green condition were hit when the color was yellow. Participants frequently commented on having a hard time differentiating yellow and green. For instance, P6 stated “Color required the least mental thought with the exception that the yellow and green are similar, and when I saw yellow I had to make sure it wasn’t green.” This is most likely due to the AR headset display quality, as it can affect users’ color perception [24,26]. Generally, the three types of visual stimulus did not have a significant difference in error rate and participants discerned the correct visual condition, resulting in low error rates.
4.4.3. Math Solve Time
We examined the participants’ math solve time to investigate if participants were focusing on the math application for each visual stimulus type. We were not interested in how fast the participants completed the math problems since we told the participants to take their time, but rather analyzed the math solve time to make sure they were consistently focusing on the math application between the different study blocks. A Shapiro-Wilks test on response time per visual stimulus showed that the data was non-normal (W = 0.85, p < 0.0001). We applied a log-transform [77] to the distributions and used the transformed data for analysis. A Mauchly Test for Sphericity showed that the data had equal variances. A one-way RM-ANOVA found no significant effect of visual stimulus type on math solve time (F2,70 = 0.56, n.s.). The consistency in solve time between the different types of visual stimulus corroborates that participants considered the multiplication problems their main task.
4.4.4. Perceived Cognitive Workload
The participants completed the weighted NASA TLX [65] for each type of visual stimulus (color, text, shapes). A Shapiro-Wilks test found that the data was normal, and a Mauchly Test for Sphericity showed that the data met the assumption of equal variances. A one-way RM-ANOVA found a significant main effect of type of visual stimulus on perceived cognitive workload (F2,70 = 8.97, p < 0.001). A Bonferroni post-hoc comparison found that text (M = 45.08, SD = 17.33) had a significantly higher perceived cognitive workload compared to color (M = 36.46, SD = 18.35) and shapes (M = 38.43, SD = 17.04); there was no significant difference between color and shapes. The participants found text to be more cognitively demanding.
4.5. Subjective Preference
At the end of the study, we asked the participants to rank the three types of visual stimulus in their order of preference: from most preferred to least preferred (1 to 3). A Friedman test found a significant relationship between preference rank and type of visual stimulus (χ2 (2) = 47.2, p <0.0001). A Bonferroni post-hoc comparison found that color (M = 1.31, SD = 0.52) and shapes (M = 1.81, SD = 0.52) were ranked significantly higher than text (M = 2.89, SD = 0.40). Color was highly preferred, with 72% (26/36) of the participants ranking it as their first choice. Text was overwhelmingly the least preferred, with 92% (33/36) of the participants ranking it last. The participants preferred color and shapes over text for critical information.
4.6. Discussion
For our experiment on critical information, we found that existing perception findings can be applied to AR headsets. Our results are consistent with literature on visual perception [23,79], which shows a hierarchy of salient visual features. People can more easily detect color, followed by shapes, and then text. Participants in our study frequently remarked about not having to divert their focus away from the math problems to discern the different colors. AR headsets can lead to difficulties in object recognition and legibility, as well as impact users’ color perception [24]. Having an inaccurate perception of color comprises the users’ interpretation of display elements which is necessary in contexts that rely on color-coding (e.g., military). Therefore, understanding that we can utilize prior work on visual features helps in designing salient critical information for AR headsets. Also, understanding how to design salient information in AR headsets is important because visual salience can help working memory [80], which is crucial during complex tasks. The AR headset system for helping farmers operate and monitor agricultural machines in [39] provided warnings in the display if something was wrong with the machines. The warning consisted of the word “ALERT” in black text on a red background in the periphery of the display. While the authors use color, it might be more beneficial to utilize a distinct shape instead of text. Also, the authors should place the warning in the center location instead of the periphery to increase saliency.
In addition, examining differences between specific conditions led to further insight into how to design critical information for AR headsets. When we analyzed the two separate visual conditions for color (red and green), we found a significant difference in response time. The participants had a faster response time for color red when compared to all other visual conditions, including color green, which is consistent with prior work [81]. Color also had significantly more wrong hit errors than shapes and text, which we found was due to the color green condition. The participants frequently confused yellow and green, which strengthens the argument for utilizing high contrast elements in AR [28], especially for critical information. Yellow and green are analogous colors, as they are grouped next to each other on the color wheel. Designers should consider color choice for critical information in AR headsets and avoid using analogous colors to denote separate information.
Shapes were the second most effective in aiding awareness for critical information. The majority of the participants (25/36) ranked shapes as their second choice, and shapes had the second fastest participant response time. One interesting factor that the participants mentioned was looking for specific aspects of the shapes to determine if it was the correct visual condition, such as corners. For example, P16 stated “Shapes were a mix, since looking for points like a triangle could cause you to mix up shapes like stars as well.” In addition to designers avoiding analogous colors, designers should also avoid using shapes that have similar characteristics (e.g., points).
Text was the least effective in helping awareness for critical information; the participants had the slowest response time, highest cognitive workload, and lowest preference for text. The majority of the participants (33/36) ranked text as their least preferred, due to having to pay more attention and actually read the text. We did find a significant difference in response time between the two visual conditions in which the participant had to press the button (“red” and “blue”), which aligns with prior work on processing times based on word length [69]. Our study confirms that designers should consider word length when designing for critical information in AR headsets. Depending on the context, including text in an AR headset may be necessary to effectively communicate the desired information. For instance, prior work recommends that text should not be completely removed for instructions, as it can lead to fewer errors and faster learning times [50]. We recommend that there needs to be a balance between providing the information and not cognitively overloading the user. Based on our findings, designers should incorporate more visually salient information (e.g., color, shapes) when possible, for critical information in AR headsets to aid in situational awareness.
5. Experiment 2: Secondary Information
While visual saliency is essential for critical information, secondary information does not have this restriction, and therefore can display larger quantities of detailed information. Since secondary information does not need to be as visually salient, there are more opportunities to integrate it with the environment. Therefore, we examined three textual presentation styles for secondary information: locked to the display view (Display), located in the environment (Environment), and a mix of both (Mixed Environment). We chose to study text because it is commonly used to denote information in AR headset applications and may be necessary depending on the context [14,23,30,44,46]. This experiment is an extension of prior work [29].
5.1. Participants
We had 33 adults participate in our study (M = 21.55 years, SD = 3.55); however, we excluded one male participant due to equipment failure and two participants (one female, one male) for self-reported peripheral vision loss. Therefore, we had 30 participants (M = 21.63 years, SD = 3.69) for analysis, which consisted of seventeen males, twelve females, and one non-binary participant. Two of the participants were left-handed, seventeen had prior experience with AR headsets, and all had normal or corrected-to-normal vision.
5.2. Method and Design
During the study, participants completed multiplication problems on a touchscreen tablet (same as our first study) while viewing textual secondary information in an AR headset in three different presentation styles. The participants took part in the study for approximately 60 minutes in a windowless room, and either volunteered without compensation or received extra credit in a course they were taking.
The structure of the study was similar to our first experiment. After consenting to participate, participants completed a demographic questionnaire. The participants then completed a 5-minute practice round of multiplication problems on the tablet without wearing the AR headset to get comfortable with the math application; which was not used in analysis. After the math practice, participants put on the AR headset and completed three study blocks (5-minutes each), one per presentation style (Display, Environment, Mixed Environment). After completing a block, the participants would take the NASA TLX [65] for that presentation style, and then we would ask the participants to recall the last textual information displayed in the headset. We did not explain beforehand that we would ask them to recall the last presented information in the headset, which allowed us to examine if there was a difference in perception and comprehension. We counterbalanced the order of the presentation styles across participants.
5.2.1. Secondary Textual Information
The content of the secondary textual information included the participant’s average math problem completion time, the participant’s math accuracy, and a random word (Figure 5). Before the start of each study, we explained the content and how it would be presented in the headset to the participant; the information was always presented in the same order. Like in our first study, the text was in Liberation Sans font since prior work recommends using sans-serif fonts for readability [67]. Each textual element was placed 75 mm apart.
The participant’s average math problem completion time was presented in minutes and seconds (e.g., “2:36”). The math accuracy was the number of correct problems over total completed (e.g., “2/3”). Both the average completion time and accuracy were updated in real-time after the participant completed a problem. For the random word, the text would randomly cycle between four words: “apple”, “banana”, “lemon”, and “orange”. Each word would remain in the headset for a random time interval (20 to 40 seconds) before switching. We used the random word as a substitute for information that may be necessary but not essential for situational awareness.
5.2.2. AR Textual Presentation Styles
The three different presentation styles included: Display, Environment, and Mixed Environment. For the Display presentation style, the textual information was locked to the left-hand side of the AR headset field-of-view and superimposed over the users’ environment (Figure 5a). As mentioned earlier, we decided to place the secondary information on the left-side because we did not want the quantity of the information to block the participant’s view, there was no significant difference in response time between the center and left-side locations in our exploratory study, and people exhibit pseudoneglect (i.e., leftward visual bias) [60,61]. Same as our first experiment, text height was 5 mm and white, which is consistent with recommendations [66]. The information was always present in the AR headset field-of-view, which is different than the Environment presentation style. For the Environment style, the text was superimposed and fixed in the environment to the left of the participant; therefore, it was more conformal to the environment. Consistent with design recommendations, the text was 500 mm away from the participant with a height of 10 mm [66]. In Figure 5b of the Environment style, the participant is looking directly at the text in the headset. If the participant looked away from the text (e.g., down or to the right) they would not be able to see the information. The Mixed Environment presentation style was a mix of both of the previous styles. The text was superimposed and always present in the AR headset field-of-view (same as Display) but was 500 mm away from the participant with a height of 10 mm (same as Environment). Although the text was always present in the headset, having the text 500 mm away from the participant placed the textual information more into the participant’s central view (Figure 5c).
5.3. Equipment
Both the AR application and multiplication application were created using Unity [58]. The AR application was run on the same Meta 2 AR headset [55] as the previous studies, and the math application was run on the same Wacom tablet [76] as the critical information study.
5.4. Data Analysis and Results
We analyzed the presentation styles by investigating participants’ accuracy of recalled information, math solve time, cognitive workload, and subjective preference.
5.4.1. Information Recall
After each study block, we asked the participants to recall the last textual information that was displayed in the AR headset (i.e., average math time, math accuracy, random word). The participants were unaware that we were going to ask this information; therefore, they were truly unsuspecting for the first study block but became aware for the remaining two study blocks. To capture this difference we split our analysis into two categories: first response recall (first presentation style) and habituated response recall (other styles). First response recall captures the natural perceptibility of the presentation styles, while habituated response recall is more aligned with real-life settings in which the users are conscious of what information they have to monitor. For both first response and habituated response recalls, we calculated the percentage of correct answers for each participant’s presentation style. A participant’s answer had to directly match the last information presented in the AR headset to be considered correct. A Shapiro-Wilks test showed that the data was non-normal for both first response recall (W = 0.85, p < 0.001) and habituated response recall W = 0.87, p < 0.0001). They both met the assumption of equal variances, so we applied the Aligned Rank Transform [78].
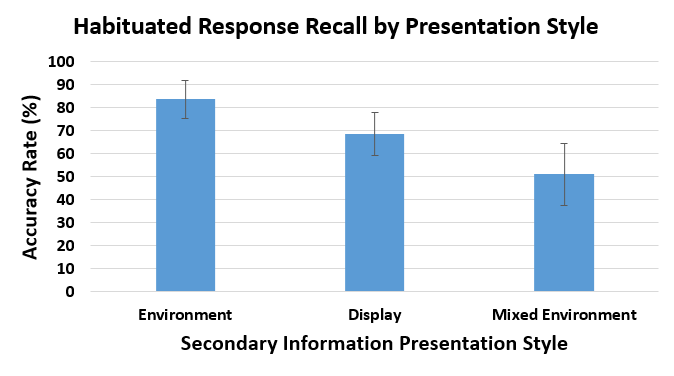
For first response recall, a one-way ANOVA found no significant effect of type of presentation style on recall accuracy (F2,27 = 1.64, n.s.); there was no significant difference between the Display (M = 60.0%, SD = 21.1%), Environment (M = 67.5%, SD = 23.7%), and Mixed Environment (M = 50.0%, SD = 20.4%) styles. However, for habituated response recall, a one-way RM-ANOVA found a significant main effect of type of presentation type on recall accuracy (F2,44.05 = 8.91, p < 0.0001). A Bonferroni post-hoc test showed that participants had a significantly higher habituated response recall accuracy for the Environment style (M = 83.8%, SD = 18.6%) than the Mixed Environment style (M = 51.2%, SD = 30.9%) (Figure 6); there was no significant difference between the Environment and Display (M = 68.8%, SD = 21.3%) styles. We examined each secondary information separately, and only found a significant effect of presentation style on the random word accuracy (p < 0.001, Fisher’s exact test [82]). A pairwise test of independence with a Bonferroni correction only found a significant difference between the Environment and Mixed Environment styles. The Environment style had a higher number of correct recall events for the random word than the Mixed Environment style (18 correct vs. 6 correct).
5.4.2. Math Solve Time
As in the first study, we examined the participants’ math solve time to investigate if participants were focusing on the math application for each presentation style. A Shapiro-Wilks test found that the data was severely skewed (W = 0.70, p < 0.0001) and a Mauchly Test for Sphericity showed that the data did not have equal variances (p < 0.0001). Since the data was not normal and did not meet the assumption of equal variances we conducted a Friedman test, which did not find a significant effect of presentation style on math solve time (χ2 (2) = 3.27, n.s.). The consistency in solve time between the different types of presentation styles corroborates that participants considered the math as their main task.
5.4.3. Perceived Cognitive Workload
We analyzed the participants’ perceived cognitive workload for each presentation style. A Shapiro-Wilks test on cognitive workload per presentation style showed that the data was non-normal (W = 0.96, p < 0.05), and the data met the assumption of equal variances using a Mauchly Test for Sphericity; therefore, we applied the Aligned Rank Transform [78]. A one-way RM-ANOVA found no significant effect of type of presentation style on perceived cognitive workload (F2,58 = 0.12, n.s.). There was no significant difference in participants’ perceived cognitive workload between the three presentation styles: Display (M = 31.5, SD = 17.5), Environment (M = 31.73, SD = 16.04), and Mixed Environment (M = 30.9, SD = 13.89).
5.4.4. Subjective Preference
After the participants completed the study blocks, we asked them to rank the three types of presentation styles in their order of preference: from most preferred to least preferred (1 to 3). A Friedman test found no significant relationship between preference rank and type of presentation style (χ2 (2) = 4.2, n.s.). There was no significant difference in preference between the styles: Display (M = 1.9, SD = 0.8), Environment (M = 1.8, SD = 0.85), and Mixed Environment (M = 2.3, SD = 0.75).
5.5. Discussion
The only significant difference we found between the three presentation styles (Display, Environment, Mixed Environment) was for habituated response recall accuracy. The Environment presentation style had a higher habituated response recall accuracy than the Mixed Environment style. With further examination, we only found a significant effect of presentation style on the random word accuracy. During the study, participants frequently mentioned that they were more interested in the math completion time and accuracy, instead of the random word, since they were related to the main task and their performance. Therefore, the Environment presentation style resulted in higher user perceptibility, since it aided in the awareness of information that did not capture the participants’ attention (i.e., random word).
For the Mixed Environment style, having the textual information further into the participants’ central field of vision made it more distracting to the participants. For example, P13 stated “The mixed environment was too distracting and put too much pressure on me to get more problems right”, and P21 stated “It [The Mixed Environment style] would block some of my work or the math problem.” With the Environment presentation style, the participants could look at the information when they wanted. One participant (P8) stated “[The Environment style] didn’t get in my way so I didn’t have to block it out of my vision while completing the math problems. It was nice to look up at it when I felt the need to.” Although the Display style was always present in the headset field-of-view like the Mixed Environment style, participants remarked that it was easier to disregard since it was more in the periphery. Both the Display and Environment presentation styles allowed the participants to view, as well as tune out, the secondary information whenever they preferred. This resulted in a stronger focus when the participants did pay attention to the information, which led to higher recall accuracy.
Both the Display and Environment styles aided user perception and comprehension for secondary textual information. However, prior work has found that text notifications locked to the field-of-view in both virtual reality (VR) [83] and AR [84] headsets result in a higher sense of urgency. For instance, the authors in [83] found that text notifications locked to a VR headset display resulted in users viewing them as more imperative than text notifications in the environment. Also, the authors in [84] conducted a study examining different locations of notifications in an AR headset display during social conversations. The notifications placed in the direct center of the field-of-view were perceived as urgent and intrusive, when compared to notifications that were slightly offset. Secondary information should be subtle and in the background, while, as mentioned in our first experiment, critical information should be salient and require promptness [27]. Therefore, we recommend that AR headset application designers use the Environment style for supplementary secondary information and the Display style for information that requires urgency to increase users’ perception and comprehension.
6. Limitations and Future Work
Our results provide insight into the design of critical and secondary information in AR headset displays for users’ situational awareness (i.e., perception and comprehension); however, there are some limitations. First, we only examined three types of visual stimulus for critical information and three secondary information presentation styles. In addition, we mainly focused on perception (level 1). Future work can analyze different types of information, as well as comprehension (level 2) and prediction (level 3). Another limitation for the first study was that the visual stimulus constantly changed, which could have prompted the participants to be more aware and closely monitor the stimulus. Prior work has found that motion has a high perception accuracy for peripheral visual notifications on computer screens (i.e., participants were able to quickly perceive the notifications), but it can also distract from the primary task [59,85]. Although the constant change may have prompted the participants, it does not detract from our main goal of comparing different types of stimuli.
7. Conclusion
We conducted two studies on how to present critical and secondary information in AR headsets to aid in users’ situational awareness: one examining if existing findings on the perceptibility of three types of visual stimulus (color, text, shapes) can be applied to AR headsets for critical information, and one analyzing three presentation styles for textual secondary information (Display, Environment, Mixed Environment). Our results showed that the Display and Environment presentation styles improved the awareness of textual secondary information; participants had a higher recall of information when compared to the Mixed Environment presentation style. For critical information, we found similar results to prior work; the participants perceived color faster, and had a slower response time and higher cognitive workload for text. We contribute design recommendations on how to present critical and secondary information in AR headset displays to aid in users’ situational awareness, which is essential to understand in safety crucial domains such as the military and healthcare.
Institutional Review Board Statement
All participants consented before they participated in the studies. The studies were conducted in accordance with the Declaration of Helsinki, and the protocols were approved by the University of Florida Institutional Review Board.
Conflict of Interest
The authors declare no conflict of interest.
Acknowledgment
This work is partially supported by National Science Foundation Grant Award #IIS-1750840 and the National Science Foundation Graduate Research Fellowship under Grant No. DGE-1842473. Any opinions, findings, conclusions, and recommendations expressed in this paper are those of the authors and do not necessarily reflect these agencies’ views.
- W.F. van Krevelen, R. Poelman, “A Survey of Augmented Reality Technologies, Applications and Limitations,” The International Journal of Virtual Reality, vol. 9, no. 2, pp. 1–20, 2010, doi:10.1155/2011/721827.
- Vardomatski, Augmented And Virtual Reality After Covid-19, https://www.forbes.com/sites/forbestechcouncil/2021/09/14/augmented-and-virtual-reality-after-covid-19/?sh=1b886d882d97, 2021.
- A. Olney, Augmented Reality | All About Holograms, American Library Association: 1–16, 2019.
- Meta, Meta Augmented Reality, https://www.metavision.com/, Apr. 2019.
- Augmented Reality Is A Game Changer For Oil & Gas, https://oilprice.com/Energy/Energy-General/Augmented-Reality-Is-A-Game-Changer-For-Oil-Gas.html, May 2022.
- R. Endsley, “Toward a Theory of Situation Awareness in Dynamic Systems,” Human Factors, vol. 37, no. 1, pp. 32–64, 1995, doi:10.1518/001872095779049543.
- R. Endsley, “Design and Evaluation for Situation Awareness Enhancement,” Proceedings of the Human Factors Society Annual Meeting, vol. 32, no. 2, pp. 97–101, 1988, doi:10.1177/154193128803200221.
- A. Stanton, P.R.G. Chambers, J. Piggott, “Situational Awareness and Safety,” Safety Science, vol. 39, no. 3, pp. 189–204, 2001, doi:10.1016/S0925-7535(01)00010-8.
- W. Reader, P. O’Connor, “The Deepwater Horizon Explosion: Non-technical Skills, Safety Culture, and System Complexity,” Journal of Risk Research, vol. 17, no. 3, pp. 405–424, 2014, doi:10.1080/13669877.2013.815652.
- M. Schulz, V. Krautheim, A. Hackemann, M. Kreuzer, E.F. Kochs, K.J. Wagner, “Situation Awareness Errors in Anesthesia and Critical Care in 200 Cases of a Critical Incident Reporting System,” BMC Anesthesiology, vol. 16, no. 4, pp. 10pp, 2016, doi:10.1186/s12871-016-0172-7.
- E.Gans, D. Roberts, M. Bennett, H. Towles, A. Menozzi, J. Cook, T. Sherrill, “Augmented Reality Technology for Day/Night Situational Awareness for the Dismounted Soldier,” in: Desjardins, D. D., Sarma, K. R., Marasco, P. L., and Havig, P. R., eds., in Display Technologies and Applications for Defense, Security, and Avionics, International Society for Optics and Photonics: Article 9470, 2015, doi:10.1117/12.2177086.
- Z. Zhu, V. Branzoi, M. Wolverton, G. Murray, N. Vitovitch, L. Yarnall, G. Acharya, S. Samarasekera, R. Kumar, “AR-Mentor: Augmented Reality Based Mentoring System,” in IEEE International Symposium on Mixed and Augmented Reality (ISMAR ’14), IEEE: 17–22, 2014, doi:10.1109/ISMAR.2014.6948404.
- M. Wallmyr, T.A. Sitompul, T. Holstein, R. Lindell, “Evaluating Mixed Reality Notifications to Support Excavator Operator Awareness,” in IFIP Conference on Human-Computer Interaction (INTERACT ’ 19), Springer, Cham: 743–762, 2019, doi:10.1007/978-3-030-29381-9_44.
- Z. Liu, S.A. Jenkins, P.M. Sanderson, M.O. Watson, T. Leane, A. Kruys, W.J. Russell, “Monitoring with Head-Mounted Displays: Performance and Safety in a Full-Scale Simulator and Part-Task Trainer,” Anesthesia & Analgesia, vol. 109, no. 4, pp. 1135–1146, 2009, doi:10.1213/ANE.0b013e3181b5a200.
- T. Pascale, P. Sanderson, D. Liu, I. Mohamed, B. Brecknell, R.G. Loeb, “The Impact of Head-Worn Displays on Strategic Alarm Management and Situation Awareness,” Human Factors, vol. 61, no. 4, pp. 537–563, 2019, doi:10.1177/0018720818814969.
- S. Ruano, C. Cuevas, G. Gallego, N. García, “Augmented Reality Tool for the Situational Awareness Improvement of UAV Operators,” Sensors, vol. 17, no. 2, pp. Article 297, 2017, doi:10.3390/s17020297.
- B-J. Park, C. Yoon, J.-W. Lee, K.-H. Kim, “Augmented Reality Based on Driving Situation Awareness in Vehicle,” in International Conference on Advanced Communication Technology (ICACT’15), IEEE: 593–595, 2015, doi:10.1109/ICACT.2015.7224865.
- D.Aschenbrenner, N. Maltry, J. Kimmel, M. Albert, J. Scharnagl, K. Schilling, “ARTab – Using Virtual and Augmented Reality Methods for an Improved Situation Awareness for Telemaintenance,” IFAC-PapersOnLine, vol. 49, no. 30, pp. 204–209, 2016, doi:10.1016/J.IFACOL.2016.11.168.
- K-H. Kim, K.-Y. Wohn, “Effects on Productivity and Safety of Map and Augmented Reality Navigation Paradigms,” IEICE TRANSACTIONS on Information and Systems, vol. E94-D, no. 5, pp. 1051–1061, 2011, doi:10.1587/transinf.E94.D.1051.
- L. Hou, X. Wang, “A Study on the Benefits of Augmented Reality in Retaining Working Memory in Assembly Tasks: A Focus on Differences in Gender,” Automation in Construction, vol. 32, , pp. 38–45, 2013, doi:10.1016/J.AUTCON.2012.12.007.
- M-C. Chen, R. Klatzky, “Displays Attentive to Unattended Regions: Presenting Information in a Peripheral-Vision-Friendly Way,” International Conference on Human-Computer Interaction (HCII’07), vol. 4551, , pp. 23–31, 2007.
- C. G. Healey, K.S. Booth, J.T. Enns, “High-Speed Visual Estimation Using Preattentive Processing,” ACM Transactions on Computer-Human Interaction, vol. 3, no. 2, pp. 107–135, 1996, doi:10.1145/230562.230563.
- Y. Ishiguro, J. Rekimoto, “Peripheral Vision Annotation: Noninterference Information Presentation Method for Mobile Augmented Reality,” in Proceedings of the Augmented Human International Conference (AH’11), ACM Press, New York, New York, USA: 1–5, 2011, doi:10.1145/1959826.1959834.
- E. Kruijff, J.E. Swan, S. Feiner, “Perceptual Issues in Augmented Reality Revisited,” in IEEE International Symposium on Mixed and Augmented Reality (ISMAR ’10), IEEE: 3–12, 2010, doi:10.1109/ISMAR.2010.5643530.
- M.A. Livingston, J.L. Gabbard, J.E. Swan, C.M. Sibley, J.H. Barrow, Basic Perception in Head-Worn Augmented Reality Displays, Springer New York, New York, NY: 35–65, 2013, doi:10.1007/978-1-4614-4205-9_3.
- J.L. Gabbard, J.E. Swan, J. Zedlitz, W.W. Winchester, “More Than Meets the Eye: An Engineering Study to Empirically Examine the Blending of Real and Virtual Color Spaces,” in IEEE Virtual Reality Conference (VR ’10), IEEE: 79–86, 2010, doi:10.1109/VR.2010.5444808.
- M.R. Endsley, “Designing for Situation Awareness in Complex System,” in Proceedings of the Second International Workshop on Symbiosis of Humans, Artifacts and Environment, 14pp, 2001.
- S. Ganapathy, Design Guidelines for Mobile Augmented Reality: User Experience, Springer New York, New York, NY: 165–180, 2013, doi:10.1007/978-1-4614-4205-9_7.
- J. Woodward, J. Smith, I. Wang, S. Cuenca, J. Ruiz, “Examining the Presentation of Information in Augmented Reality Headsets for Situational Awareness,” in ACM International Conference on Advanced Visual Interfaces (AVI ’20), ACM Press: 1–5, 2020, doi:10.1145/3399715.3399846.
- S. Lukosch, H. Lukosch, D. Datcu, M. Cidota, “Providing Information on the Spot: Using Augmented Reality for Situational Awareness in the Security Domain,” Computer Supported Cooperative Work (CSCW ’15), vol. 24, no. 6, pp. 613–664, 2015, doi:10.1007/s10606-015-9235-4.
- S. Zollmann, C. Hoppe, T. Langlotz, G. Reitmayr, “FlyAR: Augmented Reality Supported Micro Aerial Vehicle Navigation,” IEEE Transactions on Visualization and Computer Graphics, vol. 20, no. 4, pp. 560–568, 2014, doi:10.1109/TVCG.2014.24.
- J. Fromm, K. Eyilmez, M. Baßfeld, T.A. Majchrzak, S. Stieglitz, “Social Media Data in an Augmented Reality System for Situation Awareness Support in Emergency Control Rooms,” Information Systems Frontiers, vol. 25, no. 3, pp. 303–326, 2021, doi:10.1007/S10796-020-10101-9.
- Minh Tien Phan, I. Thouvenin, V. Fremont, “Enhancing the Driver Awareness of Pedestrian Using Augmented Reality Cues,” in IEEE International Conference on Intelligent Transportation Systems (ITSC ’16), IEEE: 1298–1304, 2016, doi:10.1109/ITSC.2016.7795724.
- Colley, B. Eder, J.O. Rixen, E. Rukzio, “Efects of Semantic Segmentation Visualization on Trust, Situation Awareness, and Cognitive Load in Highly Automated Vehicles,” in Proceedings of the SIGCHI Conference on Human Factors in Computing Systems (CHI ’21), Association for Computing Machinery: 11pp, 2021, doi:10.1145/3411764.3445351.
- Rowen, M. Grabowski, J.P. Rancy, A. Crane, “Impacts of Wearable Augmented Reality Displays on Operator Performance, Situation Awareness, and Communication in Safety-Critical Systems,” Applied Ergonomics, vol. 80, , pp. 17–27, 2019, doi:10.1016/J.APERGO.2019.04.013.
- Coleman, D. Thirtyacre, “Remote Pilot Situational Awareness with Augmented Reality Glasses: An Observational Field Study,” International Journal of Aviation, Aeronautics, and Aerospace, vol. 8, no. 1, pp. 10pp, 2021, doi:https://doi.org/10.15394/ijaaa.2021.1547.
- Chen, L. Hou, G. (Kevin) Zhang, S. Moon, “Development of BIM, IoT and AR/VR technologies for Fire Safety and Upskilling,” Automation in Construction, vol. 125, no. 103631, 2021, doi:10.1016/J.AUTCON.2021.103631.
- Bhattarai, A.R. Jensen-Curtis, M. Martinez-Ramon, “An Embedded Deep Learning System for Augmented Reality in Firefighting Applications,” in IEEE International Conference on Machine Learning and Applications (ICMLA ’20), IEEE: 1224–1230, 2020, doi:10.1109/ICMLA51294.2020.00193.
- Huuskonen, T. Oksanen, “Augmented Reality for Supervising Multirobot System in Agricultural Field Operation,” IFAC-PapersOnLine, vol. 52, no. 30, pp. 367–372, 2019, doi:10.1016/J.IFACOL.2019.12.568.
- R. Velamkayala, M. V. Zambrano, H. Li, “Effects of HoloLens in Collaboration: A Case in Navigation Tasks,” Human Factors and Ergonomics Society Annual Meeting, vol. 61, no. 1, pp. 2110–2114, 2017, doi:10.1177/1541931213602009.
- Blattgerste, B. Strenge, P. Renner, T. Pfeiffer, K. Essig, “Comparing Conventional and Augmented Reality Instructions for Manual Assembly Tasks,” in Proceedings of the International Conference on Pervasive Technologies Related to Assistive Environments (PETRA ’17), ACM Press, New York, New York, USA: 75–82, 2017, doi:10.1145/3056540.3056547.
- Wang, M. Parsons, J. Stone-McLean, P. Rogers, S. Boyd, K. Hoover, O. Meruvia-Pastor, M. Gong, A. Smith, “Augmented Reality as a Telemedicine Platform for Remote Procedural Training,” Sensors, vol. 17, no. 10, pp. Article 2294, 2017, doi:10.3390/s17102294.
- Datcu, S. Lukosch, H. Lukosch, “Comparing Presence, Workload and Situational Awareness in a Collaborative Real World and Augmented Reality Scenario,” IEEE ISMAR Workshop on Collaboration in Merging Realities (CiMeR ’13), pp. 6pp, 2013, doi:https://research.tudelft.nl/.
- Rzayev, P.W. Wozniak, T. Dingler, N. Henze, “Reading on Smart Glasses: The Effect of Text Position, Presentation Type and Walking,” in Proceedings of the SIGCHI Conference on Human Factors in Computing Systems (CHI’18), ACM Press, New York, New York, USA: 9pp, 2018, doi:10.1145/3173574.3173619.
- Albarelli, A. Celentano, L. Cosmo, R. Marchi, “On the Interplay between Data Overlay and Real-World Context using See-through Displays,” in Proceedings of the Biannual Conference on Italian SIGCHI Chapter (CHItaly’15), ACM Press, New York, New York, USA: 58–65, 2015, doi:10.1145/2808435.2808455.
- Orlosky, K. Kiyokawa, H. Takemura, “Managing Mobile Text in Head Mounted Displays: Studies on Visual Preference and Text Placement,” ACM SIGMOBILE Mobile Computing and Communications Review, vol. 18, no. 2, pp. 20–31, 2014, doi:10.1145/2636242.2636246.
- Kim, M.A. Nussbaum, J.L. Gabbard, “Influences of Augmented Reality Head-Worn Display Type and User Interface Design on Performance and Usability in Simulated Warehouse Order Picking,” Applied Ergonomics, vol. 74, , pp. 186–193, 2019, doi:10.1016/J.APERGO.2018.08.026.
- Ariansyah, J.A. Erkoyuncu, I. Eimontaite, T. Johnson, A.M. Oostveen, S. Fletcher, S. Sharples, “A Head Mounted Augmented Reality Design Practice for Maintenance Assembly: Toward Meeting Perceptual and Cognitive Needs of AR Users,” Applied Ergonomics, vol. 98, , pp. 103597, 2022, doi:10.1016/J.APERGO.2021.103597.
- Gattullo, L. Dammacco, F. Ruospo, A. Evangelista, M. Fiorentino, J. Schmitt, A.E. Uva, “Design Preferences on Industrial Augmented Reality: A Survey with Potential Technical Writers,” in IEEE International Symposium on Mixed and Augmented Reality (ISMAR ’20), IEEE: 172–177, 2020, doi:10.1109/ISMAR-ADJUNCT51615.2020.00054.
- Irrazabal, G. Saux, D. Burin, “Procedural Multimedia Presentations: The Effects of Working Memory and Task Complexity on Instruction Time and Assembly Accuracy,” Applied Cognitive Psychology, vol. 30, no. 6, pp. 1052–1060, 2016, doi:10.1002/ACP.3299.
- Sekiguchi, A.A. Nugraha, Y. Du, Y. Bando, M. Fontaine, K. Yoshii, “Direction-Aware Adaptive Online Neural Speech Enhancement with an Augmented Reality Headset in Real Noisy Conversational Environments,” in International Conference on Intelligent Robots and Systems (IROS ’22), 9266–9273, 2022, doi:10.1109/IROS47612.2022.9981659.
- Debernardis, M. Fiorentino, M. Gattullo, G. Monno, A.E. Uva, “Text Readability in Head-Worn Displays: Color and Style Optimization in Video versus Optical See-Through Devices,” IEEE Transactions on Visualization and Computer Graphics, vol. 20, no. 1, pp. 125–139, 2014, doi:10.1109/TVCG.2013.86.
- J. Dudley, J.T. Jacques, P.O. Kristensson, “Crowdsourcing Design Guidance for Contextual Adaptation of Text Content in Augmented Reality,” in SIGCHI Conference on Human Factors in Computing Systems – Proceedings, Association for Computing Machinery: 14pp, 2021, doi:10.1145/3411764.3445493.
- Stearns, L. Findlater, J.E. Froehlich, “Design of an Augmented Reality Magnification Aid for Low Vision Users,” in International ACM SIGACCESS Conference on Computers and Accessibility (ASSETS’ 18), ACM: 28–39, 2018, doi:10.1145/3234695.3236361.
- Brown, Meta 2: Full Specification, https://vr-compare.com/headset/meta2, May 2022.
- Ando, N. Kida, S. Oda, “Central and Peripheral Visual Reaction Time of Soccer Players and Nonathletes,” Perceptual and Motor Skills, vol. 92, no. 3, pp. 786–794, 2001, doi:10.2466/pms.2001.92.3.786.
- Berlucchi, W. Heron, R. Hyman, G. Rizzolatti, C. Umiltà, “Simple Reaction Times of Ipsilateral and Contralateral Hand to Lateralized Visual Stimuli,” Brain, vol. 94, no. 3, pp. 419–430, 1971, doi:10.1093/brain/94.3.419.
- Unity, https://unity3d.com/, 2022.
- Mairena, C. Gutwin, A. Cockburn, “Peripheral Notifications in Large Displays: Effects of Feature Combination and Task Interference,” in Proceedings of the SIGCHI Conference on Human Factors in Computing Systems (CHI’19), ACM Press, New York, New York, USA: 12pp, 2019, doi:10.1145/3290605.3300870.
- Bowers, K.M. Heilman, “Pseudoneglect: Effects of Hemispace on a Tactile Line Bisection Task,” Neuropsychologia, vol. 18, no. 4–5, pp. 491–498, 1980, doi:10.1016/0028-3932(80)90151-7.
- A. Thomas, O. Schneider, C. Gutwin, L.J. Elias, “Dorsal Stream Contributions to Perceptual Asymmetries,” Journal of the International Neuropsychological Society : JINS, vol. 18, no. 2, pp. 251–259, 2012, doi:10.1017/S1355617711001585.
- D. Christman, C.L. Niebauer, “The Relation Between Left-Right and Upper-Lower Visual Field Asymmetries: (Or: What Goes Up Goes Right While What’s Left Lays Low),” Advances in Psychology, vol. 123, , pp. 263–296, 1997, doi:10.1016/S0166-4115(97)80076-3.
- K. Smith, I. Szelest, T.E. Friedrich, L.J. Elias, “Native Reading Direction Influences Lateral Biases in The Perception of Shape From Shading,” Laterality, vol. 20, no. 4, pp. 418–433, 2014, doi:10.1080/1357650X.2014.990975.
- ISO 7010:2011 Graphical symbols, https://www.iso.org/standard/54432.html, 2011.
- G. Hart, “Nasa-Task Load Index (NASA-TLX); 20 Years Later,” Proceedings of the Human Factors and Ergonomics Society Annual Meeting, vol. 50, no. 9, pp. 904–908, 2006, doi:10.1177/154193120605000909.
- Mealy, Planning Your Augmented Reality Project, John Wiley & Sons, Inc. : 159–161, 2018.
- Rello, R. Baeza-Yates, “How to Present More Readable Text for People with Dyslexia,” Universal Access in the Information Society, vol. 16, no. 1, pp. 29–49, 2017, doi:10.1007/s10209-015-0438-8.
- J. McKeefry, N.R.A. Parry, I.J. Murray, “Simple Reaction Times in Color Space: The Influence of Chromaticity, Contrast, and Cone Opponency,” Investigative Opthalmology & Visual Science, vol. 44, no. 5, pp. 2267–2276, 2003, doi:10.1167/iovs.02-0772.
- Kuperman, H. Stadthagen-Gonzalez, M. Brysbaert, “Age-Of-Acquisition Ratings for 30,000 English Words,” Behavior Research Methods, vol. 44, no. 4, pp. 978–990, 2012, doi:10.3758/s13428-012-0210-4.
- H. Logie, K.J. Gilhooly, V. Wynn, “Counting on Working Memory in Arithmetic Problem Solving,” Memory & Cognition, vol. 22, no. 4, pp. 395–410, 1994, doi:10.3758/BF03200866.
- Baddeley, “Working Memory,” Science, vol. 255, no. 5044, pp. 556–559, 1992, doi:10.1126/SCIENCE.1736359.
- Miller, M. Perlmutter, D. Keating, “Cognitive Arithmetic: Comparison of Operations,” Journal of Experimental Psychology: Learning, Memory, and Cognition, vol. 10, no. 1, pp. 46–60, 1984, doi:10.1037/0278-7393.10.1.46.
- I.D. Campbell, D.J. Graham, “Mental Multiplication Skill: Structure, Process, and Acquisition.,” Canadian Journal of Psychology, vol. 39, no. 2, pp. 338–366, 1985, doi:10.1037/h0080065.
- Lemaire, M. Fayol, “The Role of Working Memory Resources in Simple Cognitive Arithmetic,” European Journal of Cognitive Psychology, vol. 8, no. 1, pp. 73–103, 1996.
- J. Groen, J.M. Parkman, “A Chronometric Analysis of Simple Addition,” Psychological Review, vol. 79, no. 4, pp. 329–343, 1972, doi:10.1037/h0032950.
- Wacom, Professional Hybrid Creative Tablet User’s Manual About the Cintiq Companion Hybrid, 1–93, https://cdn.wacom.com/f/manual/0x0307/UM-EN.pdf, May 2022.
- N. Keene, “The Log Transformation is Special,” Statistics in Medicine, vol. 14, no. 8, pp. 811–819, 1995, doi:10.1002/sim.4780140810.
- O. Wobbrock, L. Findlater, D. Gergle, J.J. Higgins, “The Aligned Rank Transform for Nonparametric Factorial Analyses Using Only Anova Procedures,” in Proceedings of the SIGCHI Conference on Human Factors in Computing Systems (CHI’11), ACM Press, New York, New York, USA: 143–146, 2011, doi:10.1145/1978942.1978963.
- Healey, J. Enns, “Attention and Visual Memory in Visualization and Computer Graphics,” IEEE Transactions on Visualization and Computer Graphics, vol. 18, no. 7, pp. 1170–1188, 2012, doi:10.1109/TVCG.2011.127.
- S. Fine, B.S. Minnery, “Visual Salience Affects Performance in a Working Memory Task,” Journal of Neuroscience, vol. 29, no. 25, pp. 8016–8021, 2009, doi:10.1523/JNEUROSCI.5503-08.2009.
- Batra, D. Jeph, S. Vyas, “Color Difference on Simple Visual Reaction Time in Young Volunteers,” International Journal of Clinical and Experimental Physiology, vol. 1, no. 4, pp. 311–313, 2014, doi:10.4103/2348-8093.149771.
- -Y. Kim, “Statistical Notes for Clinical Researchers: Chi-squared Test and Fisher’s Exact Test.,” Restorative Dentistry & Endodontics, vol. 42, no. 2, pp. 152–155, 2017, doi:10.5395/rde.2017.42.2.152.
- Rzayev, S. Mayer, C. Krauter, N. Henze, “Notification in VR: The Effect of Notification Placement, Task, and Environment,” in Computer-Human Interaction in Play (CHIPlay’19), ACM Press: 199–211, 2019, doi:10.1145/3311350.3347190.
- Rzayev, S. Korbely, M. Maul, A. Schark, V. Schwind, N. Henze, “Effects of Position and Alignment of Notifications on AR Glasses during Social Interaction,” in Proceedings of the Nordic Conference on Human-Computer Interaction (NordiCHI ’20), ACM Press, New York, NY, USA: 11pp, 2020, doi:10.1145/3419249.
- Gutwin, A. Cockburn, A. Coveney, “Peripheral Popout: The Influence of Visual Angle and Stimulus Intensity on Popout Effects,” in Proceedings of the SIGCHI Conference on Human Factors in Computing Systems (CHI ’17), ACM Press, New York, New York, USA: 208–219, 2017, doi:10.1145/3025453.3025984.