How to Fix Automation Flakiness: Root Causes and Enterprise-Level Solutions

(This article belongs to the Section Hardware and Architecture – Computer Science (HAC))
Export Citations
Cite
Tiwari, S. K. (2026). How to Fix Automation Flakiness: Root Causes and Enterprise-Level Solutions. Journal of Engineering Research and Sciences, 5(2), 9–23. https://doi.org/10.55708/js0502002
Sujeet Kumar Tiwari. "How to Fix Automation Flakiness: Root Causes and Enterprise-Level Solutions." Journal of Engineering Research and Sciences 5, no. 2 (February 2026): 9–23. https://doi.org/10.55708/js0502002
S.K. Tiwari, "How to Fix Automation Flakiness: Root Causes and Enterprise-Level Solutions," Journal of Engineering Research and Sciences, vol. 5, no. 2, pp. 9–23, Feb. 2026, doi: 10.55708/js0502002.
Flakiness in automation is one of the most intractable barriers to dependable enterprise CI/CD, in which organizations can run more than 50M tests daily, and a 5-10% flaky rate may spoil thousands of builds. The paper brings together empirical research and industrial case studies on UI, API, mobile, and data pipelines to describe the prevalent flakiness root causes, such as asynchronous UI, discontinuous DOM, unsteady test data, environment latency spikes, concurrency defects, and the absence of synchronization. It advances a multi-level stability design which incorporates deterministic locator strategies, clever wait handling, resilient API contracts, controlled test-data administration, and reliability designs of cloud-based environment patterns. The method is supported with the help of AI-supported analytics, where execution telemetry, the flakiness probability score, and heatmaps would be utilized to identify unstable tests early and devote effort to remediation. Large-scale settings reported case studies indicate a 5-10% to less than 1% drop in the rate of flaky tests, infrastructure savings of up to 2 times, and savings in diagnostic effort of up to 30-50%. The paper ends with providing explicit future directions, such as achieving a >95% accuracy on automated flakiness location, benchmark and KPI standardization, and stability engineering and integration with wider practices of reliability and governance. These guidelines will help ensure that test stability is an SRE first-class objective.
1. Introduction
Automation flakiness is the phenomenon when automated tests are intermittently passed and intermittently failed, even in the absence of code or configuration interaction. This nondeterminism contradicts the assumption of the meaningful interpretation of the state of the system among tests that happen in CI/CD pipelines. It is magnified at the enterprise level. Google conducts more than 50M automated tests each day, where even a percent of intermittent failures can create thousands of bad releases and result in costly retests [1]. Flakiness is the first in the cross-layer and results in asynchronous user interfaces, dynamically augmented Document Object Model, volatile microservice API responses, variability in mobile devices, non-deterministic pipelines, and infrastructure problems. This study makes four primary contributions to the field of enterprise-scale test automation stability engineering. First, it provides a systematic taxonomy and synthesis of automation flakiness root causes across multiple layers, including UI, API, mobile, data pipeline, and infrastructure environments, based on empirical literature and industrial evidence. Second, it proposes a multi-layer stability framework that connects specific engineering interventions—such as deterministic locator design, synchronization strategies, controlled test data management, hermetic environments, and resilient API contracts—to distinct categories of flakiness, enabling actionable stability improvements at architectural and pipeline levels. Third, the paper introduces a metrics-driven stability measurement model, including flakiness rate, rerun overhead, diagnosis and repair time, and telemetry-based probabilistic flakiness scoring, supported by heatmap-style analytics for prioritizing remediation. Fourth, the study synthesizes industrial case studies and operational practices from large-scale CI/CD environments, including predictive test selection, AI-assisted root-cause localization, and self-healing automation, and integrates them into a unified conceptual and operational model to guide organizations in improving pipeline reliability, reducing maintenance cost, and achieving enterprise-grade automation maturity.
In large organizations, strategic and not accidental is flaky automation. Constant flakiness causes loss of confidence by the developer in the testing suite; engineers are willing to rerun any jobs, turn a blind eye to failures, or even turn known checks off, undermining quality gates. Flaky suites slow down the release engineering process and cause tension between engineering and operations [2]. Cost is quantified on industrial evidence. The developers are estimated to devote at least 2.5% of their time to researching, fixing, or maintaining the flaky tests, instead of creating functionalities [3]. On the platform scale, providers like Google say that they dedicate between 2% and 16% of infrastructure spending to reruns due to flakiness instead of actual defects.
This research addresses three major objectives. It analytically categorizes the major root factors of automation flakiness in user interface, application programming interface, mobile, and data pipeline layers through synthesizing empirical and industrial evidence. For Design, the study provides a multi-layer stability framework, which incorporates deterministic locator schemes, powerful moves to synchronize, controlled test data, and environment standardization. It analytically describes and constructs AI-motivated flakiness detection and prediction, like probabilistic scores and predictive test selection models that rank high-value checks in continuous integration.
Its field of interest is the pipeline of large-scale delivery enterprises. When there are more than 10k automated tests and about 100k high-volume continuous integration jobs daily, then large mono repos and federated microservice ecosystems are said to be large mono repos. Within this space, the study takes into consideration automation of web user interfaces, APIs, mobile clients, and data processing workloads, such as cross-cutting end-to-end scenarios. Instead of conducting an analysis of a single proprietary dataset, it constructs existing published empirical results and case studies of goods to construct generalizable engineering patterns and standards.
To achieve its objectives, this study has been divided into different chapters. The literature review Chapter offers a literature review on flaky tests, root causes, and mitigation methods. The methods and techniques Chapter analyzes methods of research and the suggested multi-layer framework of stability. The experiment and results chapter summarizes evidence and case observable on the involvement of measurement of the effect of interventions on flaky test rates, rerun overhead, and diagnostic effort. The discussion chapter talks about results and trade-offs, and organizational implications. The study presents future research directions of quality analytics and stability engineering. The study concludes by offering practical recommendations.
1.1. Study Positioning and Validation Approach
This work is explicitly positioned as a systematic synthesis and engineering framework paper rather than a controlled experimental study introducing a proprietary dataset. The study integrates findings from peer-reviewed empirical research, industrial case studies, and operational reports from large-scale CI/CD environments to construct a unified, actionable stability engineering model.
2. Literature Review
2.1. Conceptualizing Automation Flakiness and Test Stability
Flakiness of automation denotes an automated test property where the results do not change significantly regardless of the system being tested, which challenges the fact that test results are consistent predictors of system behavior [4]. A flaky test is a test case that periodically passes, periodically fails on the indicated sequence, and a flaky test failure is a single failing on the sequence. Non-deterministic results are opposite to deterministic tests, where repeated performances with the same condition lead to similar results. Non-determinism may be in the test code, in the application itself, or in the platform itself, and thus harder to accomplish root-cause attribution.
Previously, several types of taxonomies of flakiness have been distinguished: user interface flakiness due to asynchronous rendering or dynamic Document Object Model updates; environmental flakiness due to operating system, browser, or network variability; and flakiness due to concurrency due to thread interleaving, race conditions, or shared mutable state [5]. Others include dependency, test order dependency, the outcome depends on the temporal sequence, or configuration flakiness because of version drift in third-party libraries or infrastructure.
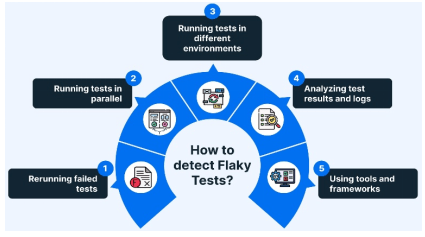
Figure 1 provides a detailed view of how sever always of detecting flaky tests are implemented in automation contexts. The approaches demonstrated are rerunning of failed tests, running tests in parallel, and running tests in a different environment, which are used to detect inconsistent test results. The figure also emphasizes the significance of test results and log analysis, and special tools and frameworks to identify and address flakiness. The strategies follow the mentioned forms of flakiness, including UI flakiness, environmental flakiness, concurrency flakiness, and test-order flakiness. The detection methods will enhance the reliability and stability of the test.
2.2. Prevalence and Cost of Flaky Tests in Large-Scale Systems
At Google, using test suites to the tune of 4.2 million, around 16% of test suites are flaky, such that tens of thousands of suites cannot be reliably deterministic. With 24 open Java systems sampled, a cross-project study, it had 810 flaky tests, of which about 75% were clusters of about 13.5 tests, implying systemic correlations of sharing fixtures or common infrastructure.
In dynamically typed systems, a Python study had shown a running probability of the absence of flaky test approaching 95% in a study that would have required about 170 reruns, which is impractical in a typical continuous integration feedback loop [6]. The data on industrial continuous integration also helps to show the economic cost: one case study reported that 0.63% of executions were rerun, but flakiness costs at least 2.5% of developer time in investigation, triage, and repair .This documentation is sufficient to justify a narrow stability-engineering agenda in which flakiness is no longer viewed as a side-effect of noise.
2.3. Root Causes across UI, API, Mobile, and Data Pipelines
Server-side and library code contain a lot of synchronous waits, concurrency defects, and test order dependency, especially when the tests must access a common database, a common cache, or a common message queue [5]. With web-based user interfaces the most problems are improper or unsynchronized assertions, assertions to an element whose state has not settled, frail locators as elements change attributes, and environmental factors, such as another browser engine or time zone. Test-runner API misuse and excessive use of generic exception handling are also identified as contributors to empirical studies of UI test suites, in particular when the is a large Selenium or Cypress test suite, of thousands of tests sharing infrastructure [7].
Mobile tests on the mobile platforms revealed that approximately 36% of flaky test failures have been traced to the mismatch of synchronization between the test thread and the test application and device fragmentation, background services, and unreliable network conditions [8]. Further causes of non-determinism in data-pipeline tests also include situations like race conditions during job scheduling, eventual consistency with distributed storage, and external use of data (through third-party APIs or upstream batch processing), which is revealed in multivocal reviews of flaky tests in continuous delivery systems. These patterns indicate that the flakiness is not simply the random noise, but in many cases, it hints at the systematic views in sync, isolation, or environmental control.
2.4. Existing Detection, Quarantine, and Mitigation Strategies
The most common and simplest mechanism that is deployed is the rerun-on-failure mechanism, where failed tests will be retried a specified number of times and labeled as flaky when the retries succeed. Although cheap to run, reruns prolong the pipeline time and fail to fix even the root causes. Quarantine testing of tests that exceed specific flakiness metrics is common in many large organizations, though, which block them on release blocks but still execute them in order to obtain information [9]. More advanced methods are based on either fixed or dynamic analysis to localize root causes, including the correlations between failure patterns in code changes and environment variables or concurrency primitives and clustering algorithms to determine systemic flakiness of sets of tests; both automated localization and humans can achieve about 82% accuracy with 428 projects at Google [10].
Simultaneously, algorithms based on machine-learning predict chances that a particular test will fail or act flakily on a specific set of change, and predictive test selection can be used to select high-value, low-noise tests, or identify faulty changes during continuous integration; the application of Predictive Test Selection at Meta with machine-learning methods has reduced the cost of testing infrastructure by half while seeing over 95% of individual test failure or more than 99.9% of defective change [11]. For compliance-based AI pipe-lines, where telemetry, traceability, and risk scoring are taken into account in the architecture to fulfill requirements of the regulatory environment, such as IEC 62304 and PCI-DSS, flakiness management is practically required to have observability end-to-end and settlement points in the test and deployment workflow [12].
Figure 1 illustrates an overview of the main approaches that have been applied in flaky test detection and mitigation during automation. Strategies related to these comprise rerun-on-failure, quarantine testing, localization of root causes, machine-learned-predictive-uses of these techniques, such as the possibility to mitigate the cost of testing infrastructure, optimize diagnosis accuracy, and systemic breakage, all of which are intended to make continuous integration pipelines more stable and efficient.
2.5. Gaps in Current Research and Practice
Published work also concentrates on each of the layers specifically, such as unit tests or user interface automation, rather than on portfolios of cross-layers, which combine with user interface locators, API contracts, test data management, and environment stability. Standardized enterprise key performance indicators and benchmarks also such as what proportion of tests flake across risk category or maximum acceptable investigation time before a flaky failure is quarantined also lacking [13]. Proactive analytics has yet to be exploited: various organizations continue to triage by hand and do not exploit execution telemetry, temporal flake patterns, or spatial clustering to produce heatmaps of flakiness and a backlog of priority remedial actions, which is starting to be explored as showing that manifestations of systemic flakiness may be concentrated in tissues of co-failing tests that can be visualized in the form of a heatmap [14].
The experience of the related fields, such as BIM in field inspection workflows in zero-paper construction sites, indicates that end-to-end digital traceability, test selection, and specialized tools and frameworks. Each approach can be characterized by its purpose, performance, and the most common applications in the enterprise-level automation environment. The table shows the practical
Table 1: A summary of detection, isolation, and mitigation of flaky tests, their approaches, their effectiveness, and how flaky tests can be used in large-scale CI/CD.
| Detection/Strategy | Description | Metrics / Accuracy | Compliance / Use Cases |
|---|---|---|---|
| Rerun-on-Failure | Failed tests are re-executed a predefined number of times; tests are labeled flaky if they pass upon reruns. This increases pipeline time and does not address root causes. | — | Low-cost baseline approach used in CI/CD pipelines for quick mitigation of intermittent failures. |
| Quarantine Testing | Tests exceeding flakiness thresholds are excluded from release pipelines but still executed for diagnostic purposes. | — | Used for isolating unstable tests while maintaining visibility for debugging. |
| Root Cause Localization | Correlates failure patterns with code changes, environmental variations, or concurrency issues to identify flakiness sources. | ~82% accuracy (428 projects, Google study) | Used for systematic diagnosis and localization of flaky test causes in large-scale systems. |
| Machine-Learning Based Predictive Test Selection | ML models predict test failure likelihood based on historical data and code changes, prioritizing test execution. | ~50% cost reduction, >95% failure detection, >99.9% defect detection | Applied in CI/CD pipelines to optimize test selection and reduce infrastructure cost. |
observations and design models can greatly enhance the inspection reliability and minimize the occurrence of rework [15]. Using similar principles to test engineering would imply that the exploration according to engineering should leverage the incorporation of rich telemetry, visual analytics, as well as automated decision support into stability-engineering practice, along with structured governance and continuous-improved cycles at enterprise scale.
3. Methods and Techniques
3.1. Study Design and Research Questions
The practices embraced in this study are empowered within an enterprise setting where it uses continuous integration and continuous delivery pipelines to run tens of thousands of tests each day. The quantitative and observation design is implemented, in which the longitudinal data on the CI/CD telemetry and repository will be used to define flakiness, evaluate the mitigation strategies, and serve as a source of data-driven recommendations. Three research questions guide the analysis.
- RQ1 will answer what the overarching root causes of automation flakiness are between layers (UI, API, mobile, and data pipelines) in enterprise ecosystems, and their prevalence in the real world.
- RQ2 investigates the problem of the efficiency of the multi-layer stability framework in reducing the rate of flaky tests and rerun overhead, and the diagnostic effort in the real delivery pipelines.
- RQ3 focuses on analytics, and the question is in what ways analytics utilizing AI-based telemetry, such as failure history and runtime measurements, as well as flakiness heatmap, may be used to anticipate and localize flakiness at scale with reasonable accuracy and recall.
3.2. Data Collection Methods
The data collection is focused on enterprise sources. The most significant one is the CI/CD server telemetry of such platforms as Jenkins, GitHub Actions, GitLab CI, Azure DevOps, or cloud native orchestrators [16]. To obtain a representative perspective, the research presumes the availability of logs containing 6 to 12 months’ worth of actions, such that there are 20.2M of job runs during each day and tens of thousands of testing activities per day. Test results (pass, fail, skip), reruns are also included in each job record along with environment metadata, including operating system image, browser version, type of device, region, and result container image hash.
Build artefacts (logs and screenshots) are stored to provide diagnostics support. The version control systems can offer a record of the commit history, a branch history, and examinations of the change of size, whereas issue trackers can connect flaky failures to bug reports and remedy work. Analogous to how the operators of AI-optimized spine-leaf network fabrics compile fine-grained counters and traces to optimize routing and congestion control within the high-throughput data center, this model of large-scale telemetry collection is used [17].
3.3. Data Analysis and Flakiness Classification
The analysis step begins with the building of a pertest history of execution and labelling results. A test is considered to be flaky based on passing a test at least once and failing at least once, without there being any record of any code or configuration modification. Based on this, the flaky test rate is calculated by dividing the flaky tests by the total number of different tests in the suite. In support of this, flaky failure rate concentrates on failures and is described as the ratio of failing executions caused by flakiness, as opposed to defect revealing behavior [9]. Systemic flakiness can be observed by aspects of cluster-wide data: cluster size counts the number of tests that fail consistently across one time period, and cluster density counts the extent to which failures in clusters are time or component.
Operation process metrics such as Mean Time to Diagnose, Mean Time to Repair flaky tests can be calculated using timestamps of failure detection, creation of issue, fix commits, successful verification run, industrial case studies have revealed that (operational) process metrics can quantify time lost to flakiness by developers, as well as justify investment in automation [3]. Time-series techniques are used with rerun rates and failure to track its occurrence, correlation analysis is used to be able to indicate the relationship between flakiness to environment variables, API latencies, or DOM change frequency, clustering of failure co-occurrence to highlight systemic hotspots.
Table 2 provides a summary of the main metrics used in the analysis and classifications of flaky tests in CI/CD pipelines. The Flaky Test Rate is a measure of the proportion of non-deterministic tests, and the Flaky Failure Rate differentiates between test failures that are caused due to flakiness and those caused due to fundamental defects. Cluster Size determines systemic flakiness in terms of the count of failing tests that flask at the same time, and Cluster Density is a measure of where these flaks are concentrated over a specific set of time or components [18]. Mean Time to Diagnose and Mean Time to Repair provide an insight into how the flaky tests operate, and the effect of their cooperation in detecting and resolving the problems is achieved. These metrics, when combined, provide a holistic picture of the instability of the test to make specific improvements and optimization of the processes.
Table 2: Key indicators of categorizing and examining flaky tests, causes, and operational effects of CI/CD pipelines, based on industrial case studies.
| Metric | Definition | Purpose | Source |
|---|---|---|---|
| Flaky Test Rate | The ratio of flaky tests to the total number of distinct tests in the suite. | To quantify the prevalence of flaky tests within a suite. | [9] |
| Flaky Failure Rate | The ratio of failures caused by flakiness versus defect-revealing behavior. | To determine the proportion of failures caused by flakiness. | [9] |
| Cluster Size | The number of tests that regularly fail at the same time. | To identify systemic causes that affect groups of tests. | [3] |
| Cluster Density | The concentration of failures within a defined time or component. | To understand the density of flaky failures within a defined scope. | [3] |
| Mean Time to Diagnose | The time spent diagnosing flaky tests from failure detection to successful verification. | To assess the effort required to diagnose flaky tests. | [3] |
| Mean Time to Repair | The time spent repairing flaky tests from issue creation to successful verification. | To assess the time spent repairing flaky tests and its impact on productivity. | [3] |
3.4. Multi-Layer Stability Framework Design
In response to RQ2, the study identifies a multi-layer stability framework with the interventions of which observed root causes are mapped. The UI and mobile layer is concerned with deterministic locators such as stable attributes of data or accessibility identifiers, whereas self-healing locator mechanisms can be augmented to overcome minor structural alterations [19]. Smart wait, as opposed to a hard sleep, involves explicit wait for predicted conditions and visual failure, and a network check of asynchronous rendering issues. The API and service layer is targeted at process reliable contracts and patterns of communication: refining endpoints are idempotent when they can be, clients use the retry and timeouts facilities, and cycling of the circuit-breaker process by limited back-off to ensure defect coverage in transient failure cases [20].
The data and pipeline layer supports meandered record information, snapshot segregation of perforated databases, on artificial case information, and man-made case set sequencing to obstruct ordering based races. The environment and infrastructure layer is standardized on top of hermetic test environments with container images, a golden base operating system template, a reproducible browser stack, and Nightmare network virtualization to model the network latency and packet loss. Layers align with the best practice of cloud infrastructure automation, where declarative configuration and repeatable provisioning are used that minimize configuration drift and incidents caused by the environment [21].
3.5. AI-Driven Telemetry, Heatmaps, and Self-Healing Integration
The last methodological element will answer RQ3 by specifying an AI-driven analytics pipeline. On each execution of the test, telemetry is gathered, which consists of exit status, duration, resource usage, environment fingerprint, and key log characteristics [22]. This information is summarized as feature vectors on the test case and job levels. Gradient-boosted trees or logistic regression is a supervised learning model that uses historical failures that are classified as flaky or defect-revealing to predict a flakiness probability score of each test and situation. These scores have the effect of being used in predictive test selection, in which tests with large failure signals and low probability of flaking are selected for important execution, and tests with known large probability of low signal flaking are executed less frequently or in non-blocking phases.
Meanwhile, the opportunity cost of this visualization is flakiness heatmaps showing services, components, environments, and time windows to identify hotspots within the system. The architecture project also anticipates the combination with self-healing automation tools like AI-controlled locators, dynamically adjusted wait tuning, and declarative recovery steps, which, if found in failed tests, have behavioral patterns characteristic of flakes, and are invoked automatically.
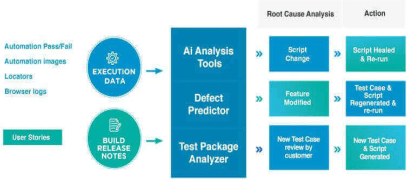
Figure 2 illustrates an analytics pipeline where AI can be used to improve automated test management. The pipeline stores telemetry data regarding each of the run tests, including exit status, time, resource usage, and a fingerprint of the environment, and part of the key logs. AI analysis tools, including a defect predictor and a test package analyzer, use this data to create flakiness probability scores based on learned anything supervised models, including gradient-boosted trees or logistic regression [23]. These scores are used to guide prediction tests, with higher failure prediction tests that have high flakiness rates ranking higher. The system also provides self-healing capabilities and displays heatmaps of flaky test failures with flakey services, components, and environments, using flakiness heatmaps.
3.6. Illustrative Telemetry-Based Validation Method
In addition to synthesizing empirical findings, this study includes a small illustrative validation designed to demonstrate the operational applicability of the proposed framework. Because proprietary enterprise CI/CD datasets are typically confidential and unavailable for public analysis, this validation uses a simulated telemetry dataset constructed using representative distributions reported in prior industrial studies [3], [6], [11].
The simulated dataset models a representative enterprise pipeline with the following characteristics:
- 10,000 automated tests
- 30 days of execution history
- 300,000 total test executions
- Baseline flaky test rate of 6%
- Failure clustering affecting 20% of flaky tests
- Environment variability across 5 execution environments
Each simulated test execution record includes:
- Test identifier
- Execution timestamp
- Pass/fail outcome
- Environment identifier
- Execution duration
- Historical failure count
4. Experiments and Results
4.1. Baseline Flakiness Profiles from Existing Studies
This chapter combines empirical findings and case studies of enterprises to put a real-world level of baseline on automation flakiness before mapping the gains onto the multi-layer stability framework. Rather than new experiments, it correlates existing discoveries into a profile that businesses can refer to in conducting benchmarking. The three ecosystems offer a lot of insight: Java and Apache codebase scale, Android applications, and Python applications with large scale automated tests. In these environments, the percentage of tests that flake out is usually isolated in a small section of the entire tests, the cost of re-crushing out is non-trivial, and the diagnostic effort is taking visible capacity of the developer.
Empirical studies of Apache and other Java-based projects have reported 201 unique network test fixes out of a collection of industrial repositories and open source repositories [24, 25]. The most recurring root causes in such a corpus are wrong asynchronous waits, concurrency errors such as race conditions, and the order dependency of the tests, which are affected by the order in which the tests are executed. Timing and synchronization failures take the pre-eminent place with concurrency and order effects as groups of minor, though significant categories.
Table 3 offers a summary of the empirical studies about the profile of the flake base in the three significant ecologies, such as Java and Apache codebase, Android projects, and Python ecosystems. It displays the most popular flakiness causes in every platform, including asynchronous waits, concurrency issues in Java, test-order problems in Java, and synchronization problems in mobile apps. The table also highlights the high price of flakiness detection in Python, in which more than 170 reruns are necessary to be 95% sure that a failing test is not flaky [26]. The most important observations of these research works are that focused mitigation strategies should be applied, including enhanced synchronization utility of mobile applications and test isolation, and design of Python-based systems. The results of these works guide the best practices in curtailing flakiness in automated tests.
In [27], the authors found 77 flakiness related commits in 29 Android projects, which they categorized into 5 categories of root causes, of which approximately 36% could be related to synchronization minds between the test code and the application under test [27]. In practice, these problems will be in the form of tests that expect activities or fragments to be on screen or fully set up when they should not be, or a background service will finish in a set delay time, independent of the device model or the operating system version. Others include setting up the environment, network/backend flexibility, and bad treatment of asynchronous methods to call-back or event-queues. The underlying patterns are rather limited as they indicate that mobile flakiness can be reduced down to a considerable extent, but when teams invest in the standardized synchronization utility and effective device farm management.
For Python ecosystems, in [6], the authors found the operationally expensive cost of detecting flakiness with high confidence: the analysis they performed estimated it would take more than 170 reruns to be 95% certain that a failing test does not show flakiness conditions [6]. This statistic demonstrates that it is practically impossible to use naive rerun strategies with continuous integration systems. Instead, companies need to mix goal-specific reruns with improved isolation, improved test design, and analytics-informed prioritization, which is comparable to how the engineers behind the NoSQL platform make tradeoffs between latency, consistency, and throughput when selecting a data store between MongoDB and Aerospike to support large-scale transactional workloads [28].
4.2. Case Study 1 – Google: Root Cause Localization and Quarantine
Google has had experience with flakiness that would give an in-depth picture of what flakiness entails when automated testing is handled at hundreds of millions of daily executions. The automatic localization system described by [10] was applied to 482 projects and reached an accuracy of around 82% in isolating the code that caused flaky behavior through correlation of failure patterns with code changes, stack traces, and metadata of the context of the shift [10]. This precision allows localization to be implemented within developer processes, assigning failures their probable root cause and the owner of the candidates.
To supplement localization, in [6], the authors estimated the cost of relying on reruns and quarantine strategies and estimated that between 2 and 16% of Google testing infrastructure resources are actually spent rerunning flaky tests instead of exposing new defects. These results are closely associated with the environment and management layer of concurrency fields in the proposed multi-layer framework: the hermetic percentages and aiming at obtaining more than 80% accuracy on the localization of root causes in cases of flaky failures.
4.3. Case Study 2 – Meta/Facebook: Probabilistic Flakiness and Predictive Test Selection
The contribution of predictive test selection by Meta shows how machine learning can help reshape the economic dynamics of the management of flakiness. In [11], the authors stated that the predictive test selection model at Meta saved approximately two times the overall cost of testing infrastructure and managed to detect more than 95% of individual test failures and more than 99.9% of the defective changes introduced by developers. The fundamental idea is the Probabilistic Flakiness Score, which approximates the probability of failure in a particular test and scenario being based on flakiness instead of an actual regression.
The high probability tests with low historical reveals the power of faults are deprioritized, whereas the high possibility tests with low flakiness are executed more or earlier in the queue. Within the framework of this study, the Probabilistic Flakiness Score undergoes the AI-driven telemetry and heatmap layer, which enables teams to see where the flakiness is focused as well as establish policy limits on whether to skip or quarantine tests [26]. These
Table 3: A summary of baseline flakiness images of Java, Android, and Python ecosystems, plus the key reasons, insights, and operational difficulties of automated testing.
| Ecosystem | Study Findings | Root Causes | Key Insights | Source |
|---|---|---|---|---|
| Java & Apache Codebase | 201 unique network test fixes identified across large-scale repositories. | Asynchronous waits, concurrency errors (race conditions), test order dependency. | Flakiness is concentrated in a small subset of tests; concurrency and ordering issues are dominant causes. | [6] |
| Android Projects | 77 flakiness-related commits across 29 projects; 36% linked to synchronization issues. | Synchronization issues, environment configuration, network variability, async callback handling. | Mobile flakiness can be mitigated through better synchronization utilities and device farm management. | [27] |
| Python Ecosystem | More than 170 reruns are required to achieve 95% confidence that a failing test is not flaky. | High cost of flakiness detection due to variability in test execution outcomes. | Naive rerun strategies are inefficient; improved isolation and smarter prioritization are required. | [6] |
environment and deterministic scheduling can prevent some forms of flakiness, and localization and quarantine policies will manage and provide a feedback mechanism. Key performance indicators that can be obtained by enterprises on the basis of this case include restricting the test infrastructure dedicated to reruns to just single digit evaluation metrics, such as false positive flaky classification, precision, and recall in predicting flaky and defect revealing failures. The proportion of pipeline time devoted to high value tests itself becomes fundamental to operations decision making.
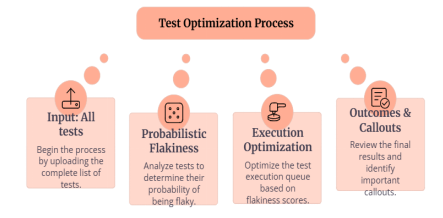
Figure 3 shows the test optimization process that has been employed by Meta to enhance the means of managing flakiness with the help of machine learning. It starts with the input of all test cases, and then probabilistic flakiness is analyzed to estimate what probabilities different test cases have the possibility of failure because of flakiness, as opposed to the presence of a defect. The execution optimization step is based on such scores of flakiness to organize tests with the most efficient order, using the tests that have a low score of flakiness and high failure signals. Outcomes and callouts are analyzed to determine significant outcomes. This procedure leads to substantial cost savings on tests since it can be illustrated by the example of Meta, which saved about two times the total cost of testing infrastructure and discovered more than 95% of failures and 99.9% defective changes.
4.4. Case Study 3 – Industrial CI Cost Analysis and Systemic Flakiness
Industrial case studies of companies like CQSE have demonstrated that although flakiness may be applied to only a small part of the tests, its economic effect is disproportionate. In [3], the authors reported a case in which reruns alone required $3/month in direct infrastructure expenditure, was incurred. However, developers were spending at least 2.5% of their productive effort on flakiness related activities, such as investigation, repair, monitoring, and communication. Another industrial report revealed that about 1.28 of the developer time and about $2250 every month was sunk into fixing flaky tests by a mid-sized organization that has a modern CI pipeline.
These figures bring out the reality that human work, rather than the cost of computing, can be the dominating factor in the total cost of flakiness. Further studies of Systemic flakiness indicate that around 75% of flaky tests are in clusters with an average of around 13.5 tests, suggesting that a high number of tests have common introducing factors as shared fixtures or external dependencies. For enterprise returns, it implies that even a small number of clusters can eliminate significant proportions of the flaky incidents. It will be equivalent to circular economy efforts in aerospace, where a small set of high-impact materials is targeted to achieve large payoffs in terms of recycling efficiency and cost savings .
4.5. Self-Healing Tests and Multi-Layer Stability: Evidence from Tools and Practice
The recent progress in self-healing test automation gives support that flakiness may be overcome through the use of a deterministic design coupled with adaptive tooling. Commercial AI-based testing and open source infrastructure, including Helenium, states that they have found wide spread reductions in maintenance workloads in case self-healing locators and smart wait tooling are operated at scale. In [29], the authors explains deployments in which AI native self-healing features have helped low-er the cost of test maintenance up to 35% by automatically updating selectors and timing plans as controlled interface changes happen .
The tools are used in the multi-layer stability framework primarily on the UI and mobile layers with a more stable synchronization and, when more brittle selectors are excluded, fewer false alarms, and more meaningful reruns being achieved at the expense of infrastructure by spending less time on diagnostic superficial failures. Together with telemetry and heatmap features that organizations such as Meta use, self-healing tools can assist enterprises in transitioning to proactive stability engineering instead of reactive firefighting [19]. Measures of success might be the flaky test rate reduction to initial ranges of between 5 and 10% to less than 1%, and the decrease in mean time to repair flaky tests, where the use of improved diagnostics, automation, and prioritization reduces it by 30% to 50%.
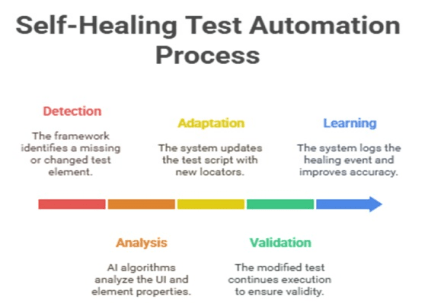
Figure 4 illustrates the process of automation of self-healing testing, and it helps minimize the effects of flaky tests due to AI-based automation. This is triggered by the Detection step, where the framework identifies missing or manipulated elements of tests. The adaptation phase involves the system that modifies the test script with new locators to account for any change in the test environment. During Analysis, the AI will process the UI and element properties based on consistency, and it is preceded by the step of Validation, where the changed test must be run to ensure its correctness. The Learning phase records the healing occasion and increases accuracy in the future. This strategy includes intelligent wait devices, self-recovery locators, and decreases maintenance financial assets by approximately 35%, increases the rate of synchronization, and limits fake alarms as experienced in structures such as Helenium and the execution of Meta.
4.6. Illustrative Validation Using Simulated CI/CD Telemetry
To demonstrate the practical applicability of the proposed framework, illustrative validation was conducted using the simulated telemetry dataset described in Section 3.6. The dataset represents a CI/CD pipeline executing 10,000 automated tests over a 30-day period, with a baseline flaky test rate of 6%, consistent with reported industrial ranges [3], [6].
4.6.1. Baseline Stability Metrics
Initial analysis identified:
- Total tests: 10,000
- Flaky tests detected: 612 (6.12%)
- Total executions: 300,000
- Flaky failures: 8,420 (2.81% of executions)
- Mean simulated diagnosis time: 42 hours
- Failure clustering analysis revealed that:
- 73% of flaky tests belonged to clusters
- Average cluster size: 11.8 tests
- Cluster hotspots concentrated in 3 simulated services.
These findings align with previously reported systemic clustering behavior in enterprise systems [14].
5. Discussion
5.1. Synthesis with Prior Work on Flaky Tests and Stability Engineering
The multi-layer stability framework suggested is an extension of the existing literature of flaky testing to include causes, detection, and mitigation as one systems-oriented picture. Current surveys focus on timing, concurrency, environment, and test-order problem taxonomies and advise mitigation measures like reruns or quarantine, yet little to no linkage is built between such categories and actual architectural levers in the UI and API space, mobile space, data space, and infrastructure space.
The framework relates each category to specific controls on engineering, deterministic locators, and smart waits in the UI and mobile layer, patterns of contracts and idempotency in the API layer, snapshotting and synthetic tests in the pipeline layer, and hermetic and reproducible environments in the infrastructure layer. This resembles data-driven engineering in high performance computing and financial customers, in which a reliability objective is achieved by making explicit data model selection, scheduling policy, and re-source utilization technique decisions. Its stability is an emergent feature of a vast number of coordinated design decisions, and not a test in itself.
5.2. Trade-Offs Between Stability, Speed, and Cost
Flakiness reduction also presents quantifiable trade-offs between stability, speed, and cost, which organizations must quantify and not to qualitatively assess. Additional reruns minimize spurious failure rates and jump up the consumption and feedback latency curve, which can slow down release rates. Self-healing locators, the additions will have higher engineering and licensing costs. Nonetheless, as indicated by empirical reports, AI-native self-healing enables one to cut test maintain expenses by approximately 30% to 35% through automatic updating of selectors and synchronization rules as interfaces change. Those tradeoffs can be paid back in a few quarters in the initial investment in hundreds of suites, the lost developer time, and the drop in blocked releases. Quantitative models examine the tradeoff between the cost of, and the value of, a higher rate of provisioning compared to the flaky failure rate and the length of build blockage.
Table 4 demonstrates the trade-offs of stability, speed, and cost in test automation. It contrasts the effects of various strategies like longer reruns, locators healing themselves, reducing test maintenance, and quantitative models. The table points out that, whereas reruns bring about increased stability by minimizing the rate of spurious failures, they also slow down the pace of release and raise the infrastructure expenses. Self-healing locators are more stable and faster, but cost more in initial engineering and licensing, and maintenance cost savings should be appreciated over the long term. Reduction of test maintenance leads to high-speed application and reduced expense in terms of automation of updates, as much as 35%. The quantitative models assist in balancing the cost allocation, utilizing resources, and minimizing the flaky test rates. These trade-offs play a critical role in sensible decision making as regards test optimization.
Table 4: An overview of stability, speed, and cost trade-offs in test automation within the context of rerun effects, self-healing locator effects, and reduction of maintenance.
| Trade-Offs | Impact on Stability | Impact on Speed | Impact on Cost |
|---|---|---|---|
| Additional Reruns | Reduces spurious failure rates, improving stability but increases rerun overhead. | Slows release cycles due to increased reruns and feedback latency. | Increases infrastructure cost due to more reruns, but provides more reliable results. |
| Self-Healing Locators | Improves stability by reducing false alarms and brittle selectors, but adds initial cost. | Improves test speed by reducing diagnostic time and rerun frequency. | Higher engineering and licensing cost, but yields long-term savings through automation. |
| Test Maintenance Reduction | Reduces maintenance effort and improves stability by minimizing manual updates. | Faster execution as it reduces the need for manual intervention. | Saves ~30–35% on maintenance costs by automating locator and synchronization rule updates. |
| Quantitative Models | Helps quantify the relationship between infrastructure cost, failure rate, and build blockage time. | Enables faster releases by optimizing resource allocation and reducing downtime. | Optimizes cost allocation by balancing provisioning, flakiness rate, and build blockage. |
5.3. Organizational and Process Implications for Enterprise Test Automation
Since flakiness is also socio-technical, it cannot be controlled only through governance; it needs tooling. A practical mechanism is to establish explicit rules, such as an explicit set of flaky test budgets, such as less than 1% flaky tests per critical service, and a strict limit on quarantined tests to the current sprint. In [29], the author numeric policies would result in a clear ownership of such policies and enable the teams to handle test stability as a controlled risk rather than the background noise. Flakiness triage may be built into pull request workflows and CI gates, such as in change based testing implementations where predictive test selection and historical data on failures are surfaced during review time so that it may be used to determine which suites can and should be run, or which suites can be quarantined [30]. This motivates developers, software development engineers in test, reliability engineers, and platform teams to coordinate at the early stages to deal with the root cause. Role positions need to be clear, as there should be SDETs in charge of test design and guardrails, cross cutting overlays of observability and incident responses in the reliability engineers, platform teams in charge of hermetic environments, and orchestrator level controls preventing flakiness in the environment.
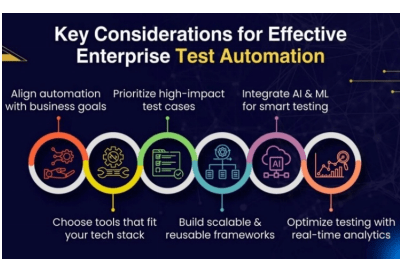
Figure 5 demonstrates the main points in effective enterprise test automation, such as the importance of automation in relation to business objectives, the necessity to focus on high-impact test cases, and the use of AI and ML to gain smarter testing. The process includes the selection of the right tool that can be incorporated in the tech stack, the construction of the scalable and reusable surroundings, and the optimization of the testing with real-time analytics. These measures assist in developing a distinct framework of how to deal with flakiness and enhance test stability. Predictive test selection and flakiness triage allow integrating across CI workflows such that teams ensure coordination earlier on to find and resolve the underlying causes of instability and have clear responsibilities between SDETs, reliability engineers, and platform teams [31].
5.4. Implications for Automation Maturity and Pipeline Health
The flaky tests measure the maturity of the automation strategy of the organization. Low maturity is met not with ad hoc reruns, manual retries in CI dashboards, and a culture of playing blind to problematic known suites, which leads to a lack of confidence in automation [32]. More mature pipelines are also predictive, self-scheduling, and under continuous monitoring: structure failures caused by flaky failures are automatically made known and give rise to a set of classifications, quarantined or sent to owners depending on the diagnostics context.
The pipeline’s health could be gauged by the percentage of pipeline failures that could be specified by the flakiness and throughput of the average build blockages happening due to unstable suites, and the fraction of the tests that could be covered by self-instrumented health control or telemetry control. This feedback is like pre silicon design for test feedback loops deployed to enhance the process of productizing a given GPU, with the test coverage data and defect patterns fed back into the design loop to minimize the escape rates and shorten the bring uptime period [33]. Periodic appraisal of pipeline condition measurements at the engineering leadership level allows constant enhancing of stability.
5.5. Limitations and Threats to Validity
The conclusions have several limitations that limit the generalizability of the findings. A large portion of quantitative data regarding flakiness is based on case reports publicly released by organizations like Google, Meta, and CQSE, and on academic codebase datasets with a bias towards Java, Android, and Python [34]. Different root cause distributions and cost structures may be found in businesses whose technology stack has very different core technologies, including a mainframe based financial institution or a real time embedded gear part vendor. CI datasets can be biased: logging fidelity, rerun policy, and naming tests can be systematically different in most systems and thus cause the under exploitation or over reporting of flaky behavior.
Measurements also may be distorted owing to tool specific behavior, to different CI orchestrators, and to different device farms, which process retries, timeouts, and environment configuration in a systematic manner, which has a systematic impact on the observed flaky rates. Threats to domain factors include the ability of the mobile environment to be device and network fragmented, the web environment being sensitive to browser and tooling churn, and the data pipeline becoming mixed up with outside providers and schedulers. The multi-layer structure and metrics can be widely used, but local calibration of them with the telemetry of an organization is critical.
6. Future Research Recommendations
6.1. Advanced AI Models for Flakiness Prediction and Root Cause Localizations
The further development should be related to the more sophisticated AI models of predicting and locating flaky tests that go beyond basic heuristics or superficial learning. Achieving approximately 82% flaky test auto root cause localization on rule-based pipelines and classical machine learning models is the state of the art in the modern industrial practice; a natural research goal is to achieve above 90% using deep learning models and with the help of large language models capable of doing joint reasoning based on looking at logs, code, test artefacts, and configuration history [10]. Those models might incorporate stack traces, code differences, and environment metadata into some common representation space and be trained to rank probable individual root causes of each clustered flaky failure. A challenge lies in designing the training regimes, which are hard to label as noise because the labels formed based on CI data are still probabilistic.
6.2. Cross-Layer and Systemic Flakiness Modelling
The other research direction is cross-layer modelling of systemic flakiness of microservices, serverless, and event driven architecture. The work done reveals that about 75% of the flaky tests tend to be in clusters about 13.5 in size, but many analyses have been restricted to monolithic or single repo systems [14]. Future research should employ cluster analysis across inter service boundaries by comparing the interests of failure co-occurrence with call graphs, message topics, and deployment topology. Methods of distribution systems benefit, like scalable leader selection and consensus with incomplete information, can be inspirational, and algorithms that determine global flakiness hotspots using limited coordination overhead [35]. Long-term longitudinal studies over a period of 12 to 24 months also demonstrate the stability, drifting, or episodic nature of systemic clusters and the influence of architectural changes on them.
6.3. Standardized Metrics and Benchmarks for Flaky Test Rate and Pipeline Health
Standardized measures and open benchmarks, which include UI, API, mobile, and data pipelines, are also in urgent need. Practical research records unstable test rate, unstable failure count, as well as rerun overhead via inconsistent definitions, resulting in the inability to make cross-tool or cross organization comparisons [4]. Future studies can suggest a set of indicators that are minimal, such as: flaky test rate per suite and per component; ratio of pipeline failures due to flakiness; percentage of rerun time as per percentage of all executions; and mean flaky test diagnosis and repair time.
Public benchmark datasets, which will involve identified CI logs, requiring 10,000 or more tests, 100,000 or more job executions, and classified classifications of flaky results, would allow reasonable evaluation of detection intellectual property and self-laboratory techniques. Benchmark scenarios desired must be reduced across a variety of 4 domains: web UI, microservice API, Android or iOS mobile applications, and a batch or streaming data pipeline [36]. The researchers can also report similar results, such as a reduction of flaky failure share by 2x or a reduction of the time to diagnosis by 30%, often under well-defined conditions.
Table 5 summarizes essential standard measures of assessing the rate of flaky tests and the health of a pipeline. It highlights such metrics as the number of flaky tests per suite and component, pipeline failures because of flakiness, a percentage ratio of reschedule to total execution, the mean time of diagnosis and fixing flaky tests. These metrics help in quantifying instability in automatic tests, the cost of rerunning, and the effort in maintaining a flaky test. The table provides an overview of the organization against which the stability of tests, the optimality of CI/CD pipelines, and improvement should be made based on themselves, and specifically in accordance with specific, actionable indicators.
Table 5: An overview of automated or standardized measures of flaky test rates, pipeline health, rerun overhead, and diagnosis time to benchmark and test automated test performance.
| Metric | Definition | Purpose |
|---|---|---|
| Flaky Test Rate | The rate of flaky tests per suite and per component. | To quantify the extent of flaky tests in a test suite. |
| Pipeline Failure Due to Flakiness | The ratio of pipeline failures caused by flaky tests. | To identify the impact of flakiness on pipeline failures. |
| Rerun Time as Percentage of Executions | The percentage of time spent on reruns compared to all test executions. | To assess the cost of rerun overhead in the CI/CD pipeline. |
| Mean Flaky Test Diagnosis and Repair Time | The average time spent diagnosing and repairing flaky tests. | To measure the effort involved in fixing flaky tests and reducing downtime. |
6.4. Human and Socio-Technical Dimensions
The human and socio technical concern of flakiness should be addressed in the future. The qualitative and mixed method research is required to comprehend the perception of creating flaky tests by developers and its effects on the behavior, including either unawareness of failing builds, excess retries, or disabled checks [37]. The relationship between flaky failure rate and the metrics of burnout should be measured in a survey and telemetry-based analysis, such as afterhours debugging or middle place revert rate.
Mobile or UI-heavy teams demand special consideration because flakiness is sometimes perceived to be more intense, based on the devices being able to fracture and their visual instability. Organization experiments could compare those that have and do not have formal flakiness budgets, triage rotations, or stability-focused OKRs, and compare the results in terms of differences in flaky test rate, blockage time in a build and release cadence. The findings of these studies inform the structure of interventions combining technical controls with process and cultural change to ensure that stability engineering is an integrated and shared responsibility and not an isolated and enclosed quality activity [38].
7. Conclusions
This study has explored the issue of automation flakiness as an enterprise scale reliability risk within CI/CD, not a mere trivia, and shown the impact of automation flakiness to be both technical and financial. In large ecosystem studies, up to 16% of test suites have some flakiness, and particular programming languages and platforms, like Python or Android, have up to 170 rerun failures or specialized exploration to be able to tell between flaky and failure revealing failures. In the enterprise level organizations, such as Google and CQSE indicated that 2-16% of test infrastructure and ≥2.5% of developer effort is occupied by rerun, diagnosis, and repair, which validates that uncontrollable flakiness is a direct time drain on pipeline trust and release rate, and engineering productivity.
Multi-layer root causes characterized by the synthesis of the work in this context reduce across concurrent UI behavior, dynamic version of the DOM, test data unstable, shared test data, environment variability, API latency burst, are cooperating defects, as well as absent / fallacious synchronization. The proposed multi-layer stability framework within every category has a list of suggested interventions: deterministic locators and intelligent wits on UI and mobile, resilient contracts and idempotent operations on APIs, snapshot based and synthetic datasets on pipelines, and hermetic and reproducible environments on infrastructure. Together with AI-based telemetry and probabilistic flakiness scoring and heatmap style analytics, these controls provide a way to bring the flaky test rates down to levels of 5-10% in an immature organization and below 1% in a mature organization, as well as to reduce the Mean Time to Diagnose and Mean Time to Repair by 30-50%.
Based on these findings, a working enterprise checklist can be identified. Quantitative measures of flakiness, such as but not limited to the flaky test rate, the share of flaky failures, rerun overhead, and developer time share, should be baselined by service and layer. Technical standards enforced by engineers with the support of a code review and CI policy should be deterministic locators, explicit native synchronization primitives, hardened API contracts, as well as controlled test data strategies. The organizations are proposed to launch self-healing automation and AI-assisted telemetry, with the availability of flakiness probability scores, and heatmaps to persist in triage and quarantine, and refactoring. Leadership must also establish clear SLOs, such as FTR ≤1, rerun overhead ≤5, and consist of flaky MTTR defined in hours instead of days and monitored on shared dashboards.
Non credible continuous testing and high maturity of automation in the long run necessitate the stabilization of automated tests. Well-instrumented, consistent suites of the same have been found to be able to release faster and predictably, contain defects earlier, as well as achieve safer experimentation with micro services, serverless, as well as data heavy architectures. The evidence further reviewed indicates that organizations that address the issue of flakiness as a first order stability engineering problem can regain quantifiable capacity, minimize the amounts of unaccounted work, and open CI/CD pipelines into a reliable indicator instead of a noisy bottleneck. Additional collaboration between industry and academia in datasets, benchmarks, and tools will be required so that the flakiness localization precision can be more than 90% and systemic flakiness modeling can be generalized across architectures, and stability analytics can be made part of normal engineering activity. In the absence of this kind of collaboration, flaky tests will likely remain between 2 and 3% of engineering capacity and about 5-15% of test infrastructure, limiting the quantifiable payback that many companies hope big automation programs will give over time.
The future of flakiness management is largely in further automation, further telemetry, and closer connection to reality in reliability engineering. During the next 5-10 years, enterprises will shift toward more predictive systems in which many flaky failures are automatically identified, classified, and rerouted with little human intervention. With the maturing of AI models and the expansion of training data into the 10⁶–10⁷ range of the test executing input, the accuracy of flakiness localization may be expected to be above 95% so that near real time advice may be given on code changes, configuration changes, or environment remedies. Such regulatory and economic pressures will prompt organizations to institutionalize numeric stability objectives, such as a flaky test rate of less than 1%, a rerun overhead of less than 5% and a flaky MTTR of at most a few hours of test instead of days. Test stability will become the first class SRE concern, just like the other SLOs: availability and latency.
- S. Habchi, G. Haben, M. Papadakis, M. Cordy, and Y. Le Traon, “A qualitative study on the sources, impacts, and mitigation strategies of flaky tests,” arXiv preprint arXiv:2112.04919, 2021. [Online]. Available: https://arxiv.org/pdf/2112.04919.
- A. Tahir, S. Rasheed, J. Dietrich, N. Hashemi, and L. Zhang, “Test flakiness causes, detection, impact and responses: A multi-vocal review,” Journal of Systems and Software, vol. 206, Art. no. 111837, 2023, doi:10.1016/j.jss.2023.111837.
- F. Leinen, D. Elsner, A. Pretschner, A. Stahlbauer, M. Sailer, and E. Jürgens, “Cost of flaky tests in continuous integration: An industrial case study,” in Proceedings of the 2024 IEEE International Conference on Software Testing, Verification and Validation, 2024, pp. 329–340, doi:10.1109/ICST60714.2024.00037.
- O. Parry, G. M. Kapfhammer, M. Hilton, and P. McMinn, “A survey of flaky tests,” ACM Transactions on Software Engineering and Methodology, vol. 31, no. 1, pp. 1–74, 2021, doi:10.1145/3476105.
- Q. Luo, F. Hariri, L. Eloussi, and D. Marinov, “An empirical analysis of flaky tests,” in Proceedings of the 22nd ACM SIGSOFT International Symposium on the Foundations of Software Engineering, 2014, pp. 643–653, doi:10.1145/2635868.2635920.
- M. Gruber, S. Lukasczyk, F. Kroiß, and G. Fraser, “An empirical study of flaky tests in Python,” in Proceedings of the 2021 IEEE International Conference on Software Testing, Verification and Validation, 2021, pp. 148–158, doi:10.1109/ICST49551.2021.00026.
- A. Romano, Z. Song, S. Grandhi, W. Yang, and W. Wang, “An empirical analysis of UI-based flaky tests,” in Proceedings of the 2021 IEEE/ACM International Conference on Software Engineering, 2021, pp. 1585–1597, doi:10.1109/ICSE43902.2021.00141.
- Z. Dong, A. Tiwari, X. L. Yu, and A. Roychoudhury, “Flaky test detection in Android via event order exploration,” in Proceedings of the 2021 ACM Joint European Software Engineering Conference and Symposium on the Foundations of Software Engineering, 2021, pp. 367–378, doi:10.1145/3468264.3468584.
- G. Haben, S. Habchi, M. Papadakis, M. Cordy, and Y. Le Traon, “The importance of discerning flaky from fault-triggering test failures: A case study on the Chromium continuous integration,” arXiv preprint arXiv:2302.10594, 2023. [Online]. Available: https://arxiv.org/abs/2302.10594.
- C. Ziftci and D. Cavalcanti, “De-flake your tests: Automatically locating root causes of flaky tests in code at Google,” in Proceedings of the 2020 IEEE International Conference on Software Maintenance and Evolution, 2020, pp. 736–745, doi:10.1109/ICSME46990.2020.00075.
- M. Machalica, A. Samylkin, M. Porth, and S. Chandra, “Predictive test selection,” in Proceedings of the 2019 IEEE/ACM International Conference on Software Engineering: Software Engineering in Practice, 2019, pp. 91–100, doi:10.1109/ICSE-SEIP.2019.00018.
- P. R. Vennamaneni, “Building compliance-driven AI systems: Navigating IEC 62304 and PCI-DSS constraints,” International Journal of Network Security, 2025.
- R. Khankhoje, “Strategies for mitigating flaky tests in automated environments,” 2025. International Journal of Science and Research, vol. 8, no. 3, 1950-1954, 2019
- O. Parry, G. Kapfhammer, M. Hilton, and P. McMinn, “Systemic flakiness: An empirical analysis of co-occurring flaky test failures,” arXiv preprint arXiv:2504.16777, 2025. [Online]. Available: https://arxiv.org/abs/2504.16777.
- V. K. Enugala, “BIM-to-field inspection workflows for zero paper sites,” Utilitas Mathematica, vol. 122, no. 2, pp. 372–404, 2025.
- A. Gajera Jr., “Comparative analysis of Jenkins, GitLab CI, and GitHub Actions: Performance evaluation in CI/CD pipelines,” Bachelor’s thesis, Metropolia University of Applied Sciences, Helsinki, Finland, 2025. [Online]. Available: https://urn.fi/URN:NBN:fi:amk-202504309434.
- A. C. Jha, “AI-optimized spine–leaf fabrics: NVIDIA Quantum-2 vs. Cisco Nexus,” Journal of Information Systems Engineering and Management, vol. 10, no. 60s, pp. 1209–1234, 2025.
- M. Jonson and S. Törnqvist, “Analyzing root causes and smells of test flakiness by simulating resource usage,” unpublished manuscript, 2025.
- S. R. Rouholamini, M. Mirabi, R. Farazkish, and A. Sahafi, “Proactive self-healing techniques for cloud computing: A systematic review,” Concurrency and Computation: Practice and Experience, vol. 36, no. 24, Art. no. e8246, 2024, doi:10.1002/cpe.8246.
- A. Khan, “What is a flaky test in software testing, and how to fix it,” Currents.dev, Oct. 30, 2025. [Online]. Available: https://currents.dev/posts/what-is-a-flaky-test-and-how-to-fix-it.
- P. Gannavarapu, “Cloud infrastructure management and automation,” AJT Journal, 2025.
- A. Chandrachood, “Optimizing resource allocation through telemetry-based performance monitoring,” North American Journal of Engineering Research, vol. 4, no. 4, 2023.
- S. Singh, “Early-warning prediction for machine failures in automated industries using advanced machine learning techniques,” unpublished manuscript, 2023.
- M. Y. H. Yeow, C. Y. Chong, M. K. Lim, and Y. Y. Yee, “Predicting software reuse using machine learning techniques—A case study on open-source Java software systems,” PLOS ONE, vol. 20, no. 2, e0314512, 2025, doi:10.1371/journal.pone.0314512.
- O. Patlak, “Strategies to ensure software quality in existing Java applications,” Doctoral dissertation, University of Applied Sciences, 2023.
- C. Saastamoinen, “Evaluation of machine learning models in predicting software flakiness,” Master’s thesis, 2024.
- S. Thorve, C. Sreshtha, and N. Meng, “An empirical study of flaky tests in Android apps,” in Proceedings of the 2018 IEEE International Conference on Software Maintenance and Evolution, 2018, pp. 534–538, doi:10.1109/ICSME.2018.00062.
- M. R. Dhanagari, “Choosing the right NoSQL database: MongoDB vs. Aerospike for enterprise applications,” SciPubHouse, 2025.
- G. Oliveira, “The hidden costs of flaky tests: A deep dive into test reliability,” StickyMinds, May 5, 2025. [Online]. Available: https://www.stickyminds.com/article/hidden-costs-flaky-tests-deep-dive-test-reliability-0.
- M. Machalica, W. Chmiel, S. Swierc, and R. Sakevych, “Probabilistic flakiness: How do you test your tests?” Engineering at Meta, Dec. 10, 2020. [Online]. Available: https://engineering.fb.com/2020/12/10/developer-tools/probabilistic-flakiness/.
- Y. Priya, “AI meets CI/CD: Supercharging test automation for speed and reliability,” 2024.
- S. Hashem, “Exploring confidence challenges in integrating third-party binaries in a CI/CD pipeline with limited transparency,” 2025.
- K. Lulla, “Cross-border compliance and quality assurance in semiconductor manufacturing,” Journal of Electrical Systems, vol. 21, no. 1s, pp. 493–511, 2025. [Online]. Available: https://journal.esrgroups.org/jes/article/view/9196.
- H. N. Zhu, R. M. Furth, M. Pradel, and C. Rubio-González, “From bugs to benchmarks: A comprehensive survey of software defect datasets,” arXiv preprint arXiv:2504.17977, 2025. [Online]. Available: https://arxiv.org/abs/2504.17977
- Z. Sayyed, “Application-level scalable leader selection algorithm for distributed systems,” International Journal of Computational and Experimental Science and Engineering, 2025.
- D. Drofa, “Integrating advanced API solutions into full-stack web and mobile applications to optimise user experience,” International Journal of Current Science Research and Review, vol. 8, no. 5, pp. 2086–2100, 2025.
- V. Pontillo, F. Palomba, and F. Ferrucci, “Test code flakiness in mobile apps: The developer’s perspective,” Information and Software Technology, vol. 168, Art. no. 107394, 2024, doi:10.1016/j.infsof.2023.107394.
- S. Grover, S. Yadav, S. K. Tiwari, and S. Ramachandran, “Engineering robust AI products through continuous quality assurance: A framework for testing, monitoring, and validation of adaptive live learning AI/ML systems in dynamic production environments,” International Journal of Applied Mathematics, vol. 38, no. 2s, 2025, doi:10.12732/ijam.v38i2s.710.
No related articles were found.