Impact of Brainwave Entrainment using VR to Improve Attentional Learning in Children with ADHD, ASD and Comorbidity

(This article belongs to the Special Issue on SP8 (Special Issue on Digital and Engineering Transformations in Science and Technology (SI-DETST-26)) and the Section Neurosciences (NES))
Export Citations
Cite
Mandapati, M. and Ranjan, P. (2026). Impact of Brainwave Entrainment using VR to Improve Attentional Learning in Children with ADHD, ASD and Comorbidity. Journal of Engineering Research and Sciences, 5(2), 24–35. https://doi.org/10.55708/js0502003
Manasa Mandapati and Prabhat Ranjan. "Impact of Brainwave Entrainment using VR to Improve Attentional Learning in Children with ADHD, ASD and Comorbidity." Journal of Engineering Research and Sciences 5, no. 2 (February 2026): 24–35. https://doi.org/10.55708/js0502003
M. Mandapati and P. Ranjan, "Impact of Brainwave Entrainment using VR to Improve Attentional Learning in Children with ADHD, ASD and Comorbidity," Journal of Engineering Research and Sciences, vol. 5, no. 2, pp. 24–35, Feb. 2026, doi: 10.55708/js0502003.
Various neurological disorders (NDs) across the globe are prevalent among children, affecting their quality of life. Among them are Attention Deficit Hyperactivity Disorder (ADHD), Autism Spectrum Disorder (ASD), and comorbid conditions, which are defined by the proximity of symptoms of inattention, hyperactivity, and impulsivity that are accompanied by impairment in several functional domains. The overall aim of this research is to improve attentional learning in children with NDs using brainwave entrainment techniques with cutting-edge technology like virtual reality and artificial intelligence. For photic stimulation, pulses of light (virtual reality device) were used. For audio stimulation, binaural beats (noise-cancellation headphones) were used. We identified 40 children in the age group of 6 to 12 years, diagnosed by clinicians as ADHD or ASD, or comorbid conditions. Among 40, Audio Visual Entrainment (AVE) at 10 Hz frequency was administered to 23 subjects for 20 days, with 15 minutes daily. Electroencephalogram (EEG) signals were recorded before and after stimulation using the Emotiv Epoc X device. Initially, the data was pre-processed using the Welch method and independent component analysis (programming done in Python and MATLAB). The power spectral density and the relative band power ratios were calculated. The data was analyzed using quantitative analysis, which included comparative and statistical analysis. This analysis revealed a reduction in distraction and an improvement in cognition and attention among subjects with ADHD and comorbid conditions. No improvement was observed in ASD subjects. A positive result is observed in 72% of the ADHD subjects and 66% of the comorbidity subjects, with only 16% of ASD subjects.
1. Introduction
Lack of attention due to neural disorders (NDs) impacts children’s learning ability, communication, and behavior. Attention Deficit hyperactivity disorder (ADHD), Autism Spectrum Disorder (ASD), and comorbid conditions are the most common NDs among children [1]. According to the Diagnostic and Statistical Manual of Mental Disorders (DSM-5) (2013) [2], the children with ADHD
- Suffer from lack of attention,
- Regularly does not follow the instructions,
- Gets distracted very easily by extraneous stimuli in the envithe environmentd
- Usually forgets the daily
They avoid tasks that need to sustain mental efforts and have difficulty completing problem solving tasks that require attention. A study by PilaNemutSandani [3] concluded that participants with ADHD had poor organizational and planning skills. The difficulties with executive functioning and complex reasoning is one of the reasons to believe that people with ADHD lack problem-solving skills [4].
A substantial minority of children with ADHD demon-strate ASD symptoms [5, 6]. ADHD is the most common comorbidity in children with ASD at a range of 40-70% [7, 8, 9, 10]. Consistent with the data, some researchers assert that although ADHD symptoms occur without ASD symptoms, ASD symptoms do not occur without ADHD symptoms. Most children with ASD had high levels of inattention and hyperactivity, thus introducing bias into ADHD diagnosis. The co-occurrence of the symptoms [6] made comorbidity research important in this field.
ASD is a behavioral syndrome with impairments in several areas of development including social interaction, communication, and stereotypical interests and activities (American Psychiatric Association, 2013 [2]). Autism can affect either the intelligence quotient (IQ) continuum, or the level of language function by age six [11]. These are strong predictors of clinical outcomes. Autism is invariably accompanied by language delay. People with Asperger syndrome (AS) and autism have common symptoms like social impairments and restricted behaviors. However, their verbal and nonverbal IQ will be average or above, without serious language impairment [12]. The most common treatment for ADHD is through psychostimulants such as Ritalin and Adderall which have short-term positive effects and/or severe long-term side effects [13, 14]. An alternative to ADHD medication is brainwave entrainment, a method that naturally synchronizes the brainwaves to external periodic stimuli.
The brain can change under the influence of experience, as well as restore lost connections after damage or as a response to external influences [15] as per the phenomenon of neuroplasticity. This phenomenon can be used to develop memory, learning, attention and restore damaged cells [15]. Studies illustrate that the central nervous system was developed in a predictable sequence [15]. First is the development of senses, second is the movement/motor, and third is the mental/cognitive ability. To better understand the nature of sound/light of the first language, it would be simple to consider first language expression as music and light. Appreciating the potential of deeply rooted sensory communications that do not rely on higher cognition characteristics of mental processing, the signal approaches can be considered positive [16]. This signaling can be presented in light and sound compositional designs that permit the brain to shift in and out of degrees of stable/unstable behaviors. Studies also illustrate that light and sound brain engagement can guide the brain into beautiful positive neuroplasticity experiences [17].
There are different methods to acquire brainwave entrainment. In this research audio visual entrainment using the pulses of light and the binaural beats were chosen. Visual entrainment was done using periodic sinusoidal light pulses in a Virtual Reality (VR) environment [18, 19, 20, 21]. Photic stimulation of 10 Hz was well known to entrain the EEG signals in human beings [22] as it helps to relax the brain and improve the rewiring of cognitive styles and communicative patterns. Alpha rhythm exerts beneficial effects on cognition and behavior [23, 24, 25, 26, 27, 28, 29]. Therefore, the alpha frequency was used in the present study. Furthermore, findings from studies state that differences in working memory load have been linked to modulations in theta peaks, along with the theoretical and empirical support of the role of theta-gamma phase coupling in STM/WM capacity [30]. This suggests that the individual differences in theta frequencies (and gamma frequencies) could potentially be linked to individual differences in WM or STM capacity [31]. Binaural beats were provided using a lower frequency tone in one ear and a higher frequency tone in another ear using headphones, the superposition of these two waves of different frequencies produces a beat wave to which the brain gets synchronized [32, 33].
A single cell recording studies and neurological studies state that social intelligence was a function of three regions: the amygdala, orbitofrontal, and medial frontal cortices in which abnormalities in autism have been found. Studies in neuroimaging have implicated the Prefrontal cortex in attentional functions, in ADHD [14]. Understanding the cognitive behavior of the brain can be done using the signals or images from the brain [34]. Thus, EEG signals were captured using a consumer-grade portable 14-channel EEG device, Emotiv Epoc X, in this research to study the changes that occurred before and after the brainwave entrainment. The overall aim of this research is to improve attentional learning in children with NDs using brainwave entrainment.
2. Related Work
The change in the neural structure and function in response to experience or environmental stimuli is called neuroplasticity. Considerable changes in the brain’s anatomical structure and connectivity occur during childhood [35, 36, 37]. Studies indicate that functional parcellation of cerebral cortical areas into discrete processing centers involves a wide range of signals with tangled interaction, between mechanisms both intrinsic to cortical progenitors and neurons and environmental stimuli extrinsic to the cortex which require neural activity such as light stimulation to the developing eye [38].
ADHD is one of the most heritable neuropsychiatric disorders [39, 40]. EEG recordings reveal that ADHD children produce more theta (4-7 Hz) wave activity in the brains frontal and central cortical regions [41]. ADHD children also produce less beta (13-21 Hz) wave activity [42]. Changing the cerebral electrical activity associated with ADHD has improved ADHD children’s symptoms [42, 43, 44]. As an alternative treatment approach to ADHD, neurofeedback has been used to increase cerebral activity [42, 45, 46, 47, 48].
Before the DSM-5 [49] in 2013, clinicians were unable to make an ADHD diagnosis in the context of ASD. It was presumed that any symptoms of inattention and/or hyperactivity-impulsivity were secondary to ASD and not due to an additional ADHD diagnosis [50]. ASD and ADHD often co occur [51]. Hyperactive, impulsive symptoms correlate strongly with restricted and repetitive behaviors in ASD [52] and family members of individuals with ASD have elevated rates of ADHD diagnoses [53, 54, 55] and vice versa [56].
Many researchers are testing the therapeutic effectiveness of Audio-Visual Entrainment (AVE) as a treatment for a variety of low-arousal brain disorders like ADHD. AVE is the repetitive and intermittent presen-tation of light and sound. AVE affects the EEG output [23, 57, 58, 59, 60, 61, 62, 63]. It has been suggested that many clinicians are using AVE informally for ADHD with anecdotal reports of successful treatment but with few published results [64, 65]. Researchers [66] conducted a pilot study using AVE to treat learning and behavioral disorders. Russell states that AVE achieves the same results as EEG biofeedback but at less cost and in less time [44]. Due to tremendous changes in technology, hardware, and software, there is a need to expand the research. A study on augmented cognition via brainwave entrainment in virtual reality by Argento E, Papagiannakis G, and his team proved a concept that the theoretical idea of fast learning in VR under certain conditions is indeed feasible and has important practical potential [67]. Nowadays, all kinds of technologies in the VR field are developing rapidly. Recently VR has been used for brainwave entrainment in many researches but they were used only in place of tasks to be done during entrainment and EEG data was not considered [68, 69, 70, 71].
Brief, intense flashes produce harmonic activity in the brain [21]; whereas, sine wave stimulation produces a sine-like response (insignificant harmonic activity). Researchers [18, 19, 20, 21] agree that sine-wave modulated light eliminates the problem of light intensity from a Xenon strobe increasing with frequency and the harmonics generated within the neo-cortex at frequency multiples much higher than the fundamental at times. The raw EEGs shown in the studies, show neither signs of epileptiform activity nor any discussion about it. To address the concerns of eliciting a photic-induced seizure, the VR device video used had a slowed turn on and off time of about 15 msec. The light emitted from the VR device was white.
The purpose of this research was to expand the research on learning disorders and to further determine the effectiveness of AVE in reducing the symptoms associated with learning disorders by introducing new technologies and software for entrainment and data collection. The research also contributes in finding tremendous potential and usability of VR in brainwave entrainment.
3. Materials and methods
3.1. Ethical clearance
The methodology used in this research was approved and performed following the guidelines and regulations
approved by the institutional ethics committee. The parents/legal guardians of all the participants signed the consent forms. The study took place from November 2022 to November 2023 in a separate room in a children’s school environment under the observation of the researcher. Consumables like sanitizers, masks, and tissues were used as per COVID protocols. The study was accomplished using protocols established by the foremost clinicians and researchers in the field.
3.2. Data Collection
We approached approximately 200 subjects, among which 110 parents declined or were not interested to participate in the research. 90 subjects parents/legal guardians accepted to participate but only 33 finally met the inclusion and exclusion criteria and gave the consent to participate in the research. However eventually, only 23 subjects completed all the sessions including pretest survey.
Inclusion criteria
- Subjects in the age group of 6-12 years
- Clinically diagnosed: ADHD, ASD, COMORBID
- Gender eligible for study: All
- Socioeconomic background: All
- Parents/Legal guardians and subjects willing and able to give consent for taking part in the research study
Exclusion criteria
Since visual brainwave entrainment can stimulate large areas of the brain, certain people listed below should not use this technology. Those who have
- History of seizures, (especially epileptics)
- History of brain injury
- Hearing-related disease
- Any known ocular disease in one or two eyes
EEG signals were recorded before and after sessions from the 23 subjects, and demographic information of the subjects is summarized in Table 1 and Table 2. In the pretest survey, data on the diagnosis of a disorder by clinicians (pediatricians/neurologists/psychiatrists), age, sex, left or right-handed, and verification of medical diagnosis report were obtained. Based on the pretest survey, the data was subdivided into three groups. This experiment does not require a traditional control group. In the study, we compared individual A’s pre-session data with the post-session data of individual A i.e. when AVE does not influence the participant and when AVE influences the participant. Thus pre-sessions data is equivalent to control group.
Table 1: Demographic data of the subjects who participated in the research
| S.No. | Characteristic | Value |
|---|---|---|
| 1 | Total Subjects | 23 |
| 2 | Male | 19 (82.6%) |
| 3 | Female | 4 (17.4%) |
| 4 | Average Age | 8 years |
| 5 | Left-Handed (LH) | 2 (8.7%) |
| 6 | Right-Handed (RH) | 21 (91.3%) |
Table 2: Classifications of the subjects based on the clinical history
| S.No. | Diagnosis | No. of Subjects |
|---|---|---|
| 1 | ADHD | 11 |
| 2 | ASD | 6 |
| 3 | Comorbid | 6 |
3.3. Device Information
The following devices were used in this research Hardware
- Emotiv Epoc X -14 channel wireless EEG headset to record the brain activity.
- Noise cancellation headphones for audio entrainment.
- Oculus Quest 2 VR headset for photic entrainment.
Software
- Emotiv Pro Suite v3.2.1 can be downloaded from https://www.emotiv.com/products/emotivpro to obtain the raw EEG data.
- Matlab 2022b from Math Works Incorporation at https://in.mathworks.com , and Python v3.33 for data analysis.
- Audacity v3.2.1 which can be downloaded from https://www.audacityteam.org for generating binaural beats.
- Adobe Premiere Pro 2020 from https://www.adobe.com/in/products/premiere.html for generating pulses of light in VR.
The software used is installed on a personal computer with the following specifications: Intel(R) Core(TM) i3-8130U CPU @ 2.20GHz 2.20 GHz, and 8 GB in RAM. The Emotiv Epoc x is paired to the system via Bluetooth and the EEG data was monitored and recorded in Emotive Pro Suite.
3.4. EEG data recording
EEG readings were recorded in the subject’s school environment using 14 Ag/AgCl electrodes (AF3, F7, F3, FC5, T7, P7, O1, O2, P8, T8, FC6, F4, F8, and AF4) and 2 references CMS/DRL references at P3/P4. These electrode were positioned according to the 10-20 international system with the bipolar method. This system is a standard system of positioning the electrodes for reliable data comparison across all the laboratories in the world.
Entrainment is given with eyes open in a VR environment at resting condition under 10 Hz photic stimulation (white light) with brightness intensity of 200 cd/m2 along with audio stimulation using binaural beats at 10 Hz for 20 days with 15 minutes per day. The pulses of light are imposed on a video made of pictures of birds and animals.
A total of 20 min EEG signals pre and post-stimulation sessions were obtained. These EEG signals were sampled at the rate of 128sps and 14-bit resolution. In addition, the signals were recorded in ASCII format.
3.5. Methodology
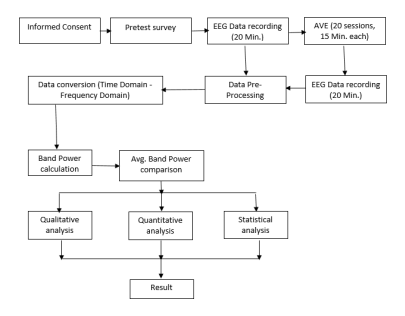
The block diagram of the proposed methodology is depicted in Fig. 1. Initial screening of participants took place to identify the relevant subjects and pretest was conducted. Once subjects were identified and consent was signed, initial EEG data was recorded. From the next day, entrainment sessions took place for 20 days. On the 21st day, the final EEG data was recorded. After data collection data analysis was done and the results were discussed in the results section.
3.5.1. AVE Sessions
Initially, EEG signals were recorded from the subjects before entrainment sessions. Then a combination of audio and photic stimulation at 10Hz (white light with intensity 200 cd/m2) with eyes open was given for 20 days (15 minutes per day). Later, EEG signals were recorded post sessions with a sampling rate of 128sps at 14-bit resolution.
3.5.2. Data Processing
The Emotive software gives the recordings in a .csv file and edf file. Steps during data pre-processing were reading the signal stream as well as event timing information along with electrode positions, followed by filtering (0.2–12 Hz band-pass filter with Hamming window and a transition bandwidth of 4 Hz), relevant electrode selection (FC5 and FC6), discretization into epochs (from 0 until +900 msec after stimulus onset), application of Independent Component Analysis (ICA) and hybrid artifacts rejection methods (improbable data epochs of amplitudes over 25 micro V, abnormal data trends, abnormal frequency spectrum amplitudes of over ±25 dB, values higher/lower than 8 standard deviations of the data amplitude distribution, as well as visual signal inspection) followed by the calculation of grand averages across all of the epochs.
ICA has been proven to be more effective and flexible in separating EEG signals from artifacts. ICA is a linear model that decomposes the acquired sensor data into components that can subsequently be interpreted regarding the underlying physiological processes (e.g. brain, eyes, muscle, other). The effectiveness of ICA is given in a study conducted by [72]. In contrast to traditional artifact removal algorithms, various authors tested the independent component analysis (ICA) method on simulated and experimental data and showed good performance in the separation of signals from their linear mixtures and the extraction of eye information present in EEG signals [73, 74, 75]. To avoid errors introduced by manually selected components, automatic extraction and removal of eye movement artifacts were introduced after ICA analysis [76].
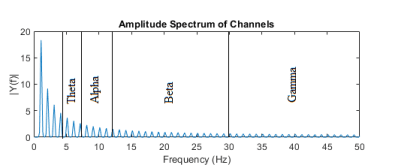
Band Power Separation: In EEG signal processing, separating the power spectrum density into the following bands is common. Delta (1–4 Hz), Theta (4–8 Hz), Alpha (8–12 Hz), Beta (12–25 Hz), and Gamma (25–40 Hz) using Welch method in which FFT was used with the moving Hanning window. The data is divided into K overlapping segments of length L. The Hanning window was enforced for each section. FFT was calculated in each window and PSD was computed as an average of FFTs over all windows [77]. One downside to the compactness of the headset concerning our paradigm was the lack of a Cz electrode, which would have been especially suitable for recording errors due to its proximity to the ACC, so our study focused on its two nearest available electrodes, FC5 and FC6.
The band power ratios were calculated using Eq. (1) to (9).
$$
\textit{RelativeThetaPowerRT}_{i1}
=
\theta_i T_{x\mathrm{return}}
\tag{1}
$$
$$
\textit{RelativeThetaPowerRT}
=
{}^{n}\theta_{i1}T
\tag{2}
$$
$$
\textit{RelativeAlphaPowerRA}
=
{}^{n}\alpha_{i1}T
\tag{3}
$$
\[
\mathrm{RelativeBetaPowerRB}
=
\sum_{i=1}^{n} \theta_i T
\tag{4}
\]
\[
\mathrm{ThetaToBetaRatioTBR}
=
\frac{\sum_{i=1}^{n}\Theta_i}
{\sum_{i=1}^{n}\theta_i}
\tag{5}
\]
\[
\mathrm{ThetaToAlphaRatioTAR}
=
\frac{\sum_{i=1}^{n}\Theta_i}
{\sum_{i=1}^{n}\alpha_i}
\tag{6}
\]
\[
\mathrm{ThetaAlphaBetaRatioTABR}
=
\frac{\sum_{i=1}^{n}\Theta_i \alpha_i}
{\sum_{i=1}^{n}\beta_i}
\tag{7}
\]
\[
\mathrm{BetaToAlphaThetaBAT}
=
\frac{\sum_{i=1}^{n}\beta_i \Theta_i}
{\sum_{i=1}^{n}\alpha_i}
\tag{8}
\]
\[
\mathrm{TotalPowerT}
=
\sum_{i=1}^{n} \Theta_i \alpha_i \beta_i
\tag{9}
\]
where n is the channel number,
$\beta$ l = Beta low
$\beta$ h = Beta high.
After calculating all the band powers and band power ratios, the values obtained before and after AVE sessions were compared and the data analysis was done. Data normalization was done using MinMax scalar and fit transform was used to fit the data and then transform the data. The
amplitude spectrum of data was plotted in Fig. 2 and PSD was plotted in Fig. 3.
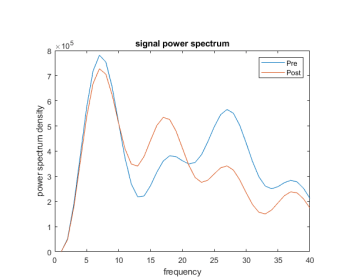
The PSD in Fig. 3 indicates that the Theta frequency (4-8 Hz) was suppressed and Beta low frequency (12-18Hz) was invoked. Increased beta levels to theta and alpha indicate improvement in attention levels.
4. Data Analysis
Initially based on the clinical data, the subjects were subdivided into three categories ADHD, ASD, and Comorbid. To understand the brain activity of the subject, the EEG data from front central electrodes FC5 and FC6 was computed before and after the AVE sessions and the topographical plot was plotted in Fig. 4 to Fig. 6. The analysis of the brainwave pattern is done using Python v3.11 and Matlab 2023b, The Math Works Incorporation.
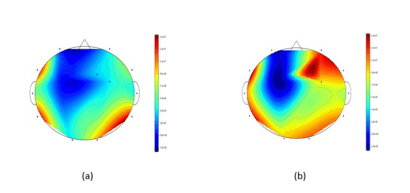
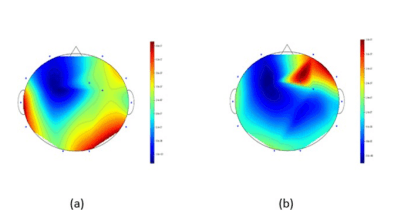
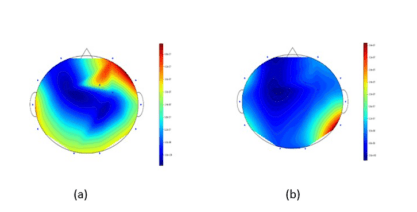
The above topographical plot in Fig. 4 shows that the intensity at the frontal region that is responsible for spatial learning is active post AVE sessions. Similar kind of result can be seen in ASD plot in Fig. 5 as well but in Comorbid condition in Fig. 6 the intensity level was reduced post AVE sessions representing the calmness in the brain region.
This indicates that the attention and spatial learning in case of subjects with comorbid conditions did not improve as for those subjects with ADHD.
4.1. Quantitative (Comparative) Analysis of Data
Relative band power at Theta, Alpha, and Beta frequency bands was computed using the formulae given in Eq. (2) to Eq. (9) and the comparative analysis is done between pre and post session data. The band power ratios were considered as features that describe the change in the brain pattern before and after the AVE sessions. The calculated values of Relative Theta (RT), Relative Alpha (RA), Theta to Beta (TBR), Theta to Alpha Beta (TABR) values was expected to reduce after brainwave entrainment sessions and at the same time Relative Beta (RB) and Beta to Theta Alpha ratio (BTAR) values were expected to increase after the entrainment sessions for ADHD, ASD and Comorbid conditions. The values that indicate the change between pre and post session data are given below in Table 3, Table 4 and Table 5. The calculations were done using Python version 3.11. The values in the grey colors indicate that the change was as expected as per the hypothesis of the research while the values in white color represent that the change was not as expected.
Table 3: Change in feature parameters before and after AVE sessions in ADHD subjects
| ADHD | RT | RA | RB | TB | TAB | BTA |
|---|---|---|---|---|---|---|
| 1 | -0.11 | 0.38 | 0.07 | -0.17 | -0.25 | 0.08 |
| 2 | -0.02 | 0.02 | 0.04 | -0.06 | 0.03 | 0.05 |
| 3 | -0.07 | -0.02 | 0.33 | -0.30 | -0.11 | 0.41 |
| 4 | 0.24 | -0.15 | -0.35 | 0.91 | 0.75 | -0.41 |
| 5 | -0.03 | 0.07 | -0.05 | 0.03 | -0.03 | -0.06 |
| 6 | -0.03 | 0.04 | 0.07 | -0.09 | 0.00 | 0.08 |
| 7 | 0.05 | -0.07 | -0.02 | 0.07 | 0.23 | -0.03 |
| 8 | 0.31 | -0.26 | -0.47 | 1.46 | 1.18 | -0.53 |
| 9 | -0.04 | 0.01 | 0.14 | -0.16 | -0.06 | 0.16 |
| 10 | 0.01 | -0.03 | 0.01 | 0.01 | 0.14 | 0.01 |
| 11 | -0.03 | -0.20 | 0.73 | -0.44 | -0.07 | 0.90 |
Table 4: Change in feature parameters before and after AVE sessions in Comorbid (ADHD+ASD) subjects.
| Com | RT | RA | RB | TB | TAB | BTA |
|---|---|---|---|---|---|---|
| 12 | -0.07 | 0.08 | 0.24 | -0.25 | -0.07 | 0.29 |
| 13 | -0.08 | 0.12 | 0.32 | -0.30 | -0.17 | 0.36 |
| 14 | 0.03 | 0.01 | -0.18 | 0.26 | 0.18 | -0.20 |
| 15 | 0.04 | -0.08 | -0.17 | 0.25 | 0.23 | -0.18 |
| 16 | -0.20 | 0.16 | 0.59 | -0.50 | -0.34 | 0.75 |
| 17 | -0.04 | 0.08 | 0.02 | -0.06 | -0.01 | 0.02 |
Table 5: Change in feature parameters before and after AVE sessions in ASD subjects
| ASD | RT | RA | RB | TB | TAB | BTA |
|---|---|---|---|---|---|---|
| 18 | 0.21 | -0.20 | -0.46 | 1.23 | 0.77 | -0.50 |
| 19 | 0.02 | 0.05 | -0.18 | 0.24 | 0.09 | -0.20 |
| 20 | 0.19 | -0.03 | -0.35 | 0.83 | 0.44 | -0.40 |
| 21 | 0.00 | -0.01 | 0.05 | -0.05 | 0.04 | 0.05 |
| 22 | 0.56 | -0.29 | -0.61 | 3.00 | 1.90 | -0.67 |
| 23 | 0.11 | -0.24 | -0.15 | 0.32 | 0.51 | -0.17 |
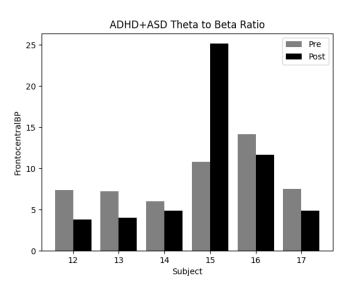
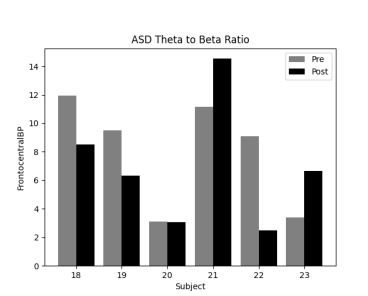
The above ADHD subject data in Table 3 represents that the relative theta power is suppressed in 8 subjects 1,2,3,4,5,6,9 and 11 and beta power is invoked to a little extent in 7 subjects 1,2,3,6,9,10,11. The Theta to Beta ratio reduced in 6 subjects 1,2,3,6,9,11 out of 11 ADHD subjects which is represented in graphical form in Fig. 7. The pre and post theta to beta ratio data is given in Fig. 10.The ratio of Beta to Theta and Alpha increased in 7 subjects 1,2,3,6,9,10,11. This data represents a positive change in 8 subjects and a negative change in 3 subjects in case of ADHD. Table 4 represents the comorbid subject data in which the relative theta power is suppressed in 4 subjects 12,13,16,17 and relative beta power is invoked in 4 subjects 12,13,16,17. The same is depicted in bar plot in Fig. 8. The pre and post theta to beta ratio data is given in Fig. 11. Table 5 contains the ASD subject data in which relative theta is not reduced and relative beta value is invoked in 1 subject 21 . The graphical representation of the data is given in Fig. 9. The pre and post theta to beta ratio data is given in Fig. 12.
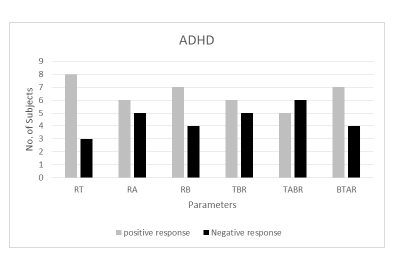
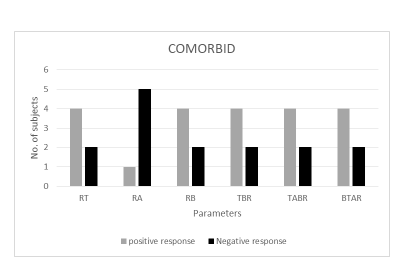
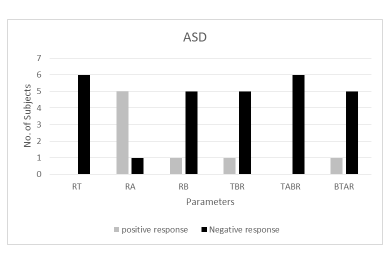
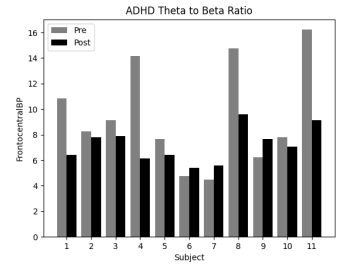
Figure 10: Bar plot of Theta to Beta Ratio before (Pre) and after (Post) the AVE sessions in ADHD subjects.
This analysis reveals that 72% of subjects showed a positive change in the case of ADHD, 66% of subjects showed a positive change in the case of Comorbid conditions, and 16% of subjects showed a positive change in the case of ASD.
This experiment does not require a control group in the traditional sense. In the study, we compared individual A’s pre-session data with the post-session data of individual A i.e. when the participant is not influenced by AVE and when the participant is influenced by AVE. Thus pre session data is equivalent to the control group.
4.2. Statistical analysis
The outliers in the data were screened using outlier detection algorithm [78]. The test scores were obtained by calculating the standard deviation. The test scores 2.5 times the standard deviation were considered outliers and exempted from further analysis. The box plot shows the outliers in Fig. 13. The results indicate two outliers. One from ADHD subgroup and one from ASD subgroup. The total number of participants for statistical analysis included 21 participants. Participants with good improvement in scores were contacted to check for the possible effects.

4.2.1. Brainwave Parameters
Since the null correlation is zero, we used the t distribution to test the correlation. The correlation’s distribution is not symmetrical when r is not equal to 0, hence we used the Z distribution over Fisher transformation to create the confidence interval. the scatter plots for the parameters are given in Fig. 14 to Fig. 20.
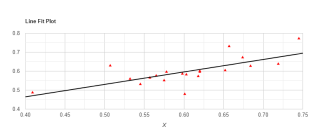
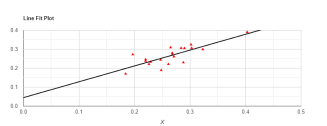
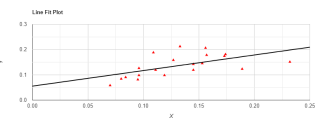
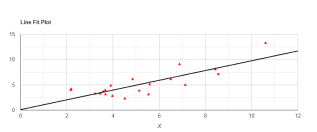
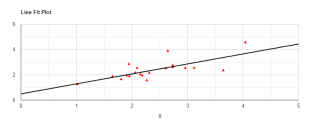
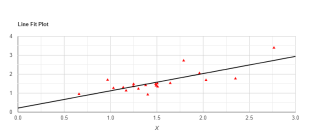
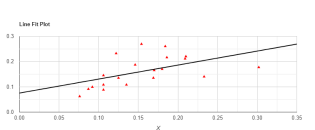
The Pearson correlation results in Table 6 indicated that there is a significant positive relationship between X (pre-session data) and Y (post-session data) in Fig. 11 to Fig. 17. The P value state that the difference between the sample correlation and the expected correlation is good enough to be statistically significant.
Table 6: Correlation between Brainwave ratios. Indicates p less than 0.01
| S. No. | Parameter (Pre and Post Sessions) | Pearson Correlation Coefficient (r) | Statistic | P-value |
|---|---|---|---|---|
| 1 | RT | 0.7149 | 4.3381 | 0.0004* |
| 2 | RA | 0.7971 | 5.6012 | 0.00003* |
| 3 | RB | 0.5779 | 3.0043 | 0.00762* |
| 4 | TBR | 0.8210 | 6.1005 | 0.00001* |
| 5 | TAR | 0.7204 | 4.4073 | 0.00034* |
| 6 | TABR | 0.7684 | 5.0942 | 0.00008* |
| 7 | BTAR | 0.5238 | 2.6091 | 0.01775* |
5. Results and Discussion
The power spectral density is one of the important factors that indicated the changes that occurred in the brainwave frequency before and after entrainment sessions. The quantitative analysis revealed a positive result in 7 subjects out of 11 subjects based on EEG data which subjects to nearly 72% of the positive result. In the Comorbid category, the feedback from guardians revealed a positive result in 5 subjects out of 6 subjects. In contrast, quantitative analysis revealed that positive results were observed in 4 subjects out of 6 subjects based on EEG data which resulted in positive results in nearly 66% of the subjects. In the case of ASD, the guardian’s feedback revealed a positive result in 2 subjects out of 6 subjects whereas the quantitative analysis revealed that positive results were observed in 1 subject out of 6 subjects based on EEG data that subjects to positive results in 16% of subjects. The same is depicted in Fig. 21. The feedback from the guardians of the participants was taken in different forms like messages, emails, word of mouth, etc. An in-depth case study approach and feedback using constructive tools for the clinical participants would have comprehensively elaborated the association of brainwaves with the clinical symptoms of NDs.

Overall considerations reveal that 17 out of 23 subjects observed positive results which is 73.9% in the case of behavioral analysis and 12 out of 23 subjects observed positive results which is 52.1% in the case of quantitative analysis. The statistical analysis also shows a positive correlation between pre and post-session data supporting the research. This research also found that there is a reduction in distraction and an improvement in cognitive power which is one of the most important factors to improve learning but still needs more investigation.
There was a lack of significant improvement in ASD. The reason behind this is the differences in neuroanatomy, functioning, and connectivity within the wider neural systems that probably mediate autistic symptoms and traits. However, the brain development in ASD is complex and is mediated by many genetic and environmental factors and their interactions [79]. Future work can explore the potential strategies to improve the results.
The differences in brainwave band power were analyzed to explore the role of change of theta, alpha, and beta bands post-entrainment sessions. The role of alpha-band oscillations was emphasized as a mechanism for selective attention due to their ability to process potential distracting stimuli [80], recent studies have challenged this theory [81]. Another study highlighted the interactions between theta and alpha/beta responses for visual selective attention among healthy individuals [82]. Further, [83] found the role of the beta frequency band’s rhythmic activity in the neuronal correlates of an individual’s attentional processes. High theta, low beta ADHD profile is well established in literature [84, 85, 86]. This suggests that an increase in TBR values will result in decreased attention.
Furthermore, in the current study, the individual’s theta and alpha PSD affected the alpha activity during the alpha entrainment sessions. Previous studies stated the role of alpha resting state PSD in determining the changes in central alpha asymmetry during alpha and beta entrainment sessions [72]. The current study supports the role of theta and alpha baseline PSD in determining the effects of alpha entrainment. Hence, an individual’s baseline frequencies could moderate the entrainment effects leading to individual differences.
Certain limitations need to be considered. The results were based on a small dataset, a larger dataset will give more accurate results. The results may vary when subjects with different dietary and lifestyle habits are considered. The observation time was limited to 20 days, and changes in the long run were unknown. Another limitation is that the scalp EEG is the result of the joint activity from multiple neurons, therefore, separating the source signals when the number of sources is greater than the number of sensors is promising. Another limitation is EEG quality degrades if the subject is not steady. So only the activities that can be done in a sitting position were given during EEG data recording.
6. Conclusion
This research provided evidence not only in the reduction of symptoms of the NDs but also an improvement in attention using audio photic brainwave entrainment. Though several studies show that AVE is a useful tool for treating attentional disorders, the introduction of VR for photic stimulation and portable commercial EEG devices, made it usable out of the lab, within the comfort zone of the subject. Food habits and gut health may also contribute to the improvement in the subject’s attention and learning which needs to be considered in further research work. Based on individual psychological health, personalized programmable devices can be developed further. This research also affects the symptoms of Stuttering, Dyslexia, and Neuro developmental delay but needs more investigation. Further research can also explore different approaches or therapies that may be more effective for ASD group. The study supports the use of technologically assistance to help children with ADHD maintain focus and manage transitions between activities. This can enable educators to personalize instruction and pacing without disrupting overall classroom. The results have important implications for psychosocial interventions for children with neural disorders by emphasizing the need for individualized, developmentally appropriate, and engagement driven approaches. The findings suggest that technology assisted therapies can improve accessibility and scalability of mental health services. The study highlights the shift from traditional, clinical centric models towards more adaptive and patient catered care.Future studies can involve in increasing the data set with diverse participant samples to improve the generalizability of findings across different age groups. Longitudinal study designs would help determine the stability and long-term impact of the observed outcomes.
- L. Ghirardi, Q. Chen, Z. Chang, R. Kuja-Halkola, C. Skoglund, P. D. Quinn, B. M. D’Onofrio, H. Larsson, “Use of medication for attentiondeficit/hyperactivity disorder and risk of unintentional injuries in children and adolescents with co-occurring neurodevelopmental disorders”, Journal of Child Psychology and Psychiatry, vol. 61, no. 2, pp. 140–147, 2020, doi:10.1111/jcpp.13136.
- A. Lolk, “Neurokognitive lidelser”, “Diagnostic and Statistical Manual of Mental Disorders”, American Psychiatric Association, 2013.
- R. G. Pila-Nemutandani, A. Meyer, “Behaviour planning and problem solving deficiencies in children with symptoms of attention deficit hyperactivity disorder from the balobedu culture, limpopo province, south africa”, Journal of Child & Adolescent Mental Health, vol. 28, no. 2, pp. 109–121, 2016, doi:10.2989/17280583.2016.1200582.
- R. N. Elisa, B. A. Parris, “The relationship between core symptoms of ADHD and the cognitive reflection test in a non-clinical sample”, Cognitive Neuropsychiatry, vol. 20, no. 5, pp. 416–423, 2015, doi:10.1080/13546805.2015.1068687.
- A. Kotte, G. Joshi, R. Fried, M. Uchida, A. Spencer, K. Y. Woodworth, J. Biederman, “Autistic traits in children with and without ADHD”, Pediatrics, vol. 132, no. 3, pp. e612–e622, 2013, doi:10.1542/peds.2012-3947.
- M. Cooper, J. Martin, K. Langley, M. Hamshere, A. Thapar, “Autistic traits in children with ADHD index clinical and cognitive problems”, European Child & Adolescent Psychiatry, vol. 23, pp. 23–34, 2014, doi:10.1007/s00787-013-0398-6.
- G. Joshi, S. V. Faraone, J. Wozniak, L. Tarko, R. Fried, M. Galdo, J. Biederman, “Symptom profile of ADHD in youth with high-functioning autism spectrum disorder: a comparative study in psychiatrically referred populations”, Journal of Attention Disorders, vol. 21, no. 10, pp. 846–855, 2017, doi:10.1177/1087054714543368.
- G. Joshi, S. V. Faraone, J. Wozniak, C. Petty, R. Fried, M. Galdo, J. Biederman, “Examining the clinical correlates of autism spectrum disorder in youth by ascertainment source”, Journal of Autism and Developmental Disorders, vol. 44, pp. 2117–2126, 2014, doi:10.1007/s10803-014-2063-4.
- F. Salazar, G. Baird, S. Chandler, E. Tseng, T. O’sullivan, P. Howlin, E. Simonoff, “Co-occurring psychiatric disorders in preschool and elementary school-aged children with autism spectrum disorder”, Journal of Autism and Developmental Disorders, vol. 45, pp. 2283–2294, 2015, doi:10.1007/s10803-015-2361-5.
- A. J. Kaat, K. D. Gadow, L. Lecavalier, “Psychiatric symptom impairment in children with autism spectrum disorders”, Journal of Abnormal Child Psychology, vol. 41, pp. 959–969, 2013, doi:10.1007/s10802-013-9739-7.
- P. Szatmari, S. E. Bryson, M. H. Boyle, D. L. Streiner, E. Duku, “Predictors of outcome among high functioning children with autism and asperger syndrome”, Journal of Child Psychology and Psychiatry, vol. 44, no. 4, pp. 520–528, 2003, doi:10.1111/1469-7610.00141.
- L. Wing, “Asperger’s syndrome: a clinical account”, Psychological Medicine, vol. 11, no. 1, pp. 115–129, 1981, doi:10.1017/S0033291700053332.
- L. Brothers, B. Ring, A. Kling, “Response of neurons in the macaque amygdala to complex social stimuli”, Behavioural Brain Research, vol. 41, no. 3, pp. 199–213, 1990, doi:10.1016/0166-4328(90)90108-Q.
- S. Tafazoli, J. O’Neill, A. Bejjani, R. Ly, N. Salamon, J. T. McCracken, J. G. Levitt, “1h MRSI of middle frontal gyrus in pediatric ADHD”, Journal of Psychiatric Research, vol. 47, no. 4, pp. 505–512, 2013, doi:10.1016/j.jpsychires.2012.11.011.
- J. Shaffer, “Neuroplasticity and clinical practice: Building brain power for health”, Frontiers in Psychology, vol. 7, p. 1118, 2016, doi:10.3389/fpsyg.2016.01118.
- V. F. da Silva, A. P. Ribeiro, V. A. Dos Santos, A. E. Nardi, A. L. King, M. R. Calomeni, “Stimulation by light and sound: Therapeutics effects in humans”, Clinical Practice & Epidemiology in Mental Health, vol. 11, pp. 150–154, 2015, doi:10.2174/1745017901511010150.
- N. Jirakittayakorn, Y. Wongsawat, “A novel insight of effects of a 3-hz binaural beat on sleep stages during sleep”, Frontiers in Human Neuroscience, vol. 12, p. 387, 2018, doi:10.3389/fnhum.2018.00387.
- D. Donker, L. Njio, W. Storm Van Leeuwen, G. Wieneke, “Interhemispheric relationships of responses to sine wave modulated light in normal subjects and patients”, EEG and Clinical Neurophysiology, vol. 44, pp. 479–489, 1978.
- D. Regan, “Some characteristics of average steady state and transient responses evoked by modulated light”, EEG and Clinical Neurophysiology, vol. 20, pp. 238–248, 1965.
- R. Townsend, “A device for generation and presentation of modulated light stimuli”, Electroencephalography and Clinical Neurophysiology, vol. 34, pp. 97–99, 1973.
- L. Van Der Tweel, H. Lunel, “Human visual responses to sinusoidally modulated light”, Encephalography and Clinical Neurophysiology, vol. 18, pp. 587–598, 1965.
- R. Phogat, P. Parmananda, A. Prasad, “Intensity dependence of sub-harmonics in cortical response to photic stimulation”, Journal of Neural Engineering, vol. 19, no. 4, p. 046026, 2022, doi:10.1088/1741-2552/ac817f.
- W. G. Walter, “Colour illusions and aberrations during stimulation by flickering light”, Nature, vol. 177, p. 710, 1956, doi:10.1038/177710A0.
- T. L. Huang, C. Charyton, “A comprehensive review of the psychological effects of brainwave entrainment”, Alternative Therapies in Health and Medicine, vol. 14, no. 5, pp. 38–50, 2008.
- T. Nomura, K. Higuchi, H. Yu, S.-i. Sasaki, S. Kimura, H. Itoh, et al., “Slow-wave photic stimulation relieves patient discomfort during esophagogastroduodenoscopy”, Journal of Gastroenterology and Hepatology, vol. 21, no. 1, pp. 54–58, 2006, doi:10.1111/j.1440-1746.2005.04204.x.
- H. C. Ossebaard, “Stress reduction by technology? an experimental study into the effects of brainmachines on burnout and state anxiety”, Applied Psychophysiology and Biofeedback, vol. 25, no. 2, pp. 93–101, 2000, doi:10.1023/A:1009514824951.
- J. Williams, D. Ramaswamy, A. Oulhaj, “10 hz flicker improves recognition memory in older people”, BMC Neuroscience, vol. 7, p. 21, 2006, doi:10.1186/1471-2202-7-21.
- J. P. Rosenfeld, A. M. Reinhart, S. Srivastava, “The effects of alpha (10-hz) and beta (22-hz) “entrainment” stimulation on the alpha and beta EEG bands: individual differences are critical to prediction of effects”, Applied Psychophysiology and Biofeedback, vol. 22, no. 1, pp. 3–20, 1997, doi:10.1023/A:1026233624772.
- J. H. Williams, “Frequency-specific effects of flicker on recognition memory”, Neuroscience, vol. 104, no. 2, pp. 283–286, 2001, doi:10.1016/S0306-4522(00)00579-0.
- J. E. Lisman, M. A. P. Idiart, “Storage of 7 +/- 2 short-term memories in oscillatory subcycles”, Science, vol. 267, no. 5203, pp. 1512–1515, 1995, doi:10.1126/science.7878473.
- P. Sauseng, W. Klimesch, K. Heise, “Brain oscillatory substrates of visual short-term memory capacity”, Current Biology, vol. 19, pp. 1846–1852, 2009, doi:10.1016/j.cub.2009.08.062.
- G. Oster, “Auditory beats in the brain”, Scientific American, vol. 229, no. 4, pp. 94–102, 1973, doi:10.1038/scientificamerican1073-94.
- M. Mandapati, P. Ranjan, “Virtual reality based audio visual brainwave entrainment to improve learning in children with attention deficit hyperactive disorder”, Applied Neuropsychology: Child, pp. 1–15, 2025, doi:10.1080/21622965.2025.2455102.
- M. Mandapati, P. Ranjan, “Re-engineering of brainwaves to increase resistance to distractions in young adults and promote optimal learning”, “2024 6th International Conference on Electrical, Control and Instrumentation Engineering (ICECIE)”, pp. 1–7, IEEE, 2024, doi:10.1109/ICECIE63774.2024.10815674.
- P. R. Huttenlocher, “Synaptic density in human frontal cortex—developmental changes and effects of aging”, Brain Research, vol. 163, no. 2, pp. 195–205, 1979, doi:10.1016/0006-8993(79)90349-4.
- P. R. Huttenlocher, “The development of synapses in striate cortex of man”, Hum Neurobiol, vol. 6, pp. 1–9, 1987.
- B. J. Casey, J. N. Giedd, T. K. (et al.), “Structural and functional brain development and its relation to cognitive development”, Biol Psychol, vol. 54, pp. 241–257, 2000.
- M. Sur, R. J. (et al.), “Patterning and plasticity of the cerebral cortex”, Science, vol. 310, pp. 805–810, 2005.
- F. Levy, D. A. Hay, M. McStephen, C. Wood, I. Waldman, “Attention-deficit hyperactivity disorder: A category or a continuum? genetic analysis of a large-scale twin study”, Journal of the American Academy of Child & Adolescent Psychiatry, vol. 36, no. 6, pp. 737–744, 1997, doi:https://doi.org/10.1097/00004583-199706000-00009.
- S. V. Faraone, “Genetics of childhood disorders: XX. ADHD, Part 4: is ADHD genetically heterogeneous?”, J Am Acad Child Adolesc Psychiatry, vol. 39, pp. 1455–1457, 2000.
- C. A. Mann, J. F. Lubar, A. W. Zimmerman, C. A. Miller, R. A. Muenchen, “Quantitative analysis of EEG in boys with attentiondeficit-hyperactivity disorder: Controlled study with clinical implications”, Pediatric Neurology, vol. 8, pp. 30–36, 1992.
- J. F. Lubar, “Discourse on the development of EEG diagnostics and biofeedback for attention-deficit/hyperactivity disorder”, Biofeedback and Self-Regulation, vol. 16, pp. 201–225, 1991.
- C. P. Utter, “A controlled study of the effects of neurofeedback training on IQ and EEG patterns for ADD subjects”, 1996.
- H. L. Russell, “Intellectual, auditory and photic stimulation and changes in functioning in children and adults”, Biofeedback, 25(1), 16–17, vol. 23, p. 24, 1997.
- J. F. Lubar, W. M. Deering, Behavioral Approaches to Neurology, Academic Press, New York, 1981.
- J. O. Lubar, J. F. Lubar, “Electroencephalographic biofeedback of SMR and beta for treatment of attention deficit disorders in a clinical setting”, Biofeedback and Self-Regulation, vol. 9, pp. 1–23, 1984.
- J. F. Lubar, M. N. Shouse, “Use of biofeedback in the treatment of seizure disorders and hyperactivity”, in B. B. Lahey, A. E. Kazdin (eds.), “Advances in Child Clinical Psychology”, Plenum Press, New York, 1977.
- M. A. Tansey, “Righting the rhythms of reason, EEG biofeedback training as a therapeutic modality in a clinical office setting”, Medical Psychotherapy, vol. 3, pp. 57–68, 1990.
- American Psychiatric Association, Diagnostic and Statistical Manual of Mental Disorders, American Psychiatric Association, Washington, DC, 2000.
- American Psychiatric Association, Diagnostic and Statistical Manual of Mental Disorders, American Psychiatric Association, Washington, DC, 1994.
- L. Brookman-Frazee, N. Stadnick, C. Chlebowski, M. Baker-Ericzén, W. Ganger, “Characterizing psychiatric comorbidity in children with autism spectrum disorder receiving publicly funded mental health services”, Autism, vol. 22, no. 8, pp. 938–952, 2018, doi:10.1177/1362361317712650.
- L. Ghirardi, I. Brikell, R. Kuja-Halkola, C. M. Freitag, B. Franke, P. Asherson, H. Larsson, “The familial co-aggregation of ASD and ADHD: a register-based cohort study”, Molecular Psychiatry, vol. 23, no. 2, pp. 257–262, 2018, doi:10.1038/mp.2017.17.
- L. Ghirardi, E. Pettersson, M. J. Taylor, C. M. Freitag, B. Franke, P. Asherson, R. Kuja-Halkola, “Genetic and environmental contribution to the overlap between ADHD and ASD trait dimensions in young adults: a twin study”, Psychological Medicine, vol. 49, no. 10, pp. 1713–1721, 2019, doi:10.1017/S003329171800243X.
- E. Magallon-Neri, D. Vila, K. Santiago, P. Garcia, G. Canino, “The prevalence of psychiatric disorders and mental health services utilization by parents and relatives living with individuals with autism spectrum disorders in Puerto Rico”, The Journal of Nervous and Mental Disease, vol. 206, no. 4, pp. 226–230, 2018, doi:10.1097/NMD.0000000000000760.
- M. Septier, H. Peyre, F. Amsellem, A. Beggiato, A. Maruani, M. Poumeyreau, R. Delorme, “Increased risk of ADHD in families with ASD”, European Child & Adolescent Psychiatry, vol. 28, pp. 281–288, 2019, doi:10.1007/s00787-018-1206-0.
- E. Jokiranta-Olkoniemi, K. Cheslack-Postava, P. Joelsson, A. Suominen, A. S. Brown, A. Sourander, “Attention-deficit/hyperactivity disorder and risk for psychiatric and neurodevelopmental disorders in siblings”, Psychological Medicine, vol. 49, no. 1, pp. 84–91, 2019, doi:10.1017/S0033291718000521.
- J. Toman, “Flicker potentials and the alpha rhythm in man”, Journal of Neurophysiology, vol. 4, pp. 51–61, 1940.
- J. S. Barlow, “Rhythmic activity induced by photic stimulation in relation to intrinsic activity of the brain in man”, Electroencephalography and Clinical Neurophysiology, vol. 12, pp. 317–326, 1960.
- T. Inouye, N. Sumitsuji, K. Matsumoto, “EEG changes induced by light stimuli modulated with the subject’s alpha rhythm”, Electroencephalography and Clinical Neurophysiology, vol. 49, pp. 135–142, 1979.
- J. Kinney, C. McKay, A. Mensch, S. Luria, “Visual evoked responses elicited by rapid stimulation”, EEG and Clinical Neurophysiology, vol. 34, pp. 7–13, 1972.
- T. Nogawa, K. Katayama, Y. Tabata, T. Ohshio, T. Kawahara, “Changes in amplitude of the EEG induced by a photic stimulus”, Electroencephalography and Clinical Neurophysiology, vol. 40, pp. 78–88, 1976.
- R. P. Lesser, H. Lüders, G. Klem, D. S. Dinner, “Visual potentials evoked by light-emitting diodes mounted in goggles”, Cleveland Clinic Quarterly, vol. 52, pp. 223–228, 1986.
- J. Frederick, J. L. Lubar, H. Rasey, S. Brim, J. Blackburn, “Effects of 18.5 hz auditory and visual stimulation on EEG amplitude at the vertex”, Journal of Neurotherapy, vol. 3, no. 3, pp. 23–27, 1999.
- D. Noton, “Pms, EEG, and photic stimulation”, 1996.
- R. Meppelink, E. I. de Bruin, S. M. Bögels, “Meditation or medication? mindfulness training versus medication in the treatment of childhood ADHD: a randomized controlled trial”, BMC Psychiatry, vol. 16, pp. 1–16, 2016, doi:10.1186/s12888-016-0978-3.
- J. L. Carter, H. L. Russell, “A pilot investigation of auditory and visual entrainment of brain wave activity in learning disabled boys”, Texas Researcher, Journal of the Texas Center for Educational Research, vol. 4, pp. 65–73, 1993.
- E. Argento, G. Papagiannakis, E. Baka, “Augmented cognition via brainwave entrainment in virtual reality: An open, integrated brain augmentation in a neuroscience system approach”, Augmented Human Research, vol. 2, p. 3, 2017, doi:10.1007/s41133-017-0005-3.
- S. J. Halpin, N. K. Tang, A. J. Casson, A. K. Jones, R. J. O’Connor, M. Sivan, “User experiences of pre-sleep sensory alpha brainwave entrainment for people with chronic pain and sleep disturbance”, Pain Management, vol. 13, no. 5, pp. 259–270, 2023, doi:10.2217/pmt-2022-0083.
- R. J. Addante, M. Yousif, R. Valencia, C. Greenwood, R. Marino, “Boosting brain waves improves memory”, Frontiers for Young Minds, vol. 9, 2021, doi:10.3389/frym.2021.605677.
- H. N. Locke, J. Brooks, L. J. Arendsen, N. K. Jacob, A. Casson, A. K. Jones, M. Sivan, “Acceptability and usability of smartphone-based brainwave entrainment technology used by individuals with chronic pain in a home setting”, British Journal of Pain, vol. 14, no. 3, pp. 161–170, 2020, doi:10.1177/2049463720908798.
- N. C. Lecavalier, B. Boller, S. Belleville, “Use of immersive virtual reality to assess episodic memory: A validation study in older adults”, Neuropsychological Rehabilitation, 2018, doi:10.1080/09602011.2018.1477684.
- J. P. Rosenfeld, E. Baehr, R. Baehr, I. H. Gotlib, C. Ranganath, “Preliminary evidence that daily changes in frontal alpha asymmetry correlate with changes in affect in therapy sessions”, International Journal of Psychophysiology, vol. 23, no. 1-2, pp. 137–141, 1996.
- M. Klug, T. Berg, K. Gramann, “Optimizing EEG ICA decomposition with data cleaning in stationary and mobile experiments”, Scientific Reports, vol. 14, no. 1, p. 14119, 2024, doi:10.1038/s41598-024-64919-3.
- R. N. Vigário, “Extraction of ocular artefacts from EEG using independent component analysis”, Electroencephalography and Clinical Neurophysiology, vol. 103, no. 3, pp. 395–404, 1997, doi:10.1016/S0013-4694(97)00042-8.
- R. Vigário, J. Sarela, V. Jousmiki, M. Hamalainen, E. Oja, “Independent component approach to the analysis of EEG and MEG recordings”, IEEE Transactions on Biomedical Engineering, vol. 47, no. 5, pp. 589–593, 2000, doi:10.1109/10.841330.
- C. A. Joyce, I. F. Gorodnitsky, M. Kutas, “Automatic removal of eye movement and blink artifacts from EEG data using blind component separation”, Psychophysiology, vol. 41, no. 2, pp. 313–325, 2004, doi:10.1111/j.1469-8986.2003.00141.x.
- C. Mateo, J. A. Talavera, “Bridging the gap between the short-time fourier transform (STFT), wavelets, the constant-q transform and multi-resolution STFT”, Signal, Image and Video Processing, vol. 14, no. 8, pp. 1535–1543, 2020, doi:10.1007/s11760-020-01701-8.
- J. T. Gregg, J. H. Moore, “Star outliers: a python package that separates univariate outliers from non-normal distributions”, BioData Mining, vol. 16, no. 1, p. 25, 2023, doi:10.1186/s13040-023-00342-0.
- C. Ecker, S. Y. Bookheimer, D. G. Murphy, “Neuroimaging in autism spectrum disorder: brain structure and function across the lifespan”, The Lancet Neurology, vol. 14, no. 11, pp. 1121–1134, 2015, doi:10.1016/S1474-4422(15)00050-2.
- J. J. Foxe, A. C. Snyder, “The role of alpha-band brain oscillations as a sensory suppression mechanism during selective attention”, Frontiers in Psychology, vol. 2, p. 154, 2011, doi:10.3389/fpsyg.2011.00154.
- P. A. Antonov, R. Chakravarthi, S. K. Andersen, “Too little, too late, and in the wrong place: Alpha band activity does not reflect an active mechanism of selective attention”, NeuroImage, vol. 219, p. 117006, 2020, doi:10.1016/j.neuroimage.2020.117006.
- B. K. Taylor, J. A. Eastman, M. R. Frenzel, C. M. Embury, Y. P. Wang, V. D. Calhoun, T. W. Wilson, “Neural oscillations underlying selective attention follow sexually divergent developmental trajectories during adolescence”, Developmental Cognitive Neuroscience, vol. 49, p. 100961, 2021, doi:10.1016/j.dcn.2021.100961.
- J. H. Lee, M. A. Whittington, N. J. Kopell, “Top-down beta rhythms support selective attention via interlaminar interaction: a model”, PLoS Computational Biology, vol. 9, no. 8, p. e1003164, 2013, doi:10.1371/journal.pcbi.1003164.
- A. R. Clarke, R. J. Barry, R. McCarthy, M. Selikowitz, C. A. Magee, S. J. Johnstone, R. J. Croft, “Quantitative EEG in low-IQ children with attention-deficit/hyperactivity disorder”, Clinical Neurophysiology, vol. 117, no. 8, pp. 1708–1714, 2006, doi:10.1016/j.clinph.2006.04.015.
- M. M. Lansbergen, M. Arns, M. van Dongen-Boomsma, D. Spronk, J. K. Buitelaar, “The increase in theta/beta ratio on resting-state EEG in boys with attention-deficit/hyperactivity disorder is mediated by slow alpha peak frequency”, Progress in Neuro-Psychopharmacology and Biological Psychiatry, vol. 35, no. 1, pp. 47–52, 2011, doi:10.1016/j.pnpbp.2010.08.004.
- E. Shephard, C. Tye, K. L. Ashwood, B. Azadi, P. Asherson, P. F. Bolton, G. McLoughlin, “Resting-state neurophysiological activity patterns in young people with ASD, ADHD, and ASD+ADHD”, Journal of Autism and Developmental Disorders, vol. 48, pp. 110–122, 2018, doi:10.1007/s10803-017-3300-4.