Analysis of 5G Business Model Components for Mobile Network Operators in Sub-Saharan Africa
(This article belongs to the Section Operations Research and Management Science (ORM))
Export Citations
Cite
Banda, L. (2025). Analysis of 5G Business Model Components for Mobile Network Operators in Sub-Saharan Africa. Journal of Engineering Research and Sciences, 4(2), 1–10. https://doi.org/10.55708/js0402001
Laurence Banda. "Analysis of 5G Business Model Components for Mobile Network Operators in Sub-Saharan Africa." Journal of Engineering Research and Sciences 4, no. 2 (February 2025): 1–10. https://doi.org/10.55708/js0402001
L. Banda, "Analysis of 5G Business Model Components for Mobile Network Operators in Sub-Saharan Africa," Journal of Engineering Research and Sciences, vol. 4, no. 2, pp. 1–10, Feb. 2025, doi: 10.55708/js0402001.
The fierce race among mobile network operators (MNOs) to roll out fifth-generation (5G) networks has intensified. One of the potential markets where 5G deployment has increased tremendously is Sub-Saharan Africa. This is primarily due to rapid economic growth and the new opportunities that 5G networks and the associated technologies are expected to offer through sustainable digital transformation. However, research on 5G has mainly focused on the technical aspects with minimal consideration of the business side. Furthermore, research on business models for emerging 5G networks in the African context has received little attention from the scholarly community. This article explores and analyzes the components of the 5G business model for mobile network operators in Sub-Saharan Africa. This study is timely as MNOs should re-evaluate their existing business models to withstand the economic disruption that 5G networks bring. The study was conducted using a quantitative research method through a statistical analysis approach. Empirical results show that the performance of some business model components directly affects others, while other components are not directly related.
1. Introduction
Fifth generation mobile networks (5G) are part of the next-generation in the evolving series of mobile networks that have been defined and standardized by the International Telecommunication Union (ITU) as IMT-2020 [1]. 5G is considered a transformative technology with improved technical characteristics compared to previous generations of mobile technologies and can support the development of innovative service applications across the economy [2]. Consequently, 5G is expected to contribute a total of approximately US$22.2 trillion to global GDP and US$588 billion in global tax revenue during the period 2020 to 2034 [3]. Furthermore, 5G networks and the underlying technologies offer a new opportunity to drive economic growth in emerging economies such as sub-Saharan Africa [4].
One of the major economic disruptions that has resulted from the introduction of 5G networks is the complete change in the design and implementation of mobile network operators (MNOs) business models. To this end, 5G networks require novel business models that can deliver both economic value and technological innovation to MNOs in a sustainable manner. This is crucial as MNOs should have the flexibility to rethink their existing business models in order to remain competitive and viable given the economic peculiarities that 5G networks bring [5].
Research on 5G business models has focused more on the conceptual framework approach without going into the details of the business model components and their interrelationships. This article examines the business model component for 5G network operators. Although a global perspective is regarded as an appropriate approach, the MNOs considered in this study come from emerging economies, particularly the Sub-Saharan Africa region. Therefore, this study occupies a unique place in the body of knowledge as it analyses components of the 5G business for MNOs in Sub-Saharan Africa. The key research question of the study is:
How can the components of the 5G business model be analysed to have a positive impact on the business viability of mobile network operators in Sub-Saharan Africa?
The rest of the article is structured as follows. Section 2 reviews the related work in the existing literature. Section 3 highlights 5G networks from an African perspective. Section 4 introduces the components of the 5G business model and their relationships. Section 5 discusses the research methodology while Section 6 provides the results, analysis and discussion. Section 7 finally concludes the article.
2. Related Work
Several recent developments in 5G business models for mobile network operators have been published extensively in the existing literature. A survey article on 5G business models for mobile network operators was presented in [3]. The authors present various business models that apply to both public and private 5G mobile networks. However, no data analysis was carried out in the work as the work was purely a survey study. A techno-economic analysis of private 5G networks was conducted in [6]. The authors focused on the cost structures associated with the deployment of private 5G networks. Nonetheless, other components of the value chain such as value proposition, customer segment and infrastructure management were not taken into account. Furthermore, the work in [6] was only applicable to private networks.
In [7], a conceptual business model framework for AI-based private 5G-IoT networks was presented. The author argues that the study contributes to the development of innovative business model solutions for 5G, Internet of Things (IoT) and Artificial Intelligence (AI). However, the work in [7] was only at a theoretical level and did not include data collection and analysis. Additionally, an analytical framework was developed in [8] that aimed to calculate the revenue of mobile operators while ensuring end-users’ service satisfaction. The problem of revenue maximization is solved algorithmically through proposed green energy operation and allocation strategies. However, the work in [8] was only limited to the revenue aspects of the business model concept. Moreover, other business model elements such as cost structure, value proposition, customer segments and infrastructure management were not considered.
In [9], 5G network slicing business models were presented. The outlined business models target the Internet of Vehicles (IoV) and the Internet of Things (IoT) for maritime vertical applications. The authors’ focus was on generic business model approaches and did not go into the analysis of the business model components. A study in [10] identified six key topics for the techno-economic assessment of 5G, including business models, use cases, technologies, modeling techniques, financial indicators and other specific focus areas. However, the work in [10] only considered theoretically formulated business models without including the practical implementation aspects by key players such as mobile network operators, industry verticals, regulators and policymakers.
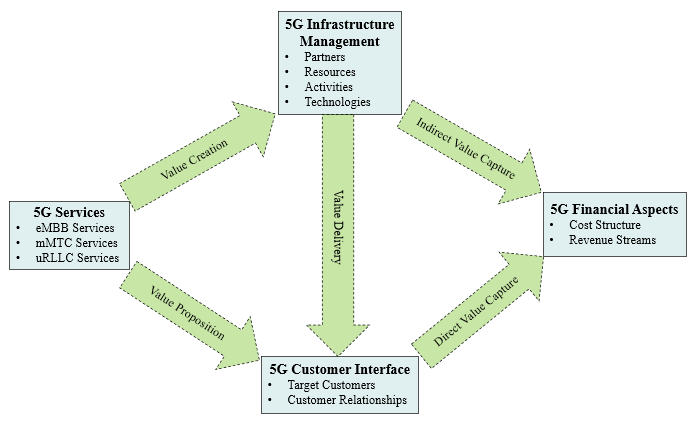
This study approached the business model concept from a strategic management perspective by focusing on value proposition, value creation, value delivery and value capture activities within the business ecosystem of 5G mobile network operators [11]. The value chain activities can be translated into the four business model components, namely 5G services, 5G infrastructure management, 5G customer interface and 5G financial aspects.
3. 5G Networks in Africa
3.1. 5G Opportunities
5G provides a myriad of opportunities for Africa to actively participate and play a critical role in the continued global development and deployment of these emerging technologies. This is despite Africa having historically lagged behind in technological advancements [12]. The introduction of 5G in Africa promises various socio-economic benefits such as job creation, growth in income per household, reduction in carbon emissions and improved quality of life for inhabitants [13]. Furthermore, 5G can enable a long-term digital transformation and contribute to the emergence of sustainable digitalized societies [14]. 5G will offer greater access to higher broadband capacity and reliable connectivity for the creation of a digitally connected smart society needed to realize the UN 2030 Agenda and Sustainable Development Goals (SDGs) at national and regional levels [15].
3.2. 5G Deployment and Adoption Forecast
According to [16], there will be 226 million 5G connections in Sub-Saharan by 2030, and this will represent a regional adoption rate of 17%. However, the penetration rate of 5G networks in Africa is still minimal. For instance, [17] observed that as of 2022, the adoption rate of 5G was approximately 1% of all mobile connections and is expected to increase to 8% by 2026 and reaching 22% by 2030. The 5G transport network is mainly supported by fiber infrastructure due to the higher transmission bandwidth and low transmission latency of fiber optic technology [18]. According to [19], the fiber penetration rate in Africa was 10% in 2017 compared to 30% globally and will only reach 15% by 2025 compared to 40% globally.
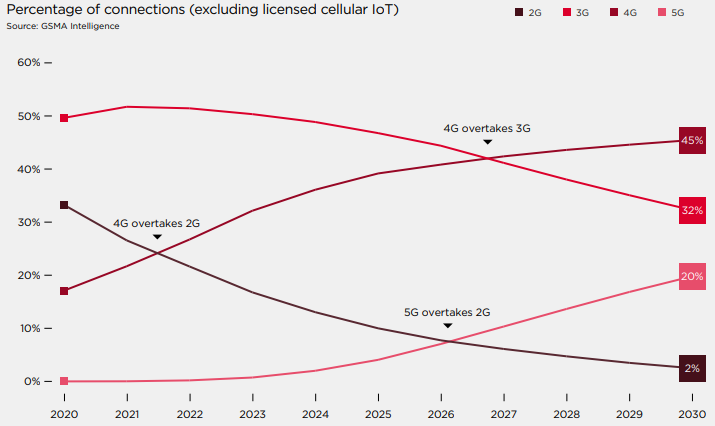
Despite the ongoing massive deployment of 5G technologies in the Sub-Saharan African region, the GSMA report in [17], predicts that 4G will remain a dominant technology for the foreseeable future before 5G gains maturity. Figure 1 shows the scope of mobile networks in Africa from 2020 to 2030 as forecast by the GSMA report in [17] .
3.3. 5G Rollout Challenges
The extensive rollout of 5G in most African markets has been impeded by various technical, socio-economic and societal challenges. For example, the deployment 5G in certain regions was inhibited by speculations of negative health consequences on society by linking 5G networks with the spread of the COVID-19 pandemic [20]. Another key barrier to the deployment of 5G is the huge capital expenditure required by African mobile network operators to upgrade or purchase 5G network equipment from suppliers [13]. Other challenges facing mobile network operators in rolling out 5G have been outlined in [3]. These include exorbitant spectrum pricing by national regulators, unavailability and unaffordability of 5G-supporting devices, inadequate or substandard 5G network infrastructure, low fiber penetration for 5G backhaul network, and unreliable power supply in most African countries.
4. 5G Business Model Components
4.1. 5G Value Chain
In order to successfully develop and implement viable and sustainable 5G business models, mobile network operators must precisely define the composition of the 5G value chain. In this study, the proposed 5G value chain elements are based on the business model ontology described in [21]. The 5G value chain activities include the following process.
Value proposition: A summary of the benefits a mobile operator offers its customers and how those benefits differ from the competition.
Value creation: The process of generating 5G services that are more valuable than the resources used to create them.
Value delivery: The process that ensures that the value created reaches the intended customer base.
Value capture: The process of retaining a portion of the value created by a mobile operator and converting it into profit. Direct value capture comes from the direct use of 5G services by subscriber customers, indirect value capture arises from the use of infrastructure services by third parties.
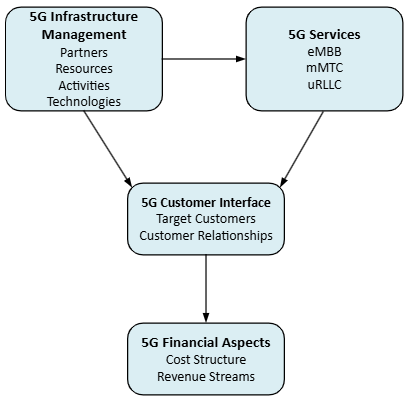
4.2. Business Model Components and their Relationships
The proposed 5G business model for mobile network operators consists of four main components: 5G services, 5G infrastructure management, 5G customer interface and 5G financial aspects. These components are interconnected through the 5G value chain activities described previously.
(i) 5G Services
The value proposition envisages a wide range of products and services that a mobile operator offers. The three main 5G service classes that form the value proposition component of the proposed conceptual business model framework are: (i) enhanced mobile broadband (eMBB) services tailored for throughput-sensitive applications such as high-speed broadband access, immersive mobile services, and high-quality video content applications; (ii) massive machine type communication (mMTC) services target applications with high device connectivity density such as industrial IoT and commercial IoT service applications; and (iii) ultra
reliable low latency communications (uRLLC) services intended for low latency (delay) and high reliability communications, for example mission-critical applications such as industrial automation and remote surgery.
(ii) 5G Infrastructure Management
Infrastructure management describes the technology design, network infrastructure and resources available to a mobile operator to deliver the relevant proposed value to intended customers. The infrastructure management component of the proposed conceptual business model framework consists of four sub-components: (i) 5G partners, highlighting the need for collaborative arrangements with external organizations to effectively deliver and monetize the proposed value. This includes equipment vendors, device manufacturers, platform providers, regulatory and policymakers and other mobile operators; (ii) 5G resources which describe the resources available to the mobile operator to ensure that value is created and delivered in line with business objectives. Examples include physical, intellectual, human, financial, spectrum and site equipment and infrastructure; (iii) 5G activities which describe the activities and competencies required to implement the mobile operator’s business model. This includes managing partnerships, network design and maintenance, mobile service delivery and technical customer support; and (iv) 5G technologies, which describe the underlying and supporting technologies that a mobile operator must design and implement to ensure that 5G services are created and delivered to intended customers. Technologies include network slicing, green communications, digital platforms, SDN and NFV, ultra-densification, IoT and D2D communications, and massive MIMO and beamforming.
(iii) 5G Customer Interface
The customer interface component of the proposed 5G business model consists of three sub-components including: (i) Customer segment, which describes the customer base to which a mobile operator wants to offer value, i.e., customers attracted by the value proposition. Examples include state agencies, local municipalities, private enterprises and vertical industries; (ii) Customer relationships which explain the nature of the connections a mobile operator creates between itself and its different customer segments, such self-services, personal assistance services, automated services and community-based services.
(iv) 5G Financial Aspects
The financial aspects of the proposed 5G business model describe a mobile operator’s ability to capture and monetize the proposed value for intended customers. The financial aspects consist of two elements: (i) Cost structure, which summarizes the monetary impact of the resources used in the business model such as fixed costs, variable costs, CapEx and OpEx; and (ii) Revenue streams, which describe how a mobile operator makes money through a variety of revenue flows such as subscription fees, leasing/rental of assets, advertising and revenue sharing through partnerships.
Figure 2 above illustrates the components of the proposed 5G business model and their interrelationships across value chain activities.
5. Methodology
5.1. Research Design
The study was conducted in two phases using quantitative research method outlined in [22]. The two phases of the research design are shown in Figure 3.
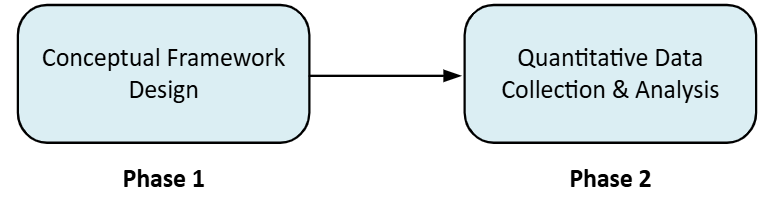
Phase 1: Results from the reviewed literature are used to design a conceptual business model framework that 5G mobile network operators can implement.
Phase 2: The conceptualised business model framework is subjected to statistical testing using quantitative methods.
5.2. Conceptual Framework
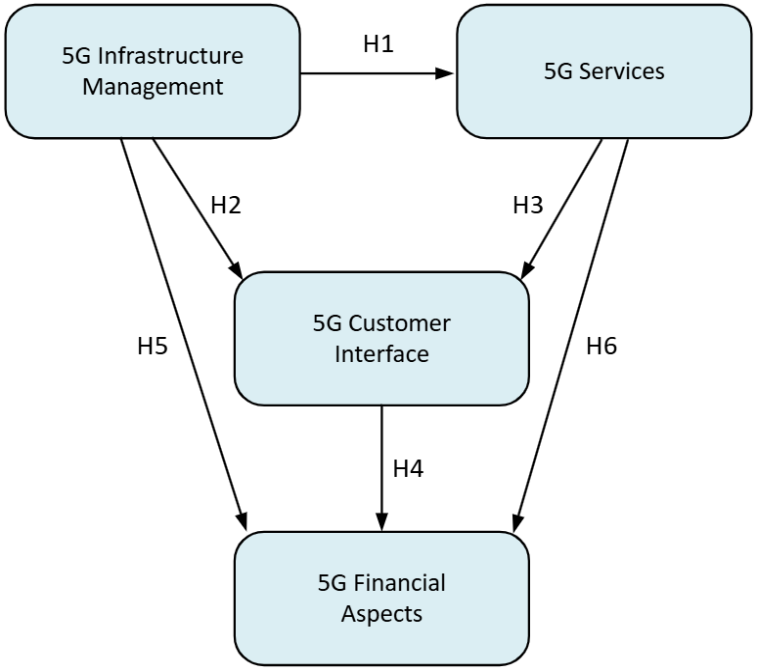
The proposed conceptual business model framework of this study is shown in Figure 4. Furthermore, based on the empirical literature reviews, the study postulates six research hypotheses which are outlined below.
Hypotheses definitions:
H1: There is a significant positive impact of 5G Infrastructure Management on 5G Services.
H2: There is a significant positive impact of 5G Infrastructure Management on the 5G Customer Interface.
H3: There is a significant positive influence of 5G Services on the 5G Customer Interface.
H4: There is a significant positive influence of 5G Customer Interface on the 5G Financial Aspects.
H5: There is a significant positive impact of 5G Infrastructure Management on 5G Financial Aspects .
H6: There is a significant positive influence of 5G Service on 5G Financial Aspects.
5.3. Data Collection Procedures
This study involved quantitative data collection through structured online survey questionnaires. Qualtrics, an online data collection software was used to design, capture and summarize data. A total of 102 questionnaires were distributed for the study. There were 71 responses. However, only 62 responses were found to be usable for data analysis. A summary of the sample response rate is shown in Table 1.
Table 1: Data Collection Sample Response Rate
Questionnaire distributed Questionnaires returned Usable questionnaires Usable response rate | 102 71 62 60.8% |
6. Results, Analysis and Discussions
The data analysis of the study was conducted in two phases using statistical analysis. In the first part, descriptive statistics are provided for both demographic data and the measurement instruments using Statistical Package for the Social Sciences (SPSS) software. The second part provides results for hypothesis testing using structural equation models (SEMs) to derive various coefficients using SmartPLS software.
6.1. Demographic Descriptive Statistics Results
Demographic descriptive results are based on descriptive statistical analysis which was conducted in Statistical Package for SPSS) software. Demographic data included participants’ gender, position in the company, department/functional area and years of experience in the mobile industry. SPSS software was used to clean data and present results using frequency tables.
(i) Research participants by gender
Demographic data results by participants’ gender show that 67.7% of the participants were males while 32.3% of the participants were females. Table 2 shows the sample distribution according to participants’ gender.
Table 2: Research Participants by Gender
| Frequency | Cumulative Frequency | Valid Percent | Cumulative Percent |
Valid Male | 42 | 67.7 | 67.7 | 67.7 |
Female | 20 | 32.3 | 32.3 | 100 |
Total | 62 | 100 | 100 |
(ii) Research participants by position in the company
The results of the demographic data by participants’ positions in the company show that the majority of participants were in middle management (32.3%), while top executives made up only 12.9% of the data collected. Table 3 shows the sampling distribution of research participants according to their position in the company.
Table 3: Research Participants by Position in the Company
| Frequency | Cumulative Frequency | Valid Percent | Cumulative Percent |
Valid Top Executive | 8 | 8 | 12.9 | 12.9 |
Senior Manager | 13 | 21 | 21.0 | 33.9 |
Mid-level Manager | 20 | 41 | 32.3 | 66.2 |
Employee | 18 | 59 | 29.0 | 95.2 |
Others | 3 | 62 | 4.8 | 100 |
Total | 62 | 100 |
(iii) Research participants by functional area
Responses by functional area within the company indicate that most participants came from the networks/technical area (69.4%), followed by the information technology (IT) area (17.7%). Other functional areas such as finance, sales/marketing and logistics were hardly represented. Table 3 shows the demographic distribution of participants by functional area in the company.
Table 4: Research Participants by Functional Area
| Frequency | Cumulative Frequency | Valid Percent | Cumulative Percent |
Valid Networks/Technical | 43 | 43 | 69.4 | 69.4 |
I.T | 11 | 54 | 17.7 | 87.1 |
Finance | 2 | 56 | 3.2 | 90.3 |
Sales/Marketing | 4 | 60 | 6.5 | 96.8 |
Logistics | 1 | 61 | 1.6 | 98.4 |
Others | 1 | 62 | 1.6 | 100 |
Total | 62 | 100 |
(iv) Research participants by years of experience
The participants in the study stated their years of experience in the mobile communications industry. Sample data shows that most participants had more than 10 years of experience (62.9%). Those with 6 to 10 years of experience accounted for 24.2%, while those with 1 to 5 years of experience accounted for 12.9% of the total sample response. Table 4 shows the sample response of years of experience in the mobile industry.
Table 5: Research Participants by Years of Experience
| Frequency | Cumulative Frequency | Valid Percent | Cumulative Percent |
Valid 1 – 5 years | 8 | 8 | 12.9 | 12.9 |
6 – 10 years | 15 | 23 | 24.2 | 37.1 |
Over 10 years | 39 | 62 | 62.9 | 100 |
Total | 62 | 100 |
6.2. PLS-SEM Inferential Statistics Results
Structural equation modeling (SEM) is a diverse set of methods that scientists use when conducting quantitative business research [23]. Partial Least Square SEM (PLS-SEM) is a form of SEM used to maximize the variance of the dependent variable and is often applied when working with complex models, limited sample sizes, and the need for prediction [24]. Due to the small sample size and complexity of this study, PLS-SEM was selected.
The PLS-SEM analysis is conducted in two phases [25]:
(1) Measurement model analysis, which specifies relationships between research constructs and research indicators, and (2) Structural model analysis, which specifies the relationships between research constructs. In this study, PLS-SEM analysis was performed using SmartPLS software, from which various measurement coefficients were derived. The resulting coefficients were used to test the formulated research hypothesis.
The PLS-SEM in the SmartPLS software shows the measurement indicators (measurement variables) and constructs (latent variables), which can be either independent or dependent. One or more measurement indicators are assigned to each latent variable. Measurement indicators correspond to questions in a research questionnaire, while constructs are derived from a conceptual or theoretical model. Independent variables are constructs that are not dependent on other constructs, while dependent variables are those that are dependent on one or more constructs. The relationship between variables is called a path and is associated with a path coefficient. In this study, 5G Infrastructure Management (5G-IM) was the only independent variable and was supported by two measurement indicators. The dependent variables include 5G Services (5G-S) with two measurement indicators, 5G Customer Interface (5G-CI) with four measurement indicators, and 5G Financial Aspects (5G-FA) with six measurement indicators. Figure 5 shows the PLS-SEM model of this study in SmartPLS software.
(i) Measurement Model Results and Analysis
A reflective measurement model was used in the study and the criteria for evaluating the reflective measurement model include: internal consistency, convergent validity and discriminant validity [26]. Internal consistency is a quality criterion of a construct that requires a high degree of correlation between indicators of a particular construct [27]. The two common measures of internal consistency are Cronbach’s alpha and composite reliability. Convergent validity is the extent to which a measure is positively correlated with an alternative measure of the same construct and the measurement criterion is the average variance extracted (AVE) [27]. Discriminant validity is the extent to which a construct actually differs from other constructs by empirical standards and is commonly measured using the heterotrait-monotrait ratio (HTMT) [28]. Table 5 shows the results of the measurement model, including the threshold value of the measurement criteria and the conclusions on the results.
(ii) Structural Model Results and Analysis
Assessment of the structural model is the second phase of the PLS-SEM approach, which follows confirmation of the reliability and validity of the construct measures. The structural model and its latent variables represent the stable, theoretically and conceptually established contextual relationship between observed data on the input and output sides of the PLS-SEM model [27]. Structural modelling is used to assess causal relationships between latent variables and includes multiple regression analysis and path analysis [29]. Table 6 shows the significance results of the path coefficient with the associated parameters: t-values, p-values, 95% confidence intervals and the standard deviation. According to [28], p-values below 0.05 and t-values above 1.96 indicate path significance and a strong relationship between two variables.
(iii) Hypothesis Testing
After the assessment of the measurement and structural models of the PLS-SEM analysis was completed, the study examined the relationships between research constructs through path analysis and hypothesis testing. When testing hypotheses, path coefficients ( ) reflect the nature and strength of the relationships between variables: the higher the value, the stronger the relationship. To determine whether the hypotheses are supported or not, the -values, p-values and t-values are analysed within a 95% confidence interval [28]. For the hypothesis to be supported, the following conditions must be met: p-value < 0.05, t-value > 1.96 and 95% confidence interval. Table 7 shows the hypothesis testing results of the current study. From the results of Table 12, four of the six hypotheses are significant and supported. Further analysis is carried out as follows:
H1: There is a significant positive impact of 5G Infrastructure Management (5G-IM) on 5G Services (5G-S). H1 evaluates whether 5G-IM significantly and positively affects 5G-S. The results revealed that 5G-IM has a significant and positive impact on 5G-S ( = 0.539, t = 7.537, p < 0.05). Hence H1 was supported.
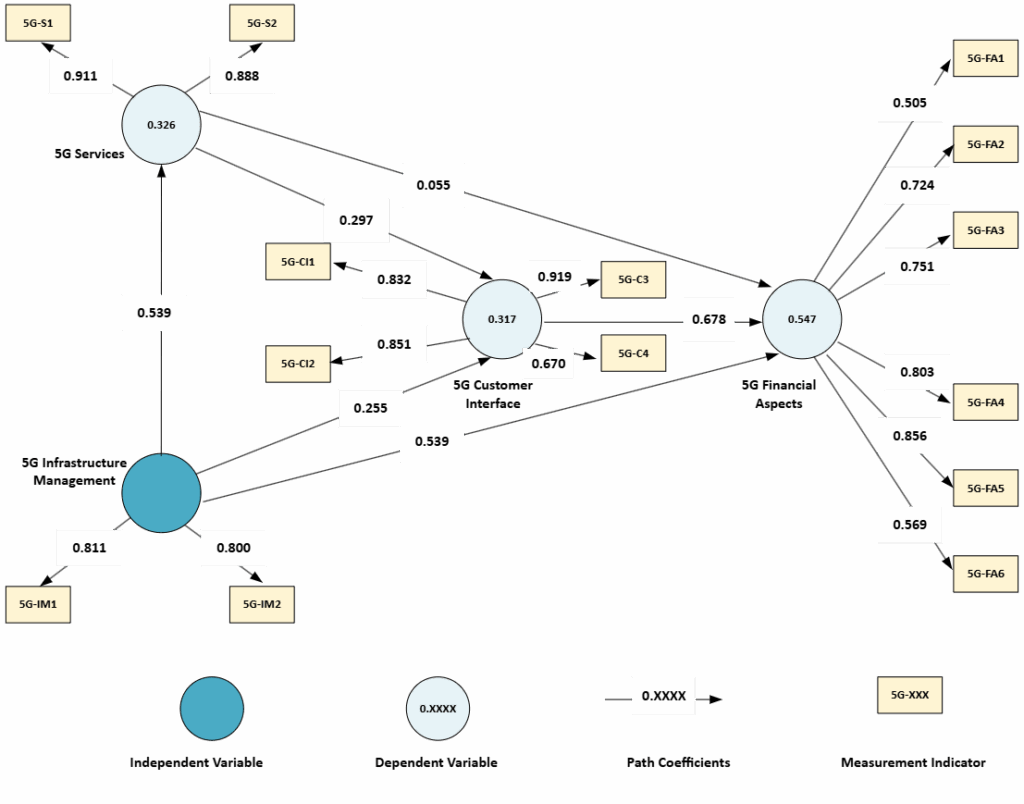
Table 5: Results from the Measurement Model Evaluation
Research Construct | Internal Consistency | Convergent Validity | Discriminant Validity | ||||||
Cronbach Alpha (CA) Threshold (CA > 0.7) | Composite Reliability (CR) Threshold (CR > 0.7) | Average Variance Extracted Threshold (AVE < 0.5) | Heterotrait-monotrait ratio (HTMT) Threshold (HTMT < 0.9) | ||||||
Value | Conclusion | Value | Conclusion | Value | Conclusion | Constructs Relationship | Value | Conclusion | |
5G Infrastructure Management (5G-IM) | 0.715 | Acceptable | 0.787 | Acceptable | 0.649 | Acceptable | 5G-IM =>> 5G-S | 0.810 | Acceptable |
5G Services (5G-S) | 0.765 | Acceptable | 0.902 | Acceptable | 0.809 | Acceptable | 5G-IM =>> 5G-CI | 0.657 | Acceptable |
5G Customer Interface (5G-CI) | 0.836 | Acceptable | 0.892 | Acceptable | 0.678 | Acceptable | 5G-IM =>> 5G-FA | 0.605 | Acceptable |
5G Financial Aspects (5G-FA) | 0.798 | Acceptable | 0.857 | Acceptable | 0.508 | Acceptable | 5G-S =>> 5G-CI | 0.548 | Acceptable |
5G-S =>> 5G-FA | 0.440 | Acceptable | |||||||
5G-CI =>> 5G-FA | 0.849 | Acceptable | |||||||
Table 6: Results from the Structural Model Evaluation
Path Coefficient | Standard Deviation | t– Values | p-Values | 95% Confidence Intervals | Significance (p < 0.05) | |
5G Services => 5G Customer Interface | 0.297 | 0.144 | 2.063 | 0.042 | [0.026, 0.502] | Yes |
5G Services => 5G Financial Aspects | 0.055 | 0.135 | 0.405 | 0.686 | [-0.209, 0.251] | No |
5G Customer Interface => 5G Financial Aspects | 0.678 | 0.084 | 8.110 | 0.000 | [0.511, 0.812] | Yes |
5G Infrastructure Management => 5G Services | 0.539 | 0.071 | 7.537 | 0.000 | [0.433, 0.696] | Yes |
5G Infrastructure Management => 5G Customer Interface | 0.255 | 0.115 | 2.227 | 0.028 | [0.067, 0.473] | Yes |
5G Infrastructure Management => 5G Financial Aspects | 0.059 | 0.12 | 0.491 | 0.624 | [-0.179, 0.271] | No |
Table 7: Results from Hypothesis Test
Path Hypothesis | Path Coefficient ( ) | t– Values | p-Values | 95% Confidence Intervals | Significance (p < 0.05) | Test Results |
H1: 5G Infrastructure Management => 5G Service | 0.539 | 7.537 | 0.000 | [0.433, 0.696] | Yes | Supported |
H2: 5G Infrastructure Management =>5G Customer Interface | 0.255 | 2.227 | 0.028 | [0.067, 0.473] | Yes | Supported |
H3: 5G Service => 5G Customer Interface | 0.297 | 2.063 | 0.042 | [0.026, 0.502] | Yes | Supported |
H4: 5G Customer Interface => 5G Financial Aspects | 0.678 | 8.110 | 0.000 | [0.511, 0.812] | Yes | Supported |
H5: 5G Infrastructure Management => 5G Financial Aspects | 0.059 | 0.491 | 0.624 | [-0.179, 0.271] | No | Not supported |
H6: 5G Service => 5G Financial Aspects | 0.055 | 0.405 | 0.686 | [-0.209, 0.251] | No | Not Supported |
H2: There is a significant positive impact of 5G Infrastructure Management (5G-IM) on the 5G Customer Interface (5G-CI). H2 evaluates whether 5G-IM significantly and positively affects 5G-CI. The results revealed that 5G-IM has a significant and positive impact on 5G-CI ( = 0.255, t = 2.227, p < 0.05). Hence H2 was supported.
H3: There is a significant positive influence of 5G Services (5G-S) on 5G Customer Interface (5G-CI). H3 evaluates whether 5G-S significantly and positively affects 5G-CI. The results revealed that 5G-S has a significant and positive influence on 5G-CI ( = 0.297, t = 2.063, p < 0.05). Hence H3 was supported.
H4: There is a significant positive influence of 5G Customer Interface (5G-CI) on 5G Financial Aspects (5G-FA). H4 evaluates whether 5G-CI significantly and positively affects 5G-FA. The results revealed that 5G-CI has a significant and positive impact on 5G-FA ( = 0.678, t = 8.110, p < 0.05). Hence H4 was supported.
H5: There is a significant positive impact of 5G Infrastructure Management (5G-IM) on 5G Financial Aspects (5G-FA). H5 evaluates whether 5G-IM significantly and positively affects 5G-FA. The results revealed that 5G-IM has an insignificant impact on the 5G-FA ( = 0.059, t = 0.491, p > 0.05). Hence, H5 was not supported.
H6: There is a significant positive influence of 5G Services (5G-S) on 5G Financial Aspects (5G-FA). H6 evaluates whether 5G-S significantly and positively affect 5G-FA. The results revealed that 5G-S have an insignificant impact on the 5G-FA ( = 0.055, t = 0.405, p > 0.05). Hence, H6 was not supported.
(iv) Final Business Model Framework
From the two-phased quantitative research method and the results of the research hypothesis tests, the final business model framework is shown in Figure 6.
7. Conclusion
5G networks and associated technologies are expected to drive the digital economy and enable sustainable digital transformation in emerging markets such as Sub-Saharan Africa. However, in order for mobile network operators in these markets to benefit from the economic opportunities of 5G, existing business models should be re-assessed. This article examined and analyzed components of the 5G business model for mobile network operators in Africa. The study was conducted using a quantitative research method through a statistical analysis approach. Descriptive statistical analyses were performed in SPSS software to obtain demographic results, while inferential statistical analyses were performed using SmartPLS software for PLS-SEM modeling and research hypothesis testing. Of the six research hypotheses formulated, four were significantly supported, while two were insignificant and therefore rejected. Empirical results showed that the performance of some business model components directly affects others, while other components are not directly related. Future work will consider a larger sample size for primary data collection and analysis as more mobile network operators would have deployed 5G networks.
- ITU-R, “IMT Vision – Framework and overall objectives of the future development of IMT for 2020 and beyond,” ITU, 2015. [Online]. Available: https://www.itu.int/dms_pubrec/itu-r/rec/m/R-REC-M.2083-0-201509-I!!PDF-E.pdf
- J. Whalley and P. Curwen, “Creating value from 5G: The challenge for mobile operators,” Telecommunications Policy, vol. 48, no. 2, p. 102647, 2024, doi: 10.1016/j.telpol.2023.102647.
- L. Banda, M. Mzyece, and F. Mekuria, “5G Business Models for Mobile Network Operators—A Survey,” IEEE Access, vol. 10, pp. 94851–94886, 2022, doi: 10.1109/ACCESS.2022.3205011.
- C. Najjuuko, G. K. Ayebare, R. Lukanga, E. Mugume, and D. Okello, “A Survey of 5G for Rural Broadband Connectivity,” in 2021 IST-Africa Conference (IST-Africa), IEEE, pp. 1–10, 2021.
- S. Moqaddamerad, “Visioning Business Model Innovation for Emerging 5G Mobile Communications Networks,” Technology Innovation Management Review, vol. 10, no. 12, 2020.
- H. Frank, C. Colman-Meixner, K. D. R. Assis, S. Yan, and D. Simeonidou, “Techno-Economic Analysis of 5G Non-Public Network Architectures,” IEEE Access, vol. 10, pp. 70204–70218, 2022, doi: 10.1109/ACCESS.2022.3187727.
- L. Banda, “Conceptual Business Model Framework for AI-based Private 5G-IoT Networks,” Journal of Engineering Research and Sciences, vol. 3, no. 10, pp. 13–20, 2024, doi: 10.55708/js0310002.
- A. Balakrishnan, S. De, and L.-C. Wang, “Network operator revenue maximization in dual powered green cellular networks,” IEEE Transactions on Green Communications and Networking, vol. 5, no. 4, pp. 1791–1805, 2021.
- E. Borcoci, A.-M. Drăgulinescu, F. Y. Li, M.-C. Vochin, and K. Kjellstadli, “An overview of 5G slicing operational business models for Internet of vehicles, maritime IoT applications and connectivity solutions,” IEEE Access, vol. 9, pp. 156624–156646, 2021.
- E. J. Oughton, N. Comini, V. Foster, and J. W. Hall, “Policy choices can help keep 4G and 5G universal broadband affordable,” Technological Forecasting and Social Change, vol. 176, p. 121409, 2022, doi: 10.1016/j.techfore.2021.121409.
- B. W. Wirtz, A. Pistoia, S. Ullrich, and V. Göttel, “Business models: Origin, development and future research perspectives,” Long Range Planning, vol. 49, no. 1, pp. 36–54, 2016, doi: 10.1016/j.lrp.2015.04.001.
- I. M. Garba, O. Oshiga, and L. B. Moriki, “Deployment, Standardization and Regulatory Challenges Of 5G Services In Africa: Nigeria As A Case Study,” in 2022 IEEE Nigeria 4th
International Conference on Disruptive Technologies for Sustainable
Development (NIGERCON), IEEE, Lagos, Nigeria, pp. 1–5, 2022, doi: 10.1109/NIGERCON54645.2022.9803135 - W. Coetzee, F. Mekuria, and Z. du Toit, Making 5G a reality for Africa, 2018.
- Ericsson, “5G for business: a 2030 market compass – Setting a direction for 5G-powered B2B opportunities,” Ericsson, 2019. [Online]. Available: https://www.ericsson.com/en/5g/5g-for-business/5g-for-business-a-2030-market-compass
- C. Russell, “SDG 11,” BGjournal, vol. 15, no. 1, pp. 31–33, 2018.
- GSMA, The Mobile Economy: Sub-Saharan Africa 2023, 2023.
- K. Okeleke, J. Joiner, and E. Kolta, 5G in Africa: realising the potential, GSMA Intelligence, 2022.
- M. Jaber, M. A. Imran, R. Tafazolli, and A. Tukmanov, “5G backhaul challenges and emerging research directions: A survey,” IEEE Access, vol. 4, pp. 1743–1766, 2016, doi: 10.1109/ACCESS.2016.2556011.
- C. Handforth, “Closing the coverage gap: How innovation can drive rural connectivity,” GSMA Connected Society (GSMA), 2019.
- G. O. Ovenseri-Ogbomo et al., “Factors associated with the myth about 5G network during COVID-19 pandemic in sub-Saharan Africa,” Journal of Global Health Reports, 2020, doi: 10.29392/001c.18116.
- A. Osterwalder and Y. Pigneur, “Investigating the Use of the Business Model Concept through Interviews,” Association for Information Systems AIS Electronic Library (AISeL), 2004.
- J. Bloomfield and M. J. Fisher, “Quantitative research design,” Journal of the Australasian Rehabilitation Nurses Association, vol. 22, no. 2, pp. 27–30, 2019.
- M. Sarstedt, C. M. Ringle, and J. F. Hair, “Partial least squares structural equation modeling,” in Handbook of Market Research, Springer, pp. 587–632, 2021, doi: 10.1007/978-3-319-05542-8_15-2.
- E. Edeh, W.-J. Lo, and J. Khojasteh, “Review of Partial Least Squares Structural Equation Modeling (PLS-SEM) Using R: A Workbook,” 2023.
- J. F. Hair, C. M. Ringle, and M. Sarstedt, “Partial least squares structural equation modeling: Rigorous applications, better results and higher acceptance,” Long Range Planning, vol. 46, no. 1–2, pp. 1–12, 2013, doi: 10.1016/j.lrp.2013.01.001.
- J. F. Hair Jr., L. M. Matthews, R. L. Matthews, and M. Sarstedt, “PLS-SEM or CB-SEM: updated guidelines on which method to use,” International Journal of Multivariate Data Analysis, vol. 1, no. 2, pp. 107–123, 2017, doi: 10.1504/IJMDA.2017.087624.
- M. P. N. Janadari, S. S. Ramalu, and C. Wei, “Evaluation of measurement and structural model of the reflective model constructs in PLS–SEM,” in Proceedings of the 6th International Symposium—2016 South Eastern University of Sri Lanka (SEUSL), Oluvil, Sri Lanka, pp. 187–194, 2016.
- J. F. Hair, G. T. M. Hult, C. M. Ringle, and M. Sarstedt, A Primer on Partial Least Squares Structural Equation Modeling (PLS-SEM), 3rd ed., SAGE Publications, 2022.
- K. Nusair and N. Hua, “Comparative assessment of structural equation modeling and multiple regression research methodologies: E-commerce context,” Tourism Management, vol. 31, no. 3, pp. 314–324, 2010, doi: 10.1016/j.tourman.2009.03.010.