
Predictive Inventory Allocation Models for Regional Pandemic Preparedness Networks

(This article belongs to the Section Industrial Engineering (IND))
Export Citations
Cite
Mendes, D. F. (2026). Predictive Inventory Allocation Models for Regional Pandemic Preparedness Networks. Journal of Engineering Research and Sciences, 5(11), 1–25. https://doi.org/10.55708/js0511001
Dion Francis Mendes. "Predictive Inventory Allocation Models for Regional Pandemic Preparedness Networks." Journal of Engineering Research and Sciences 5, no. 11 (November 2026): 1–25. https://doi.org/10.55708/js0511001
D.F. Mendes, "Predictive Inventory Allocation Models for Regional Pandemic Preparedness Networks," Journal of Engineering Research and Sciences, vol. 5, no. 11, pp. 1–25, Nov. 2026, doi: 10.55708/js0511001.
The COVID-19 pandemic exposed a structural weakness in healthcare supply chains: inventory is managed facility by facility, which limits regional visibility of local needs, available stock and opportunities to redistribute it. Prior research has examined demand forecasting, inventory optimization, emergency logistics and the ethics of resource allocation, but few studies integrate these streams in a single regional, rolling-horizon decision architecture that includes governance. This conceptual and methodological paper addresses that gap by proposing a predictive inventory allocation framework for regional pandemic preparedness. The framework comprises seven operational capabilities (uncertainty-adjusted demand forecasting, regional inventory visibility, multi-objective allocation, equity safeguarding, inventory pooling, interfacility redistribution and rolling-horizon adaptation), organized in four layers and coordinated by one governance mechanism. It serves six objectives: shortage mitigation, service continuity, distribution efficiency, allocation stability, reserve preservation and protection of vulnerable facilities and populations. Drawing on systems theory, dynamic capabilities theory, resource dependence theory, and distributive and procedural justice theory, we develop four propositions that link regional visibility, coordination, need-based allocation and reserve-protected redistribution to measurable outcomes, together with indicators and moderators. A formal multi-objective model is specified, and a stylized example with four hypothetical hospitals illustrates its mechanics against three baseline allocation rules. The framework has not been empirically validated; a three-phase validation strategy is outlined. The contribution is a theoretically grounded and operationally specified architecture that links forecasting, equity-aware allocation and conditional redistribution.
1. Introduction
Pandemics have revealed an inherent flaw in the operation of healthcare supply chain systems. Critical inventory has traditionally been managed at the local level. While shortages have developed at the local level during the COVID-19 pandemic, similar shortages were developing at the same time in multiple regions throughout the country. The combination of concurrent increases in demand and various forms of disruption to production, procurement, transportation and replenishment led to significant shortages of Personal Protective Equipment (PPE) and other essential medical supplies. These disruptions were exacerbated by high levels of supplier concentration, fragmentation of purchasing decisions, low levels of end-to-end visibility and lack of coordination across different organizations [1], [2]. Although collaborative efforts and technological innovation could increase the resilience of healthcare supply chain systems, there is still very little evidence that these capabilities have been effectively integrated at the regional level [3]. As a result, competing healthcare facilities are often unable to identify either usable inventory, reserve capacity or redistribution opportunities that exist elsewhere within the same region.
This article outlines a predictive framework for anticipating, identifying, protecting and redistributing critical inventory across regional healthcare networks during a pandemic. The framework comprises seven operational capabilities: uncertainty-adjusted demand forecasting (C1), regional inventory visibility (C2), multi-objective allocation (C3), equity safeguarding (C4), inventory pooling (C5), interfacility redistribution (C6) and rolling-horizon adaptation (C7). These capabilities are organized in four layers (data consolidation, predictive analysis, allocation optimization, and implementation and review) and are bound together by a single governance mechanism (G), which establishes decision rights, transparency, accountability and review procedures. In this paper, the framework architecture always refers to this structure of seven capabilities, four layers and one governance mechanism. The framework rests on the premise that pandemic preparedness requires not only more supply but also better identification, protection and reallocation of existing inventory.
1.1 Background and Research Problem
Healthcare inventory systems today generally operate on conventional methods that were originally intended for normal day-to-day operating environments where replenishments occur consistently over time and inventory control occurs at the facility level. However, during pandemics these assumptions frequently do not hold. For example, demand for certain types of inventory can vary significantly across different geographic areas and at different rates of increase. Similarly, suppliers’ ability to deliver needed inventory may be highly variable depending on factors such as production lead time and transportation capacity. Finally, some types of inventory may not be restocked by the required date due to unforeseen problems with transportation or logistics. As a result, while a healthcare facility may be facing a critical shortage of PPE or another type of inventory, there may be unused or underused inventory located elsewhere within the same regional network that would help alleviate the shortage if properly identified and redistributed.
In addition to creating logistical challenges related to managing inventory levels at individual facilities, decentralized procurement processes can create additional problems such as duplication of purchases among facilities, competition among facilities for available products, inconsistency in maintaining reserve inventories and providing a consistent basis for assessing product availability across all potential sources. Because healthcare supply chains rely heavily on collaboration, flexibility, adaptability and data-sharing [1], [2], these characteristics are increasingly being recognized as critical elements of supply chain resilience. Similarly, because digital technologies can enhance situational awareness and facilitate quicker response times [3], visibility is now widely viewed as a critical component of supply chain resilience. Visibility alone however does not ensure optimal allocation of scarce products.
Regional decision-makers must therefore weigh several variables at once, including forecasted shortages, uncertainty about future demand, continued provision of necessary services, transportation constraints, maintenance of reserve inventories, allocation stability, and variability in the degree to which different facilities and populations will be affected by a shortage. Static allocation mechanisms based solely on historical usage, acquisition costs, population demographics or the order in which requests are received cannot respond adequately to this dynamic, multidimensional environment. Optimization models can take into account demand priorities and supply uncertainty; however, most focus on a single distribution period rather than the full range of activities involved in allocating critical products during a prolonged crisis [4]. The research problem is thus not merely that total inventory is insufficient; it is that few existing approaches provide a regional decision-making architecture that converts shared data into coordinated, equitable and responsive allocation decisions.
1.2 Research Gap
Research related to the topic of this paper is dispersed across three distinct bodies of literature. One body of research focuses on the importance of building resilient healthcare supply chains via improved collaboration, visibility, sourcing flexibility, redundancy and digital capability [1], [2], [3]. Another body of research examines using mathematical models to optimize forecasting, stockpiling, transportation and distribution (e.g., [4], [5]). A third body of research focuses on issues related to fairness, transparency and accountability when making resource allocation decisions during crises events [6]. While each body of literature is relevant to understanding key aspects of the issue addressed by this paper, collectively they offer few insights on how these capabilities should work together to form an effective regional inventory allocation system.
Specifically, previous research offers little insight on how a regional healthcare network can utilize uncertain demand forecasts to identify potential shortages occurring at specific facilities within the network; compare those potential shortages with available inventory and reserve capacity in other parts of the network; weigh competing objectives such as maximizing efficiency and promoting equity while minimizing instability in future allocations; determine whether redistribution is warranted; and adjust decisions as new demand projections are issued and/or as new shipments arrive and/or as transportation capacity changes. Without integrating these capabilities, enhanced visibility may not resolve competitive allocation conflicts, optimized solutions may not protect equity interests, and ethical guidelines may not translate into implementable decisions about critical medical products.
This study addresses this gap by proposing an integrated conceptual framework that links seven operational capabilities (C1–C7): uncertainty-adjusted forecasting; regional inventory visibility; multi-objective allocation; equity safeguarding; inventory pooling; interfacility redistribution; and rolling-horizon adaptation. Governance (G) is proposed as the institutional mechanism through which decision rights, transparency, accountability and review procedures are established among member institutions. These seven capabilities and one governance mechanism, organized in four layers (Figures 1 and 2), constitute the framework architecture and are referred to by the same names throughout the paper.
The novelty claim is deliberately bounded. Several studies already combine forecasting, optimization and allocation for pandemic resources, including [7], [8], [9], [10] and [11]. The present study does not claim that these elements have not been combined before. Its claim, developed in the literature synthesis and in Table 1, is narrower: among the studies we examined, none jointly specifies (i) a regional rolling-horizon cycle, (ii) an explicit separation of operational stock, protected reserve and transferable surplus, (iii) an equity measure that distinguishes equity from equality, and (iv) the governance, incentive and legal conditions under which redistribution can occur.
1.3 Research Aim and Questions
The purpose of this research is to establish a theoretically grounded, predictive and equity-sensitive framework for allocating critical medical products across regional healthcare networks during pandemics. The study specifies the framework’s concepts, decision logic, relationships and theoretical premises, thereby establishing a foundation for subsequent simulations, case studies and empirical evaluations.
Three research questions are addressed in this research effort:
RQ1: What are the ways in which uncertainty-adjusted forecasting combined with regional inventory visibility can support earlier and more coordinated allocation of critical medical supplies?
RQ2: In what ways can regional decision-making address conflicting goals among the six objectives of shortage mitigation, service continuity, distribution efficiency, allocation stability, reserve preservation, and protection of vulnerable facilities and populations?
RQ3: Under what circumstances can inventory pooling; redistribution; and rolling-horizon adaptations contribute to greater overall preparedness in responding to changes in demand and supply conditions during pandemics?
1.4 Research Approach
This is a conceptual theory-building study with a methodological (model-specification) component. It is not an empirical hypothesis-testing study and reports no primary data. The theory building follows the logic of conceptual article design [12], in which established theories are synthesized to derive constructs and propositions. The decision framework and formal model are specified following design science principles [13], [14]: problem identification, definition of objectives, design of the artifact, illustration and an evaluation plan. Evaluation beyond illustration is deferred to the validation strategy.
Literature selection and synthesis. The literature was identified through targeted searches on healthcare supply chain resilience, pandemic resource allocation, inventory pooling and transshipment, predictive and prescriptive analytics, equity in allocation, and governance of analytics in healthcare, supplemented by backward and forward citation tracking from key studies. Peer-reviewed studies on healthcare or pandemic supply, inventory, allocation or governance were included, with emphasis on work from 2020 onward. They were synthesized narratively into the five components of the literature review and compared with the framework capabilities (Table 1). This is a narrative rather than a systematic review, so statements about gaps are limited to the literature examined.
1.5 Contributions to the Study
This research effort makes three major contributions to prior literature. First, it represents a shift away from focusing on individual healthcare facilities toward focusing on regional healthcare networks. Pandemic-related inventory allocation is portrayed as an interdependent coordinated process wherein projected shortages are compared to network wide inventory reserves and redistribution opportunities.
Second, the proposed framework embeds equity into the decision-making process rather than portraying equity as an afterthought or an external ethical requirement. Equity-related considerations include minimum-service guarantees; considerations relative to vulnerabilities in facilities/populations; reserve-safeguarding provisions; transparent decision-making procedures; and review procedures are embedded as design requirements into the framework. In doing so this study translates distributive and procedural justice into operational constraints/allocative priorities.
Third, this research effort establishes a connection between allocation decisions and adaptation. Rather than portray allocation decisions as one-time decisions, the framework utilizes a rolling-horizon format to repeatedly assesses updated demand forecasts; current inventory levels/location status/delivery delays/transportation capacity/unmet needs etc. This study therefore portrays not just how regional allocations might be made but also how they could be modified without sacrificing equity or preparedness objectives.
Taken together, the study contributes (i) theoretically, by deriving four testable propositions with measurable constructs and moderators from four complementary theories; (ii) methodologically, through a formal multi-objective model that separates operational stock, protected reserve and transferable surplus and defines equity explicitly; and (iii) practically, through governance and implementation guidance, including a starting guide for practitioners. These contributions are conceptual and have not been validated empirically.
2. Literature Review and Theoretical Foundations
Healthcare systems must anticipate demand during a pandemic, share inventory data, coordinate resources across different parts of the system, and allocate limited supplies among facilities. Research has identified many aspects of resilient healthcare supply chains, including forecasting, inventory management, collaboration, optimization and distributional equity, but these areas remain only partly integrated. This section synthesizes the five components that form the foundation of the proposed framework: pandemic-specific vulnerabilities of healthcare supply chains; predictive demand assessment and regional coordination; multi-objective and equitable allocation; theoretical foundations; and remaining gaps in the interdisciplinary literature on integrating them.
2.1 Pandemic Related Weaknesses in Healthcare Supply Chains
The nature of a pandemic creates simultaneous increases in demand for medical products and disruptions to production, trade, transportation and restocking. For example, during COVID-19, PPE shortages were exacerbated by reliance on imports, concentration of manufacture, depletion of stocks and increased competition for limited supplies [15]. Consequently, supply chains designed to function efficiently under normal conditions failed to withstand disruptions at multiple levels in the supply chain. On the other hand, flexible sourcing, standardization, procurement assistance and collaboration improved the resilience of healthcare supply chains [2].
Additionally, healthcare procurement and inventory management remain highly decentralized. Separate purchasing systems operated independently by hospitals and public entities generally do not allow decision-makers access to real-time information about disruptions to their upstream supply chain partners, regional inventory availability or impending facility level shortages. While agility, redundancy and collaboration were critical factors enabling the response to the pandemic, existing collaborative arrangements with suppliers did not automatically provide visibility across multiple tiers [1].
Shortages experienced during a pandemic are best viewed as both a failure of supply and a failure of coordination. While increasing production and reserve capacity will continue to be important, developing the capability to identify available inventory, identify potential shortages at a local facility level and relocate supplies before the delivery of care is impacted will be equally essential. Since stockpiling alone is ineffective if it does not enable rapid identification of available inventory within a region, preparedness will require a transition from reactive facility level purchasing to coordinated regional inventory management.
2.2 Predictive Demand Forecasting and Regional Coordination
Because historical usage patterns are unreliable bases for making pandemic plans due to the dynamic nature of infection rates, hospital admission volumes, treatment paths, length of stays in hospitals and the utilization of medical products in accordance with evolving treatment guidelines, predictive demand assessments can convert projected volumes of patients admitted to hospitals and clinical services needed to project required quantities of medical products. As an example, Furman et al. [16] demonstrated that admissions to hospitals, treatment paths followed by patients admitted to hospitals and lengths of stay in hospitals could be used to forecast PPE consumption. Due to sensitivity to missing data and changes to clinical practice that occur in anticipation of future events, predictive models developed to forecast demand should be capable of supporting periodic revisions to operating decisions rather than providing definitive projections. Prediction-driven approaches that couple deep-learning forecasts with optimization have also been proposed for collaborative emergency resource allocation [11].
However, predictive models are operationally useful only when they are evaluated against actual inventory positions and available supplies. Therefore, planning at the regional level must assess projected demand against currently held quantities, consumption rates, scheduled deliveries, reserve levels, expiration limits on stored products and transportation capabilities. Through shared visibility, regional planners can determine whether a shortage exists across all regional facilities or whether the perceived shortage exists only at a single facility where there are unused inventories stored elsewhere in the region. To achieve such visibility requires compatible IT platforms; common definitions for data; mutual trust among participating organizations; and mutually agreeable procedures governing access to shared resources.
Visibility at the regional level can facilitate both inventory pooling and transshipment. Inventory pooling involves coordinating either demand or inventory across facilities. Transshipment involves moving products from facilities with excess supplies to those with inadequate supplies. Both practices can reduce uncertainty associated with demand and lead times, however both rely upon communication regarding inventory positions and consumption rates; cooperative behavior; compatible infrastructure; adherence to applicable regulations; and assurance that emergency service standards will be protected [17]. Atcha et al. [18] further indicate that inventory sharing among healthcare providers reduces shortages and costs associated with acquiring products; reduces waste; yet highlights technology based obstacles, social obstacles, financial obstacles and logistical obstacles to effective sharing.
Thus predictive assessments and regional coordination should operate as an ongoing process: predictive assessments identify emerging demands; visibility identifies available inventory and constraints; pooling or transshipment corrects feasible discrepancies. Repeated evaluation allows the network to react as demand evolves over time along with deliveries made available through the supply chain and transportation logistics.
2.3 Multi-Objective and Equitable Inventory Allocation
Allocating scarce medical inventory involves a multi-objective decision-making environment. For instance, while minimizing cost would allow for the opportunity to ignore some shortages, clinical urgency, service continuum issues, population vulnerabilities and reserve needs, regional decisions will have to weigh unmet demand, operational efficiency, logistical feasibility, equity, allocation stability and preparedness. As multi-objective models explicitly state the trade-off for these considerations versus ignoring them through a single efficiency metric. In [19], the authors demonstrated this principle through incorporating equity and deprivation costs along with transportation, shortage and holding costs in the context of pandemic vaccine distribution.
Moreover, equity must be operationalized. Equal quantities do not produce equitable outcomes because facilities differ in patient volume, service role, initial inventory and the populations they serve. Several safeguards can be implemented to promote equitable results, including minimum service-level thresholds, priority based on vulnerability, protection of reserves and restrictions on excessive inventory concentration. A multi-principle approach to allocation is therefore preferred over a single rule such as first-come-first-served or historical use [20].
Procedural justice complements distributive justice in allocating medical supplies. In addition to producing defensible outcomes, the decision-making process should be transparent about the rules applied, apply them consistently, document exceptions and involve human decision-makers. Because public opinion varies about what constitutes a just allocation, decision-makers should justify their allocation choices clearly rather than assume a single agreed standard [21]. An equitable allocation therefore depends on both defensible outcomes and an accountable decision-making process.
2.4 Theoretical Foundations of Predictive Inventory Allocation
Four theoretical perspectives support the development of the predictive inventory allocation framework: systems theory, dynamic capabilities theory, resource dependence theory, and distributive and procedural justice theory. Each contributes specific constructs to the framework; the constructs are summarized below and mapped to propositions in Table 5. First, systems theory [22] represents a regional healthcare network as an open, interconnected system in which shortages, delivery delays and transportation failures can spread beyond individual organizations. Predictive allocation must therefore consider interactions among facilities (i.e., interorganizational feedback loops) and changes in environmental conditions rather than optimize facilities independently. Systems theory contributes the constructs of interdependence and feedback, which the framework operationalizes as regional inventory visibility (C2) and rolling-horizon adaptation (C7).
Second, dynamic capabilities theory provides insight into how regional healthcare networks can transform data into responsive action. According to [23], dynamic capabilities consist of three elements: sensing change, seizing new opportunities related to responding to change, and reconfiguration of resources based on evolving conditions. Sensing change occurs through forecasting emerging shortages; seizing opportunities occurs through multi-objective optimization of response options; and reconfiguration occurs through regional redistribution of existing inventory. Digital transparency alone will not be sufficient if facilities do not possess decision authority, collaborative routine practices and operational capacity to act in response to changing conditions.
The framework thus derives the constructs of sensing, seizing and reconfiguring from dynamic capabilities theory and operationalizes them as detection speed (C1, C2), coordinated decision-making (C3, C4) and redistribution (C5, C6).
Third, resource dependence theory [24] indicates that coordination among healthcare facilities becomes essential when facilities rely on external partners (suppliers, distributors, logistics providers and other healthcare organizations) for critical products. This dependence intensifies during pandemics. Inventory visibility across sites, diversified sourcing and reciprocal transfer agreements can reduce vulnerability compared with localized stockpiling, and empirical evidence from healthcare demonstrates the importance of collaboration, mutual trust, information sharing and supply-use visibility for resilience to pandemics [2], [25]. The framework derives the constructs of dependence and reciprocity from this theory and operationalizes them through inventory pooling (C5), redistribution (C6) and the governance mechanism (G) that manages interorganizational dependence.
Fourth, distributive and procedural justice theory addresses the fairness of both outcomes and decision procedures [20], [26], [27]. Distributive justice is translated into the risk-weighted equity measure and minimum service floors (C4), and procedural justice into transparency, participation, appeal and documented overrides within governance (G). The constructs derived are need-based fairness, voice, transparency and accountability.
Taken together, the four theories explain different links in the framework. Systems theory explains why regional rather than facility-level visibility is required; dynamic capabilities theory explains how visibility becomes timely action; resource dependence theory explains why facilities coordinate and under what conditions; and justice theory explains how scarce resources should be distributed and how decisions acquire legitimacy. Regional resilience is therefore a network-based capability rather than a property of any single facility.
2.5 Literature Synthesis and Interdisciplinary Research Gaps
The literature indicates that pandemic preparedness depends on six factors: supply chain visibility, flexibility in obtaining supplies, demand forecasting, collaboration among facilities, availability of reserve capacity, and the ability to redistribute supplies. Systematic reviews show that these factors are often studied separately, as stand-alone interventions, rather than as parts of an integrated regional decision process [28]. Forecasting studies typically estimate future demand but do not always convert those estimates into coordinated facility-level allocations, although prediction-driven allocation models that do so exist [7], [11]. Many optimization studies, including network design models for pandemics [5], minimize cost or service performance but define equity measures, reserve needs and allocation stability only partially. Many models also examine only one product, organization or time frame, which gives limited guidance for repeated regional coordination. Rolling-horizon methods are increasingly used to improve responsiveness to changing data, yet few studies combine them with network-wide inventory classification, equity constraints and interfacility redistribution.
Closely related work should be acknowledged precisely. In [7], [8], [9], [10] and [11], each combine several of the elements above, for example prediction with allocation, equity with multi-stage stochastic planning, or forecasting with interregional transfers. Table 1 compares them with the framework proposed here. The comparison shows that the individual elements are well established. The study therefore does not claim that they have never been combined; it claims that, among the studies examined, none jointly specifies a regional rolling-horizon cycle, an explicit separation of operational stock, protected reserve and transferable surplus, an equity measure that distinguishes equity from equality, and the governance, incentive and legal conditions for redistribution.
What is distinctive is therefore threefold. Theoretically, the study derives four testable propositions with measurable constructs and moderators from four complementary theories.
Table 1: Comparison of the proposed framework with closely related studies Click to enlarge
| Study | F | U | A | E | R | T | H | G |
|---|---|---|---|---|---|---|---|---|
| [7] | Yes | Partial | Yes | NR | NR | Yes | Yes | NR |
| [8] | Partial | Yes | Yes | Yes | NR | NR | Yes | NR |
| [9] | Yes | Yes | Yes | NR | Partial | Yes | Yes | NR |
| [10] | Partial | Yes | Yes | Partial | Partial | Yes | Yes | Partial |
| [11] | Yes | Partial | Yes | Yes | Partial | Yes | NR | NR |
| Proposed framework | Yes | Yes | Yes | Yes | Yes | Yes | Yes | Yes |
| Study | F | U | A | E | R | T | H | G |
|---|---|---|---|---|---|---|---|---|
| [7] | Yes | Partial | Yes | NR | NR | Yes | Yes | NR |
| [8] | Partial | Yes | Yes | Yes | NR | NR | Yes | NR |
| [9] | Yes | Yes | Yes | NR | Partial | Yes | Yes | NR |
| [10] | Partial | Yes | Yes | Partial | Partial | Yes | Yes | Partial |
| [11] | Yes | Partial | Yes | Yes | Partial | Yes | NR | NR |
| Proposed framework | Yes | Yes | Yes | Yes | Yes | Yes | Yes | Yes |
Note. F = demand forecasting or prediction; U = explicit treatment of demand or supply uncertainty; A = multi-facility or multi-region allocation; E = equity or fairness in allocation; R = explicit protected reserve; T = interfacility or interregional transfers; H = rolling-horizon or multi-period updating; G = governance, human oversight or appeal mechanisms. “Partial” denotes a feature that is present only implicitly or in simplified form. Entries are the author’s indicative reading of each study’s stated scope and are not a systematic coding of the literature.
Methodologically, it specifies a model in which uncertainty enters through a documented buffer rule, redistribution is conditional on transferable surplus, and equity is measured with an explicit minimax criterion. Institutionally, it treats human review, appeal, incentives and legal safeguards as components of the decision architecture rather than as external ethical requirements. The value added is thus not another forecasting or optimization technique but the integration of established techniques into a decision-support architecture that balances efficiency, preparedness, equity and resilience.
3. Proposed Conceptual and Methodological Framework
This section addresses the integrative gap identified in the literature review by developing a regional methodology that transforms projected demand for medical products into coordinated inventory decisions. The methodology links rolling demand forecasting, inventory classification, category-specific shortage assessment, multi-criteria allocation and interfacility redistribution, and it treats pandemic preparedness as an ongoing regional coordination problem rather than a set of separate facility-level problems [7].
This methodology uses a rolling-horizon approach where demand forecasts, inventory levels, risk from shortages, required reserves, and recommended allocations are updated on a predetermined schedule. With this type of approach, decision-makers can include new information into their analyses and adjust to changing clinical demands, supply chain constraints, lead times, transportation availability, and care-priority needs. The use of rolling-horizon planning is therefore suitable for allocating healthcare resources during periods of rapid and unpredictable change [7], [29].
Clinical and management judgments are supported — but not replaced — by this methodology. Shortage reduction, continuity of patient care, protection of reserve stockpiles, logistical cost effectiveness, allocation stability and fairness of distribution are all considered. Each recommendation may be subject to further review based upon authorization — especially when there is missing data, large forecast uncertainties, or ethical considerations are present relative to the distribution decisions being made.
3.1 Framework Architecture and Data Inputs
The framework is administered by a Regional Coordinating Authority (RCA), the operating unit that consolidates facility data, runs the forecasting and optimization models and issues recommendations to participating healthcare facilities. The RCA is accountable to the Regional Steering Committee (RSC), the governing body that sets policy, approves recommendations and resolves disputes (see the governance subsection below). The framework is indexed by the following sets:
\[\mathcal{I = \{}1,\ldots,n_{I}\},\quad\mathcal{K = \{}1,\ldots,n_{K}\},\quad\mathcal{T}_{\tau} = \{\tau + 1,\ldots,\tau + H\}\tag{1}\]
where \(\tau\) is the decision epoch at which a planning cycle is run, \(H\) is the planning horizon, \(i,j\mathcal{\in I}\) index healthcare facilities (\(j\) denotes a transfer recipient), \(k\mathcal{\in K}\) indexes inventory categories and \(t \in \mathcal{T}_{\tau}\) indexes periods. Indexing by facility, category and period allows demand, availability and shortage risk to be assessed for each facility-category-period combination rather than only for the region as a whole. Quantities computed at epoch \(\tau\) carry an implicit superscript \((\tau)\), which is omitted below.
The framework uses five data groups: (i) demand and utilization; (ii) on-hand, inbound, reserved and expiring inventory; (iii) supplier capacity and replenishment conditions; (iv) facility characteristics and the vulnerability of the populations served; and (v) logistics constraints on storage and interfacility transfer. Effective implementation requires standardized definitions, timely data exchange among healthcare providers, public authorities, suppliers and logistics partners [30], and governance and organizational capabilities to integrate technologies into the supply chain [3] so as to improve visibility, integration and disruption detection.
As depicted in Figure 1, inventory is first classified (C2) by clinical criticality, expected shortage severity, substitutability, demand uncertainty and remaining shelf life. These attributes are applied in pre-processing rather than inside the optimization model: items judged clinically interchangeable are aggregated into one inventory category \(k\), units that will expire before the end of the planning horizon are excluded from usable inventory, and criticality and uncertainty determine the criticality weight \(c_{k}\) and the service level \(1 – \alpha_{k}\) used below. Forecasts of demand for each category are then compared with usable inventory and confirmed inbound supply (C1), while reserves held against unexpected surges are treated separately (C5). Multi-objective optimization (C3, C4) generates facility-specific allocation recommendations that account for inventory availability, protected reserves, storage capacity at receiving facilities, and the cost and lead time of interfacility transfers (C6). After feasible transfers are determined, the input data are updated with new on-hand and inbound quantities and the cycle repeats (C7) at the cycle frequency, and until the stopping rule given in Table 3 is met. This cyclical process is a rolling predict-then-optimize approach that connects demand estimates, collaborative allocation of inventory and periodic updating as new information becomes available [7].
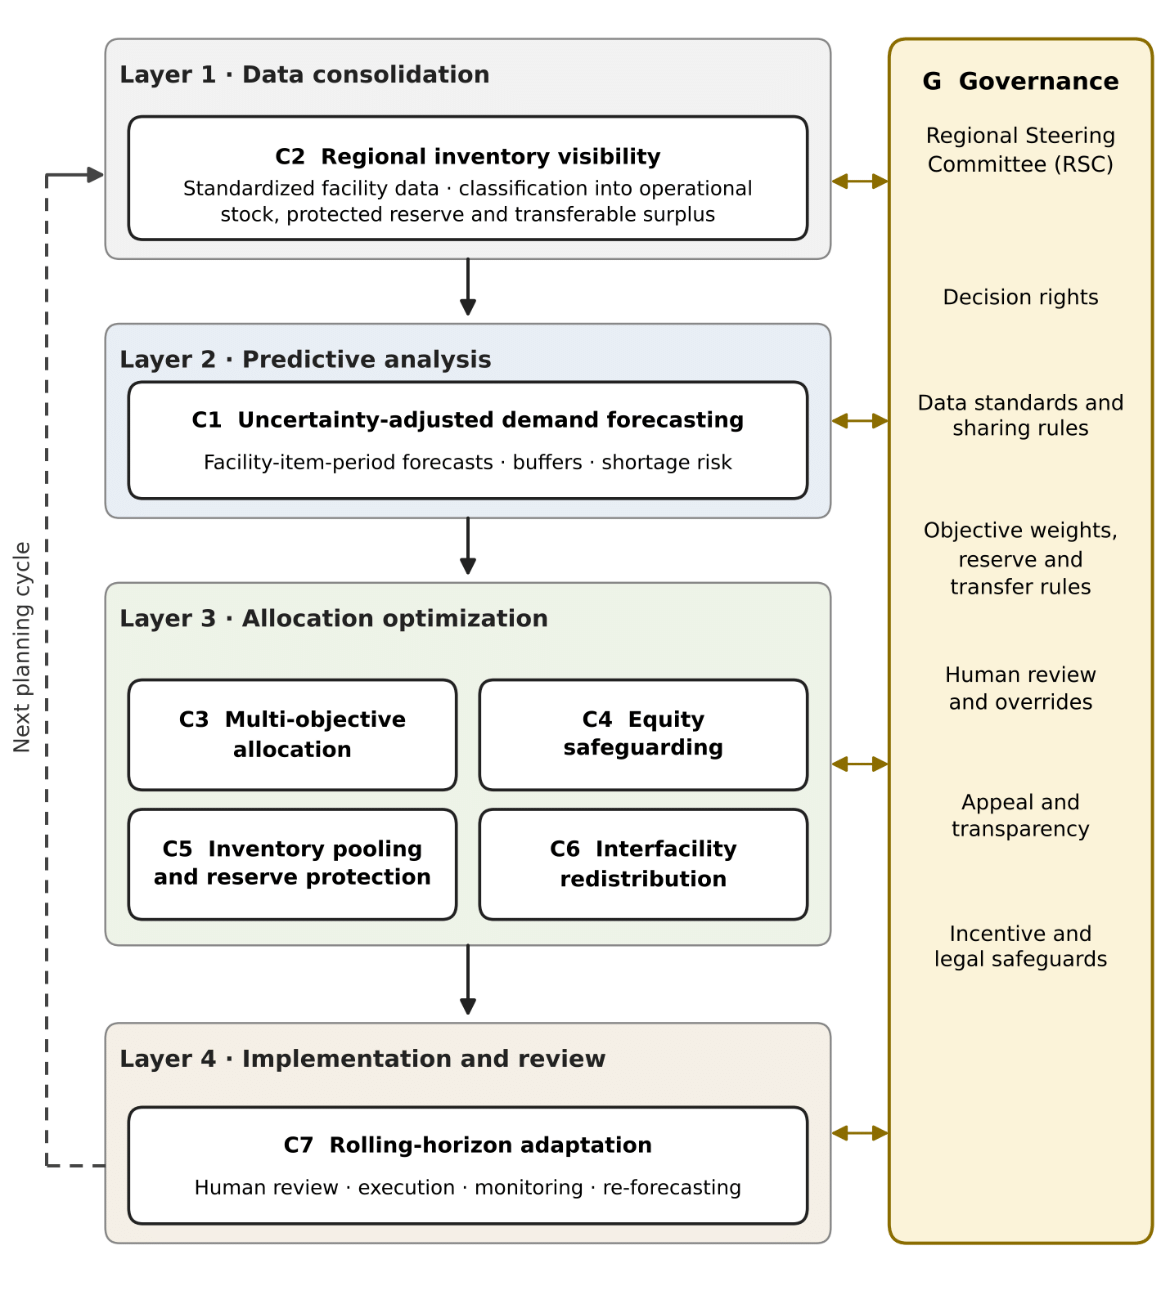
capabilities (C1–C7) in four layers, under one governance mechanism
(G)
3.2 Scope and Boundaries of the Framework
The framework covers durable and semi-durable consumable medical supplies whose demand can be forecast from clinical activity and whose units can be transferred between facilities without special handling, for example N95 respirators, surgical masks, gowns, gloves and other personal protective equipment (PPE), and standard single-use critical care consumables. Temperature-controlled products (vaccines, many biologics and blood products), controlled substances and reusable capital equipment such as ventilators are outside the scope of the present formulation, although the architecture could be extended to them with additional constraints. Shelf life and substitutability are handled in pre-processing, as described above, and are not decision variables. Table 2 distinguishes decisions that fall inside the framework from dependencies that enter only as exogenous inputs or are excluded.
Table 2: Scope of the framework: decisions inside and outside the boundary Click to enlarge
| Domain | Inside the framework boundary | Outside the boundary (exogenous input or excluded) |
|---|---|---|
| Inventory | Classification into operational stock, protected reserve and transferable surplus; reserve levels; allocation of regional supply to facilities | Production capacity, national stockpile policy, pricing and procurement strategy |
| Demand | Facility-level forecasts of covered items and their uncertainty | Epidemiological modeling of disease spread (an input signal); clinical treatment protocols |
| Transfers | Interfacility inventory transfers: eligibility, quantity, recipient priority and timing | Patient transfers and diversion; staffing and bed capacity; vehicle routing (transport enters as capacity, lead time and cost parameters) |
| Suppliers | Use of confirmed inbound supply and supplier reliability information in buffers | Supplier selection, contracting and upstream capacity expansion |
| Governance | Decision rights, review, override, appeal and audit of allocation and transfer recommendations | Legislation, emergency declarations and payment policy (treated as constraints) |
| Domain | Inside the framework boundary | Outside the boundary (exogenous input or excluded) |
|---|---|---|
| Inventory | Classification into operational stock, protected reserve and transferable surplus; reserve levels; allocation of regional supply to facilities | Production capacity, national stockpile policy, pricing and procurement strategy |
| Demand | Facility-level forecasts of covered items and their uncertainty | Epidemiological modeling of disease spread (an input signal); clinical treatment protocols |
| Transfers | Interfacility inventory transfers: eligibility, quantity, recipient priority and timing | Patient transfers and diversion; staffing and bed capacity; vehicle routing (transport enters as capacity, lead time and cost parameters) |
| Suppliers | Use of confirmed inbound supply and supplier reliability information in buffers | Supplier selection, contracting and upstream capacity expansion |
| Governance | Decision rights, review, override, appeal and audit of allocation and transfer recommendations | Legislation, emergency declarations and payment policy (treated as constraints) |
3.3 Predictive Demand Forecasting and Rolling-Horizon Updates
At decision epoch \(\tau\), the forecast demand for inventory category \(k\) at facility \(i\) in future period \(t\) is
\[{\widehat{D}}_{ikt} = f_{k}\left( X_{i,1:\tau};\,\Theta_{k} \right),\quad t = \tau + 1,\ldots,\tau + H\tag{2}\]
where \(X_{i,1:\tau}\) denotes all information on facility \(i\) available up to epoch \(\tau\), \(\Theta_{k}\) denotes the current parameter estimates of the forecasting model and \(H\) is the forecast horizon. Inputs may include historical and current utilization rates, patient volume, clinical indicators of disease severity, seasonal factors and potential disruptions to the healthcare system. Because \(f_{k}( \cdot )\) can be a statistical, epidemiologic or machine-learning model, the framework is forecasting-model-agnostic.
In addition to a point estimate of expected demand, the framework provides a basis for integrating predictive and prescriptive analytics in pandemic resource planning and allocation [9].
Because future demand is uncertain, each forecast should be accompanied by a measure of its uncertainty, such as a prediction interval, a set of probabilistic scenarios or the empirical forecast error. We denote by \(\sigma_{ikt}\) the standard deviation of the forecast error of cumulative demand through period \(t\). Uncertainty then enters the planning problem in two distinct ways: through a planning buffer that raises the requirement, and through a protected reserve that is physically held out of circulation. The buffer is
\[B_{ikt} = z_{1 – \alpha_{k}}\,\sigma_{ikt}\tag{3}\]
where \(z_{1 – \alpha_{k}}\) is the standard normal quantile for the target service level \(1 – \alpha_{k}\) of category \(k\), chosen by clinical criticality (Table 3). Equation (3) is the deterministic equivalent of the chance constraint that cumulative demand does not exceed planned availability with probability at least \(1 – \alpha_{k}\) when forecast errors are approximately normal. The protected reserve is
\[L_{ik} = \omega_{k}\,\mathcal{l}_{ik}\,{\bar{d}}_{ik}\tag{4}\]
where \(\mathcal{l}_{ik}\) is the replenishment lead time (in days) of category \(k\) at facility \(i\), \({\bar{d}}_{ik}\) is the average forecast daily demand over the horizon and \(\omega_{k} \geq 0\) is a criticality multiplier, so that \(\omega_{k}\mathcal{l}_{ik}\) is the number of days of demand held in reserve. Usable on-hand inventory excludes the reserve:
\[A_{ik} = \left\lbrack O_{ik} – L_{ik} \right\rbrack^{+}\tag{5}\]
where \(O_{ik}\) is on-hand inventory that will not expire within the horizon and \(\lbrack x\rbrack^{+} = max\{ 0,x\}\). The risk-adjusted net requirement of facility \(i\) for category \(k\) through period \(t\) is
\[R_{ikt} = \left\lbrack \sum_{s = \tau + 1}^{t}{\widehat{D}}_{iks} + B_{ikt} – A_{ik} – \sum_{s = \tau + 1}^{t}Q_{iks} \right\rbrack^{+}\tag{6}\]
where \(Q_{iks}\) is the confirmed inbound supply expected in period \(s\) before the demand it serves. A facility with \(R_{ikt} > 0\) generates a shortage alert. The transferable surplus of a facility, which is the quantity it could release without breaching its forecast demand or buffer over the horizon, is
\[\Gamma_{ik} = \left\lbrack A_{ik} + \sum_{s \in \mathcal{T}_{\tau}}^{}Q_{iks} – \sum_{s \in \mathcal{T}_{\tau}}^{}{\widehat{D}}_{iks} – B_{ik,\tau + H} \right\rbrack^{+}\tag{7}\]
The buffer \(B\) and the protected reserve \(L\) are different instruments. \(B\) is a planning quantity, not a physical stock: it raises the requirement \(R\) and lowers the transferable surplus \(\Gamma\) to hedge uncertainty in demand within the horizon. \(L\) is physical inventory that is removed from usable stock (5), is unavailable for allocation or transfer, covers surge and lead-time risk beyond the horizon, and is released only when the Regional Steering Committee declares a trigger event. The two are not double counted: the reserve reduces \(A\), whereas the buffer raises \(R\) and lowers \(\Gamma\).
Scenario-based approaches represent uncertainty particularly well when both the progression of disease incidence and hospitalizations and the resource needs of patients are highly uncertain [31]. The buffer rule in Equation (3) is therefore a deliberate simplification. It is transparent to reviewers, keeps the allocation model linear and is the deterministic equivalent of an individual chance constraint, but it treats facilities independently, ignores correlation among forecast errors across the region and does not model recourse decisions. Scenario-based multi-stage stochastic programming [8], [31], robust formulations and regional chance constraints are natural extensions. For this reason the framework is described as uncertainty-adjusted rather than fully stochastic.
Each time inventory levels, shipment confirmations, observed demand, and transportation status are updated, near-term decisions are executed and subsequent predictions and recommendations are generated after revising the forecasts over a shifted horizon. In general, this rolling-horizon approach results in reduced reliance on out-of-date forecasts and enables adaptive allocation under high degrees of uncertainty [29].
3.4 Rolling-Horizon Operating Parameters
Table 3 specifies the operating parameters of the rolling-horizon cycle, including the cycle frequency, planning horizon, transfer thresholds and stopping rule. The values are illustrative defaults for planning purposes and should be calibrated by the Regional Steering Committee to the item, the disease dynamics and the logistics of the network.
Table 3: Rolling-horizon operating parameters (illustrative defaults to be calibrated by the Regional Steering Committee) Click to enlarge
| Parameter | Illustrative default | Rule or rationale |
|---|---|---|
| Cycle frequency \(\Delta\) | Daily during a surge; every 3 days in monitoring | At least as frequent as data reporting and as the fastest change in demand or deliveries |
| Planning horizon \(H\) | 14 days | \(H\) at least the longest replenishment lead time plus transfer time; only first-period decisions are executed and later periods are provisional |
| Service level \(1 – \alpha_{k}\) | 0.95 critical; 0.90 important; 0.80 standard | Set by clinical tier; determines the buffer \(B\) (3) |
| Reserve cover \(\omega_{k}\mathcal{l}_{ik}\) | 2–3 days of average forecast demand for critical items | Covers lead-time and surge risk beyond the horizon; released only on an RSC-declared trigger |
| Shortage trigger | \(R_{ikt}\) of at least 3 days of average forecast demand | Starts allocation and transfer review |
| Transfer trigger and minimum lot | \(\Gamma_{ik}\) of at least 1 day of recipient demand or one pack or pallet, whichever is larger | Avoids unstable, low-value transfers |
| Net-benefit test | Execute only if the weighted reduction in unmet demand exceeds the weighted transfer cost and the donor remains at or above its buffer | Prevents transfers that merely shift risk |
| Stopping rule | \(R_{ikt} = 0\) for all \(i,k,t\) in \(m = 3\) consecutive cycles and the RSC declares stand-down | Reserves revert to the baseline policy; monitoring continues at lower frequency |
| Parameter | Illustrative default | Rule or rationale |
|---|---|---|
| Cycle frequency \(\Delta\) | Daily during a surge; every 3 days in monitoring | At least as frequent as data reporting and as the fastest change in demand or deliveries |
| Planning horizon \(H\) | 14 days | \(H\) at least the longest replenishment lead time plus transfer time; only first-period decisions are executed and later periods are provisional |
| Service level \(1 – \alpha_{k}\) | 0.95 critical; 0.90 important; 0.80 standard | Set by clinical tier; determines the buffer \(B\) (3) |
| Reserve cover \(\omega_{k}\mathcal{l}_{ik}\) | 2–3 days of average forecast demand for critical items | Covers lead-time and surge risk beyond the horizon; released only on an RSC-declared trigger |
| Shortage trigger | \(R_{ikt}\) of at least 3 days of average forecast demand | Starts allocation and transfer review |
| Transfer trigger and minimum lot | \(\Gamma_{ik}\) of at least 1 day of recipient demand or one pack or pallet, whichever is larger | Avoids unstable, low-value transfers |
| Net-benefit test | Execute only if the weighted reduction in unmet demand exceeds the weighted transfer cost and the donor remains at or above its buffer | Prevents transfers that merely shift risk |
| Stopping rule | \(R_{ikt} = 0\) for all \(i,k,t\) in \(m = 3\) consecutive cycles and the RSC declares stand-down | Reserves revert to the baseline policy; monitoring continues at lower frequency |
3.5 Multi-Objective Allocation and Regional Redistribution
The allocation model translates the risk-adjusted requirements into facility- and category-specific decisions for each period of the horizon. The decision variables are: \(x_{ikt} \geq 0\), the quantity of category \(k\) allocated to facility \(i\) from regional supply in period \(t\); \(y_{ijkt} \geq 0\), the quantity of category \(k\) transferred from donor facility \(i\) to recipient facility \(j \neq i\) in period \(t\), defined only on the set \(\mathcal{A}\) of feasible transfer arcs \((i,j)\) (those whose transport time does not exceed one period); \(u_{ikt} \geq 0\), unmet demand; and \(H_{ikt}\), planned ending inventory. Models that support multiple objectives, such as cost, timeliness, reliability, urgency and equity, can balance these objectives instead of optimizing a single one [8], [32].
The framework minimizes a weighted sum of four normalized components:
\[\min\ Z = w_{U}\widetilde{U} + w_{E}\widetilde{E} + w_{C}\widetilde{C} + w_{S}\widetilde{S},\quad\quad w_{U} + w_{E} + w_{C} + w_{S} = 1,\ w \geq 0\tag{8}\]
where \(\widetilde{U}\), \(\widetilde{E}\), \(\widetilde{C}\) and \(\widetilde{S}\) are, respectively, risk-weighted unmet demand, inequity in need satisfaction, logistics cost and instability between allocation cycles. Each is normalized to the interval \(\lbrack 0,1\rbrack\) and is dimensionless, so that the weights can be read as relative priorities. Risk-weighted unmet demand is
\[\widetilde{U} = \frac{\sum_{k}^{}{\sum_{t}^{}{\sum_{i}^{}\rho_{ik}}}\, u_{ikt}}{\sum_{k}^{}{\sum_{t}^{}{\sum_{i}^{}\rho_{ik}}}\,{\widehat{D}}_{ikt}}\tag{9}\]
where \(\rho_{ik} = c_{k}\left( 1 + \eta v_{i} \right)\) is the risk weight of facility \(i\) for category \(k\). Here \(c_{k} \geq 1\) is the criticality weight of category \(k\), assigned by clinical tier (for example 1, 1.5 and 2 for standard, important and critical items); \(v_{i} \in \lbrack 0,1\rbrack\) is a composite vulnerability index of facility \(i\), computed as the weighted mean of normalized indicators such as the share of high-risk or underserved patients in the catchment area, a social vulnerability index of the catchment area, remoteness from alternative sources of supply and dependence on a single supplier, with indicator weights set by the Regional Steering Committee through a structured elicitation such as a Delphi exercise; and \(\eta \geq 0\) controls how strongly vulnerability shifts priority (\(\eta = 0\) ignores vulnerability). Inequity is measured by the risk-weighted shortfall rate of the worst-off facility:
\[\widetilde{E} = \frac{1}{\left| \mathcal{K} \right|\,\left| \mathcal{T}_{\tau} \right|\,\rho_{\max}}\sum_{k}^{}{\sum_{t}^{}e_{kt}}\tag{10}\]
where \(e_{kt}\) is the maximum over facilities of \(\rho_{ik}u_{ikt}/{\widehat{D}}_{ikt}\) (enforced by (19)) and \(\rho_{\max} = \max_{i,k}\rho_{ik}\) normalizes \(\widetilde{E}\). Three allocation principles can be distinguished. Equality allocates identical quantities to every facility regardless of size. Proportionality allocates in proportion to forecast demand, which equalizes fill rates \(1 – u_{ikt}/{\widehat{D}}_{ikt}\) across facilities. Equity, as used here, equalizes risk-weighted shortfall rates, so facilities with higher criticality or vulnerability (larger \(\rho_{ik}\)) receive higher fill rates. Setting \(\rho_{ik} = 1\) reduces the equity term to proportional fairness, and equal quantities are not a target of the model because they ignore demand. Equation (10) uses the worst-off facility (a minimax, or Rawlsian, criterion) rather than a range or variance, because dispersion measures can be reduced simply by lowering the fill rate of the best-off facility (“leveling down”), whereas the minimax measure never rewards withholding supply. Logistics cost is:
\[\widetilde{C} = \frac{1}{C^{ref}}\sum_{k}^{}{\sum_{t}^{}\left( \sum_{i}^{}\kappa_{ik}^{A}\, x_{ikt} + \sum_{(i,j)\mathcal{\in A}}^{}\kappa_{ijk}^{T}\, y_{ijkt} \right)}\tag{11}\]
where \(\kappa_{ik}^{A}\) is the unit cost of delivering regional supply to facility \(i\), \(\kappa_{ijk}^{T}\) is the unit cost of transferring category \(k\) from \(i\) to \(j\) (reflecting distance, transport capacity and handling), and the reference cost, which is the cost of the most expensive feasible plan, is:
\[C^{ref} = \sum_{k}^{}{\sum_{t}^{}G_{kt}}\max_{i}\kappa_{ik}^{A} + \sum_{k}^{}{\sum_{i}^{}\Gamma_{ik}}\max_{j}\kappa_{ijk}^{T}\tag{12}\]
with \(G_{kt}\) the regional supply defined below. Allocation instability is:
\[\widetilde{S} = \frac{\sum_{k}^{}{\sum_{t}^{}{\sum_{i}^{}\left| x_{ikt} – {\bar{x}}_{ikt} \right|}}}{2\sum_{k}^{}{\sum_{t}^{}G_{kt}}}\tag{13}\]
where \({\bar{x}}_{ikt}\) is the allocation issued in the previous cycle for the same calendar period. \(\widetilde{S}\) penalizes plan changes that are not justified by new information and is set to zero (\(w_{S} = 0\)) in the first cycle, when no earlier plan exists; the absolute values are linearized with auxiliary variables.
Weighting procedure. The weights are not estimated from data; they are elicited from stakeholders by the Regional Steering Committee, for example through swing weighting or the analytic hierarchy process with clinical, procurement, public health, ethics and community representatives, and they are published with the allocation rationale and approved before activation. Because outcomes can be sensitive to the weights, every cycle should report the allocation under the approved weights together with at least two alternative weight sets, or a sweep of the weight simplex, so that reviewers can see which decisions are robust (see the numerical example). Where members disagree about weights or vulnerability indicators, the Regional Steering Committee applies a decision rule agreed beforehand (for example a supermajority vote after inspecting the sensitivity report), with allocation proportional to risk-weighted demand as the fallback; unresolved disputes go to the appeal process described below.
The objective is minimized subject to the following constraints for all \(i\mathcal{\in I}\), \(k\mathcal{\in K}\) and \(t \in \mathcal{T}_{\tau}\). Continuity of inventory is maintained through:
\[H_{ikt} = H_{ik,t – 1} + Q_{ikt} + x_{ikt} + \sum_{j:(j,i)\mathcal{\in A}}^{}y_{jikt} – \sum_{j:(i,j)\mathcal{\in A}}^{}y_{ijkt} – {\widehat{D}}_{ikt} + u_{ikt}\tag{14}\]
where \(H_{ik,\tau} = A_{ik}\) is the usable on-hand inventory at the start of the horizon. Unmet demand enters the balance because it is demand that is not withdrawn from available stock. The remaining constraints are:
\[\sum_{i}^{}x_{ikt} \leq G_{kt}\tag{15}\]
\[0 \leq H_{ikt} \leq M_{ik}\tag{16}\]
\[0 \leq u_{ikt} \leq {\widehat{D}}_{ikt}\tag{17}\]
\[\sum_{t \in \mathcal{T}_{\tau}}^{}\ \sum_{j:(i,j)\mathcal{\in A}}^{}y_{ijkt} \leq \Gamma_{ik}\tag{18}\]
\[\frac{\rho_{ik}\, u_{ikt}}{{\widehat{D}}_{ikt}} \leq e_{kt}\tag{19}\]
\[u_{ikt} \leq \left( 1 – \phi_{k} \right)\,{\widehat{D}}_{ikt},\quad\quad k \in \mathcal{K}^{crit}\tag{20}\]
Equation (15) limits allocation to regional supply \(G_{kt}\), the quantity of category \(k\) that the Regional Coordinating Authority can allocate in period \(t\) (uncommitted supplier deliveries contracted at the regional level plus releases from any regional reserve); it excludes facility-held stock and each facility’s confirmed inbound supply \(Q\), which are already assigned to specific facilities. Equation (16) respects storage capacity \(M_{ik}\), and (17) prevents unmet demand from exceeding demand. Equation (18) is the donor-protection rule: a redistribution is permitted only if the donor’s usable inventory, confirmed replenishment and regional allocation exceed its forecast demand and buffer, and total outbound transfers cannot exceed the transferable surplus, so that shortages are not moved from one facility to another. Because \(\Gamma\) is net of the buffer and, through \(A\), of the protected reserve, a donor that releases its full surplus still holds its buffer, which under the normality assumption keeps its stockout probability over the horizon at about \(\alpha_{k}\). Equation (19) defines the worst-off shortfall rate used in (10). Equation (20) is an optional minimum service floor \(1 – \phi_{k}\) for the set of critical categories \(\mathcal{K}^{crit}\), set by the Regional Steering Committee; if the floor is infeasible given regional supply, it is relaxed to the maximum feasible level and the relaxation is reported. All decision variables (\(x\), \(y\), \(u\), \(e\)) are non-negative.
Recipient priority follows from the objective: shortage severity (\(R\)), clinical criticality and vulnerability (\(\rho\)), transfer feasibility (the arc set \(\mathcal{A}\)) and expected delivery time and cost (\(\kappa^{T}\)) all enter the model through its parameters. The resulting problem is a linear program, so it can be solved quickly in every cycle. These principles are consistent with research emphasizing fairness, timeliness and coordinated resource sharing during public health emergencies [7], [33].
Table 4(a): Framework capabilities, operational layers, principal inputs, decision functions, primary outputs and linked propositions. Click to enlarge
| Capability | Layer | Principal inputs | Decision function | Primary output | Proposition |
|---|---|---|---|---|---|
| C1 Uncertainty-adjusted demand forecasting (incl. shortage-risk assessment) | 2 | Utilization, patient volume, clinical indicators, forecast error | Estimate facility-item-period demand, buffer and requirement \(R\) | Forecast, \(\sigma\), buffer \(B\), shortage alert | P1 |
| C2 Regional inventory visibility (incl. inventory classification) | 1 | On-hand, inbound, expiring and reserved stock; criticality, substitutability, shelf life | Consolidate data; classify stock as operational stock, protected reserve or transferable surplus | Regional inventory view; priority class | P1, P2 |
| C3 Multi-objective allocation | 3 | Regional supply \(G\), requirements, costs, weights | Balance unmet demand, inequity, cost and stability | Facility-specific allocation plan \(x\) | P3 |
| C4 Equity safeguarding | 3 | Vulnerability index, criticality, shortage severity | Risk-weight needs; minimize worst-off shortfall; apply service floors | Equity indicator \(\widetilde{E}\); risk-weighted fill rates | P3 |
| C5 Inventory pooling and reserve protection | 3 | Forecasts, lead times, uncertainty, criticality | Set protected reserve \(L\); define transferable surplus \(\Gamma\) | Reserve levels; \(\Gamma\) | P4 |
| C6 Interfacility redistribution | 3 | \(\Gamma\), urgency, distance, transport capacity | Match feasible donors and recipients under thresholds | Interfacility transfer plan \(y\) | P2, P4 |
| C7 Rolling-horizon adaptation | 4 | Actual demand, deliveries, inventory balances | Revise forecasts and decisions each cycle; apply stopping rule | Updated recommendations and indicators | P1–P4 |
| G Governance | All | Decision rights, data standards, weights | Approve, override, appeal, audit; incentive and legal safeguards | Approved plan; audit trail | P2, P3 |
| Capability | Layer | Principal inputs | Decision function | Primary output | Proposition |
|---|---|---|---|---|---|
| C1 Uncertainty-adjusted demand forecasting (incl. shortage-risk assessment) | 2 | Utilization, patient volume, clinical indicators, forecast error | Estimate facility-item-period demand, buffer and requirement \(R\) | Forecast, \(\sigma\), buffer \(B\), shortage alert | P1 |
| C2 Regional inventory visibility (incl. inventory classification) | 1 | On-hand, inbound, expiring and reserved stock; criticality, substitutability, shelf life | Consolidate data; classify stock as operational stock, protected reserve or transferable surplus | Regional inventory view; priority class | P1, P2 |
| C3 Multi-objective allocation | 3 | Regional supply \(G\), requirements, costs, weights | Balance unmet demand, inequity, cost and stability | Facility-specific allocation plan \(x\) | P3 |
| C4 Equity safeguarding | 3 | Vulnerability index, criticality, shortage severity | Risk-weight needs; minimize worst-off shortfall; apply service floors | Equity indicator \(\widetilde{E}\); risk-weighted fill rates | P3 |
| C5 Inventory pooling and reserve protection | 3 | Forecasts, lead times, uncertainty, criticality | Set protected reserve \(L\); define transferable surplus \(\Gamma\) | Reserve levels; \(\Gamma\) | P4 |
| C6 Interfacility redistribution | 3 | \(\Gamma\), urgency, distance, transport capacity | Match feasible donors and recipients under thresholds | Interfacility transfer plan \(y\) | P2, P4 |
| C7 Rolling-horizon adaptation | 4 | Actual demand, deliveries, inventory balances | Revise forecasts and decisions each cycle; apply stopping rule | Updated recommendations and indicators | P1–P4 |
| G Governance | All | Decision rights, data standards, weights | Approve, override, appeal, audit; incentive and legal safeguards | Approved plan; audit trail | P2, P3 |
Table 4(b): Operational components of the predictive inventory allocation framework: Principal inputs, decision functions and primary outputs. Click to enlarge
| Framework component | Principal inputs | Decision function | Primary output |
|---|---|---|---|
| Inventory classification | Criticality, scarcity, substitutability, shelf life | Establish differentiated priorities | Inventory priority class |
| Demand forecasting | Utilization, patient volume, clinical indicators | Estimate facility-item-period demand | Forecast demand and uncertainty |
| Shortage-risk assessment | Forecast demand, available inventory, replenishment, buffer | Identify projected deficits and surpluses | Risk score and shortage alert |
| Multi-objective allocation | Regional supply, clinical priority, vulnerability, costs | Balance shortage, equity, continuity, and efficiency | Facility-specific allocation plan |
| Regional redistribution | Transferable surplus, urgency, distance, transport capacity | Match feasible donors and recipients | Interfacility transfer plan |
| Rolling-horizon monitoring | Actual demand, deliveries, inventory balances | Revise forecasts and decisions | Updated recommendations and indicators |
| Framework component | Principal inputs | Decision function | Primary output |
|---|---|---|---|
| Inventory classification | Criticality, scarcity, substitutability, shelf life | Establish differentiated priorities | Inventory priority class |
| Demand forecasting | Utilization, patient volume, clinical indicators | Estimate facility-item-period demand | Forecast demand and uncertainty |
| Shortage-risk assessment | Forecast demand, available inventory, replenishment, buffer | Identify projected deficits and surpluses | Risk score and shortage alert |
| Multi-objective allocation | Regional supply, clinical priority, vulnerability, costs | Balance shortage, equity, continuity, and efficiency | Facility-specific allocation plan |
| Regional redistribution | Transferable surplus, urgency, distance, transport capacity | Match feasible donors and recipients | Interfacility transfer plan |
| Rolling-horizon monitoring | Actual demand, deliveries, inventory balances | Revise forecasts and decisions | Updated recommendations and indicators |
3.6 Governance and Implementation Requirements
Governance (G) is the institutional mechanism that links the seven capabilities, and two bodies are distinguished. The Regional Steering Committee (RSC) is the governing body: a multidisciplinary group drawn from public health, clinical practice, procurement and sourcing, supply chain, information technology and ethics, together with representatives of the facilities and communities served. It defines each member’s decision authority and the standard data-reporting requirements; sets the objective weights, reserve rules and transfer thresholds; approves or overrides recommendations; resolves disputes; and establishes escalation routes and formal oversight [34]. The Regional Coordinating Authority (RCA) is the operating unit: a small analytic and logistics secretariat that reports to the RSC, maintains the data platform, runs the models and issues recommendations, but has no authority to approve allocations on its own. Pre-defined authority structures, coordination processes, surveillance capabilities, logistical support and communication protocols are also reported as requirements for effective responses to public health crises [35].
All participating facilities must use standardized terms for demand, usable inventory, protected reserve, shortage and confirmed replenishment. Data-sharing agreements must specify rights and obligations regarding ownership, access, permitted uses, retention and responsibility for accuracy, together with standards for reporting frequency, formats and the handling of missing, delayed or inconsistent reports. Security measures such as role-based access control, encryption, multi-factor authentication, audit logs, incident response and recovery planning, and vulnerability assessments should also be included [36]. COVID-19 experience shows that reliable long-term functioning of a healthcare system requires both robust data infrastructure and mechanisms for translating emerging evidence into decisions [37].
Regardless of the degree of automation, every recommendation should pass through authorized human review. Reviewers should receive the principal model assumptions, the uncertainty estimates attached to them, the objective weights, any binding constraints, the intended use of the output and its known limitations [38]. Overrides are permitted in exceptional circumstances; each must be documented with who granted it, why, its effect on allocation and the subsequent outcome. Documentation of exceptions maintains accountability and builds knowledge for later cycles. Analytics in healthcare should also incorporate fairness, privacy, safety, transparency, explainability, accountability, and continued monitoring and evaluation throughout their life cycle [39]. Successful implementation depends on clear roles and responsibilities, workflows integrated across disciplines and departments, multidisciplinary participation, trust among users and an environment that supports continuous learning [40], [41]. The governance literature cited here originates mainly in clinical artificial intelligence. It is used by analogy and not as evidence of supply chain performance: the forecasting and optimization components of the framework are algorithmic decision-support tools deployed inside healthcare organizations, and their outputs affect patient care indirectly through the availability of critical supplies, so documented requirements for transparency, human review, workflow integration and accountability plausibly transfer to this setting. Empirical evidence on the governance of supply-allocation tools specifically remains limited.
3.6.1 Participation, Appeal and Bias Control
Procedural justice requires more than transparency, so governance includes three further safeguards. First, participation: facilities that depend on the pool, including small, rural and safety-net hospitals, and representatives of the communities they serve hold seats or advisory rights on the RSC and take part in setting the vulnerability indicators and objective weights. Second, an appeal mechanism: each facility receives the allocation rationale (inputs, uncertainty, weights and binding constraints) for every cycle and may contest a recommendation within a short, pre-defined window (for example 12 hours during a surge). Contested decisions are reviewed by a panel independent of the RCA, and the decision, its reasons and any change to the rules are logged and shared with members, following the publicity, relevance, appeals and enforcement conditions of accountability for reasonableness [27]. Third, bias control for data-poor facilities: forecasts for facilities with short or noisy histories can be systematically biased, which would translate into systematically lower priority. The RCA therefore borrows strength from comparable facilities through hierarchical or partially pooled forecasts, applies wider buffers to facilities with high measured forecast error instead of discounting their requests, audits forecast bias by facility type in every cycle, and applies the minimum service floor for critical categories (20). The efficiency–equity trade-off is made explicit by reporting the allocation under alternative weights, as illustrated in the numerical example.
3.6.2 Incentives, Legal Feasibility and Relation to Existing Mechanisms
Feasibility also depends on incentives and legal conditions that the optimization model takes as given. Strategic misreporting and hoarding. Facilities may overstate demand, understate inventory or order ahead of need when they expect rationing, a pattern documented in supply chains that ration in proportion to orders [42], [43]. The framework limits this incentive in four ways: allocations are driven by RCA-computed forecasts and verified inventory (from purchasing, enterprise resource planning and consumption records) rather than by self-reported requests; protected reserves are reported and audited, so that hoarding is visible; discrepancies between forecast and observed use are tracked, and repeated misreporting lowers priority in later cycles; and the buffer and reserve rules apply equally to all participants. Free-riding. A facility could under-invest in its own reserves and rely on the pool, so participation is conditional on holding the minimum protected reserve, and priority in the transfer queue can be linked to past contributions of transferable surplus.
Donor compensation. Donors should not bear the cost of supporting others. Options include replacement in kind within an agreed period, reimbursement at replacement cost plus handling and transport, or credit in a ledger administered by the RCA and financed by participants or public emergency funds. Legal and regulatory barriers. Transfers raise questions of product liability and chain of custody, product quality and authorization status (for example, products used under emergency authorization), antitrust or competition law when competing hospitals share inventory and cost information, and privacy and data-protection law. Mitigations include written transfer and data-sharing agreements that allocate liability, lot-level traceability and inspection on receipt, restriction of shared data to facility-level inventory and demand aggregates (no patient-level data), firewalls and legal review for commercially sensitive information, and reliance on emergency-period guidance where available. Because these rules vary by jurisdiction, counsel review is a precondition for activation and not a modeling parameter.
Comparison with existing mechanisms. Healthcare coalitions and mutual-aid agreements already provide part of the institutional ground on which the framework could be built: they offer standing relationships, agreed legal terms for lending and borrowing, and a forum for information sharing. They are, however, generally request-driven and reactive: resources move after a facility asks, allocation rules are rarely quantitative, and there is typically no forecast-based trigger, no standardized classification of reserve and surplus, and no explicit equity measure. The framework is therefore best viewed as a decision-support layer that can operate inside an existing coalition and its mutual-aid agreements, adding predictive triggers, protected reserves, transparent allocation rules and a measurable equity objective. Whether it improves on coalition practice is an empirical question for the second and third phases of the validation strategy.
4. Operationalization of the Predictive Inventory Allocation Framework
The preceding section specified the variables, decision logic, governance requirements and architecture of the framework. This section explains how these elements operate together as a regional decision-making process. Each participating hospital is treated as part of an interrelated system in which hospitals are both dependent on and independent of one another. Each hospital’s demand for items such as PPE, its usable inventory, protected reserve, clinical priorities, vulnerabilities and capacity to accept transfers are therefore evaluated jointly. A regional view allows shortages at high-demand facilities to be addressed with available supplies elsewhere in the system.
An operational model uses real-time demand data, current inventory levels, planned restocking and logistics data to generate recommendations regarding item allocation, reserve retention, and redistributing unused resources among the various participating facilities. Recommendations will be made based upon a multiple objective decision-making strategy that considers trade-offs between the risk of shortages occurring, equity in distribution, practicality of logistics, costs associated with generating these recommendations, protecting existing reserve stocks, and maintaining consistency in resource allocations across time. Integration is critical because pandemic preparedness requires coordinated and simultaneous strategic, tactical and operational decisions when dealing with uncertain conditions [44] and it prevents the use of singular decision rules that ignore important social values and do not provide equitable treatment to populations who may require special consideration [45].
4.1 Integrated Decision Architecture
The framework functions as a four-layer system in an ongoing rolling-horizon cycle (Figure 2). The seven capabilities map to the layers as shown in Figure 1 and Table 4.
Layer 1 – data consolidation (C2). Facility-level data on inventory levels, demand, reserves, replenishment, transportation and facility vulnerability are combined into a region-wide view. Digital technology can enhance this view when it is supported by organizational resilience capabilities [46].
Layer 2 – predictive analysis (C1). Previous usage patterns and the current operating environment determine the predicted demand of each facility, the uncertainty of the prediction and the associated stockout risk. These estimates are updated as new operational data arrive.
Layer 3 – allocation optimization (C3–C6). Based on forecasts and existing inventory levels, this layer converts requirements into recommended allocations, reserves for future needs and redistribution to meet shortages, while considering logistics cost, cost of goods, instability and fairness among facilities. This multifaceted approach resembles healthcare network models that address inventory, allocation, distribution, resilience and uncertainty simultaneously [47]. Recommendations remain subject to approval before implementation.
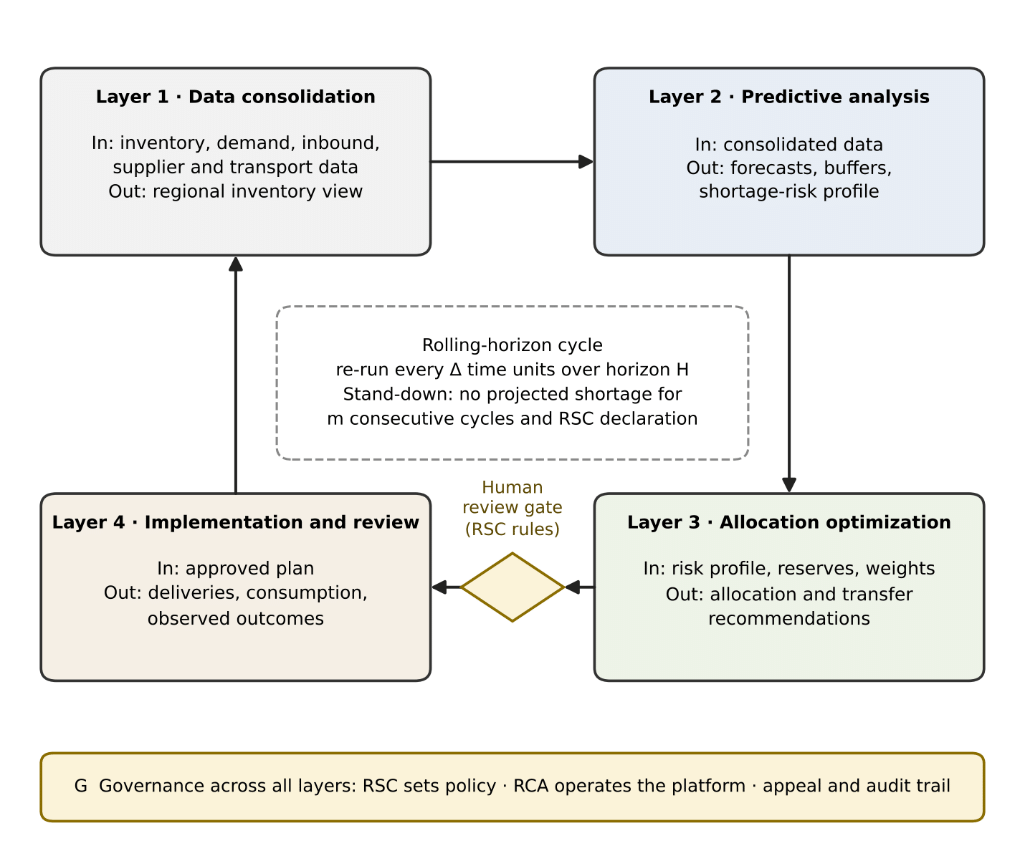
inventory allocation framework, with the human review gate and stopping
rule
Layer 4 – implementation and review (C7). Approved allocations are put into action through purchases, reserve commitments, allocations or interfacility transfers. Delivery, consumption and facility status data then initiate the next planning cycle.
4.2 Predictive Information and Decision Flow
Each decision cycle begins with consistent facility-level reporting and ends with regional evaluation and feedback. Reports from every participating facility include its current inventory, recent consumption, outstanding orders and expected delivery dates, the quantities needed to maintain required reserves and an estimate of current operating capacity. External factors, including recent infection rates, issues reported by manufacturers and suppliers, transportation restrictions and applicable public health advisories or mandates, provide additional context. Rapid communication of each facility’s status has been associated with better integration of the pharmaceutical supply chain, lower uncertainty and better operational performance [48].
After data validation, the forecasting component estimates demand for individual items or item groups at facility level across the planning horizon. Forecasts are treated as decision signals with associated uncertainty and not as actual values. Together with estimated usable inventory, confirmed replenishment and reserve requirements, they are used to evaluate potential future shortages. This distinction matters because predictive accuracy depends on how well the model adjusts to time-varying hospital environments and system-wide dynamics [49]. The framework then generates a shortage-risk profile that identifies the facilities and inventory classes at highest risk.
The generated shortage-risk profiles will serve as input for making decisions relative to alternative procurement options, allocation strategies, reserve levels, and redistribution methods. Decisions made are intended to first minimize risks associated with weighted shortages and secondly ensure equitable access while considering costs, logistics-related feasibility limitations, reserve protection needs, and allocation stability [50]. An adaptive approach is especially necessary when managing epidemic-driven demand that is constantly evolving and may not be adequately managed through traditional static decision rules. As a result, it is highly recommended that all recommendations contain sufficient detail so that managers and clinicians can review them prior to approval and make informed decisions. Such details could include but are not limited to: what was utilized as input into the forecast model; what were the uncertainty levels surrounding that forecast; what prioritized factors were utilized to determine which recommendations would be considered acceptable; which constraints ultimately impacted whether or not a particular recommendation was accepted or rejected; and what trade-offs occurred in the development of any given recommendation.
Upon final approval of decisions by management/clinicians, the approved decisions are communicated to participating facilities, suppliers, and transportation companies. Following communication of approved decisions, participating facilities track actual usage levels of consumable goods; confirm deliveries received; document any instances where product shortfalls occur; document any delays in receipt of ordered products; and record any subsequent transfers. Once tracking activities have concluded, data collected during tracking activities are then compared against forecasted usage levels/outcomes and results are returned to the framework. The iterative nature of this process —data collection, forecasting, risk assessment, allocation strategy selection, review/evaluation of selected strategy alternatives, implementation/execution of approved allocations, and post-execution evaluation—establishes an ongoing cycle of continuous learning, traceability and rolling-horizon-based adaptations across the regional network.
4.3 Coordinated Allocation and Redistribution Mechanisms
The coordinated approach of the framework to manage and redistribute inventory throughout regions includes three methods – initial allocation, reserve protection and interfacility redistribution.
Initial allocation provides distribution of inventory prior to or at the start of a response. Based on the specific needs and capabilities of each facility — including forecasted demand, clinical criticality, facility vulnerability, service capacity, current inventory holdings, and potential shortages – facility allocations will determine the amounts of initial allocated inventory for each location. Thus, this method allocates inventory based on the risk adjusted needs of the various facilities and not just the actual demands that have been reported. Differences in reporting of disease progression and geography can create large discrepancies between anticipated demand and availability of medical supplies [31].
Reserve protection creates protected reserves that are excluded from allocation and transfer and are released only when the Regional Steering Committee declares a trigger event. Reserves are set by facility from projected demand, forecast variability, replenishment lead time, item criticality and the consequences of a stockout (4). In addition, the region may maintain a strategic reserve to protect against unanticipated surges or supply chain failures. Inventory is thus classified as operational stock, protected reserve or transferable surplus, and only inventory above operational and reserve requirements is eligible for redistribution.
Interfacility transfer is initiated when updated data show a significant projected shortage of an item at one facility and sufficient transferable surplus at another. Potential transfers are evaluated on the severity and expected consequences of the shortage at the requesting facility, the quantity available for transfer, product compatibility, transport time, transfer cost and the effect on the donor’s remaining inventory. Redistribution is especially beneficial when peak demand periods do not coincide across facilities, because resources can move from lower-risk to higher-risk areas without increasing total supply [10].
To prevent unnecessary or unstable transfers, redistribution should not be triggered by minor changes in forecasts. It should require a defined level of shortage risk, an available surplus, feasible logistics and documentation that the expected benefit exceeds the transfer cost and associated risks (thresholds in Table 3). All recommendations remain subject to authorized human review. Records of completed transfers should describe the triggering conditions, the sending and receiving facilities, the items and quantities, the expected arrival date, the status of remaining reserves, the approving authority and the results achieved.
Together, these mechanisms balance responsiveness with readiness. Initial allocation distributes inventory according to risk-adjusted need, reserve protection preserves local and regional safety margins, and redistribution corrects geographic inequities caused by differences in the timing of peak demand. Their combination supports regional resource sharing while allowing each facility to maintain its own service continuity, logistical feasibility and equity.
4.4 Phased Deployment
A recommended approach to deployment is incremental. A first step is a limited-scale pilot involving a small number of hospitals in a limited geographic region and a select set of critical inventory types (see the starting guide in Table 9). Tabletop exercises that simulate realistic shortage scenarios should test data quality, decision speed, transfer execution, clarity of roles, cybersecurity and conflict resolution. Evaluation metrics (Table 5) should include forecast accuracy, the frequency and duration of shortages, violations of protected-reserve limits, the time needed to complete interfacility transfers, the rate at which recommendations are overridden, disparity in allocation among sites, and delays caused by incomplete data or governance disagreements. These measures provide feedback for calibrating models, adjusting procedures and planning expansion.
5. Research Propositions and Illustrative Application
This section develops four propositions that formalize the theoretical relationships among the framework’s components. The propositions are testable expectations and not empirical results, and they follow established guidance for developing conceptual models [12], [51]. Each is stated in conditional, comparative form, defined in terms of measurable constructs and qualified by moderators. Table 5 maps each proposition to its theoretical basis, constructs, indicators, moderators and proposed validation metrics. A stylized numerical example then illustrates the computational logic of the framework; it is not an empirical test of the propositions.
5.1 Constructs and Moderators
Four constructs are used. Predictive visibility is the extent to which facility-level forecasts, inventory positions, confirmed replenishment, reserve requirements and forecast uncertainty are integrated, timely and complete within the regional platform (indicators: share of facilities reporting on schedule, data latency, completeness of required fields). Regional coordination is the extent to which facilities share inventory information and operate under common, governed allocation and transfer protocols (indicators: share of transfers executed under protocol, time to approve a transfer, participation in decision cycles). Equity is the extent to which risk-adjusted need is satisfied comparably across facilities (indicators: \(\widetilde{E}\) and the spread of risk-adjusted fill rates). Response speed is the elapsed time from shortage alert to delivery or resolution (indicators: detection lead time and time to complete a transfer). Four moderators qualify the propositions: data quality (completeness and accuracy), trust among facilities, governance maturity (pre-defined authority, tested protocols and exercises) and forecast error (for example mean absolute percentage error or the standard deviation \(\sigma\)).
5.2 Predictive Visibility and Regional Coordination
Predictive visibility combines information from facility level demand forecasts with information about the usability of inventory at each facility, including confirmed replenishments, reserve requirements, and uncertainties in those forecasts. Forecasts by themselves do not enable regional networks to determine if their systems are appropriately positioned to meet future demands. Instead, managers need to have knowledge of where the inventory is located, when replenishment will occur, and which facilities will experience the greatest potential loss of service due to shortages. By integrating the data into a single database, predictive visibility allows for early detection of emerging shortages and additional time for consideration of procurement options, distribution/transfer possibilities or possible redistribution actions.
Although predictive visibility will not remove the inherent uncertainties within the system, its utility stems from the ability to identify trends in projected demands and modify shortage-risk assessments as new information becomes available. The use of rolling predict-then-optimize research illustrates the usefulness of relating current updated demand forecasts to coordinated allocations of healthcare resources [7]. We therefore propose:
Proposition 1: Compared with facility-level monitoring, greater integration of facility-level demand forecasts, inventory positions, replenishment commitments, reserve requirements and forecast uncertainty in regional databases (higher predictive visibility) is expected to shorten the time needed to detect emerging shortages and to improve the accuracy of shortage alerts. The relationship is expected to be stronger when data quality is high and forecast error is low.
Regional coordination is necessary to realize the full benefits of predictive visibility. If individual facilities act independently, then there is no mechanism to recognize surpluses that could be transferred to other facilities; there is no opportunity to procure items regionally; and there is little likelihood that similar shortages will result in similar regional responses. A coordinated regional approach to managing shortages creates a shared decision-making environment. Within such environments, facilities share relevant information concerning their respective needs, inventory positions, logistical capabilities and feasible response alternatives. Through collaborative planning and risk management strategies the Regional Coordinating Authority can minimize informational disparities and enhance overall resilience of the health-care supply chain relative to disruptions caused by stockouts [52].
Coordinated regional responses do not imply total centralized control. Participating hospitals retain specific approval powers regarding their protected reserves and extraordinary transfers while the Regional Coordinating Authority compares the inventory positions and feasible intervention options for the participating hospitals. Thus, the primary benefit is not necessarily the creation of a completely centralized system but providing each hospital with a means to assess a broader array of potential responses to shortages. We therefore propose:
Proposition 2: Compared with uncoordinated facility-level responses, higher interfacility coordination, meaning shared inventory position information under governed allocation processes, is expected to shorten the time from shortage detection to resolution. The effect is expected to be stronger where trust among facilities and governance maturity are high.
5.3 Equity, Reserve Protection, and Redistribution
The framework treats equity as an explicit objective of allocation and not as a likely by-product of efficient allocation. Priority is therefore given to facilities according to their vulnerability, shortage severity, clinical criticality, service capacity and the potential impact of unmet demand. This need-based approach differs from equal and proportional allocation because each facility has its own demand profile, inventory position and service obligation, and research indicates that proportional allocation may be suboptimal in multi-period epidemic resource decisions [8]. Equity is measured by the risk-weighted shortfall rate defined in Equation (10). We therefore propose:
Proposition 3: Compared with allocation rules based on equal quantities, proportional demand or historical usage, allocation that incorporates facility vulnerability and shortage severity is expected to reduce disparity in risk-adjusted demand satisfaction among participating facilities, at a bounded cost in total unmet demand (the efficiency–equity trade-off). The reduction is expected to be smaller where vulnerability measures are weakly valid or forecasts for data-poor facilities are biased.
The framework also sets facility-specific reserve levels, based on item criticality, expected usage, replenishment lead time, forecast uncertainty and the potential loss from stockouts, which determine whether inventory exceeds operational and reserve requirements. Inventory above those requirements is defined as transferable surplus (7).
Transferable surplus at low-risk facilities is moved to high-risk facilities with material shortages through controlled redistribution. Redistribution occurs only when it is logistically feasible, when transfers can reasonably be expected to reduce unmet demand in the region, and when it does not raise the donor’s stockout risk above an acceptable level. Coordinated sharing across facilities during peak pandemic demand, when demand varies by location, can potentially improve system-wide resource use [10]. We therefore propose:
Proposition 4: Compared with allocation without redistribution, or with unconditional transfers, combining risk-calibrated reserve levels with rule-based redistribution of transferable surplus is expected to reduce unmet demand in the region while keeping donor stockout probability within a pre-specified tolerance. The reduction is expected to be greater when demand peaks are asynchronous across facilities, transport capacity is sufficient and misreporting is limited.
5.4 Illustrative Numerical Example
To make the model concrete, we use a deliberately small and stylized example with four hypothetical hospitals (A to D) and one inventory category, N95 respirators, over a single seven-day planning cycle (\(H = 7\) days, collapsed into one period so that the index \(t\) is omitted). All values are invented for illustration: they are not drawn from real hospitals and were not calibrated to any dataset. Hospital A is a large urban center with high and uncertain demand. Hospital B is a community hospital serving a vulnerable population, with little stock and a short, noisy usage history (hence higher forecast uncertainty). Hospital C is a suburban hospital with surplus stock. Hospital D is a small, remote critical-access hospital with high vulnerability and high delivery cost. Table 6 shows the inputs and the quantities derived from (3)–(7) with \(z_{0.95} = 1.645\) (\(\alpha = 0.05\)). The region can allocate \(G = 1,800\) additional respirators. Unit delivery costs from the regional warehouse are 0.10, 0.12, 0.10 and 0.45 for A to D, and transfer costs from C are 0.20 (to A), 0.15 (to B) and 0.60 (to D) per respirator, in arbitrary currency units. The criticality weight is \(c = 1\) and \(\eta = 1\), so that \(\rho_{i} = 1 + v_{i}\).
Table 5: Mapping of theories, constructs, propositions, indicators, moderators and validation metrics Click to enlarge
| Proposition (components) | Theoretical basis | Constructs (predictor outcome) | Indicators and validation metrics | Moderators | Validation phase |
|---|---|---|---|---|---|
| P1 (C1, C2, C7) | Systems theory; dynamic capabilities (sensing) | Predictive visibility shortage-detection performance | Shortage-alert lead time before stockout; recall and precision (false-negative and false-positive rates) of alerts; forecast error (MAPE, \(\sigma\)); data completeness and latency | Data quality; forecast error | 2 and 3 |
| P2 (C2, C6, G) | Resource dependence theory; dynamic capabilities (seizing) | Regional coordination response speed | Time from alert to approved and completed transfer; share of alerts resolved within target time; share of transfers executed under protocol | Trust among facilities; governance maturity | 1, 2 and 3 |
| P3 (C3, C4) | Distributive and procedural justice theory | Need-based allocation (vulnerability and severity weighting) equity | \(\widetilde{E}\); spread of risk-adjusted fill rates across facilities; total unmet demand (to quantify the efficiency–equity trade-off) | Validity of vulnerability index; forecast bias for data-poor facilities; agreement on weights | 1, 2 and 3 |
| P4 (C5, C6, C7) | Systems theory; dynamic capabilities (reconfiguring); resource dependence theory | Risk-calibrated reserves and conditional redistribution regional unmet demand and donor stockout risk | Regional unmet demand; days below reserve; donor stockout probability relative to \(\alpha_{k}\); reserve violations; allocation stability \(\widetilde{S}\) | Asynchronous demand peaks; transport capacity; forecast error; misreporting | 2 and 3 |
| Proposition (components) | Theoretical basis | Constructs (predictor outcome) | Indicators and validation metrics | Moderators | Validation phase |
|---|---|---|---|---|---|
| P1 (C1, C2, C7) | Systems theory; dynamic capabilities (sensing) | Predictive visibility shortage-detection performance | Shortage-alert lead time before stockout; recall and precision (false-negative and false-positive rates) of alerts; forecast error (MAPE, \(\sigma\)); data completeness and latency | Data quality; forecast error | 2 and 3 |
| P2 (C2, C6, G) | Resource dependence theory; dynamic capabilities (seizing) | Regional coordination response speed | Time from alert to approved and completed transfer; share of alerts resolved within target time; share of transfers executed under protocol | Trust among facilities; governance maturity | 1, 2 and 3 |
| P3 (C3, C4) | Distributive and procedural justice theory | Need-based allocation (vulnerability and severity weighting) equity | \(\widetilde{E}\); spread of risk-adjusted fill rates across facilities; total unmet demand (to quantify the efficiency–equity trade-off) | Validity of vulnerability index; forecast bias for data-poor facilities; agreement on weights | 1, 2 and 3 |
| P4 (C5, C6, C7) | Systems theory; dynamic capabilities (reconfiguring); resource dependence theory | Risk-calibrated reserves and conditional redistribution regional unmet demand and donor stockout risk | Regional unmet demand; days below reserve; donor stockout probability relative to \(\alpha_{k}\); reserve violations; allocation stability \(\widetilde{S}\) | Asynchronous demand peaks; transport capacity; forecast error; misreporting | 2 and 3 |
Table 6: Inputs and derived quantities for the hypothetical four-hospital example (N95 respirators) Click to enlarge
| Quantity (7-day horizon) | A | B | C | D | Region |
|---|---|---|---|---|---|
| Forecast demand \({\widehat{D}}_{i}\) | 4,200 | 1,800 | 1,500 | 900 | 8,400 |
| Forecast error SD \(\sigma_{i}\) | 630 | 360 | 225 | 225 | – |
| On-hand inventory \(O_{i}\) | 2,600 | 700 | 4,200 | 450 | 7,950 |
| Protected reserve \(L_{i}\) (about 2 days) | 1,200 | 500 | 430 | 260 | 2,390 |
| Usable inventory \(A_{i} = O_{i} – L_{i}\) | 1,400 | 200 | 3,770 | 190 | 5,560 |
| Confirmed inbound \(Q_{i}\) | 500 | 0 | 600 | 0 | 1,100 |
| Vulnerability index \(v_{i}\) | 0.4 | 0.8 | 0.3 | 0.9 | – |
| Risk weight \(\rho_{i} = 1 + v_{i}\) | 1.4 | 1.8 | 1.3 | 1.9 | – |
| Buffer \(B_{i} = 1.645\,\sigma_{i}\) | 1,036 | 592 | 370 | 370 | – |
| Requirement \(R_{i}\) (6) | 3,336 | 2,192 | 0 | 1,080 | – |
| Transferable surplus \(\Gamma_{i}\) (7) | 0 | 0 | 2,500 | 0 | 2,500 |
| Unmet demand if each hospital relies on its own stock, \(\left\lbrack {\widehat{D}}_{i} – A_{i} – Q_{i} \right\rbrack^{+}\) | 2,300 | 1,600 | 0 | 710 | 4,610 |
| Historical weekly usage (for baseline rule) | 3,800 | 1,300 | 1,700 | 600 | 7,400 |
| Quantity (7-day horizon) | A | B | C | D | Region |
|---|---|---|---|---|---|
| Forecast demand \({\widehat{D}}_{i}\) | 4,200 | 1,800 | 1,500 | 900 | 8,400 |
| Forecast error SD \(\sigma_{i}\) | 630 | 360 | 225 | 225 | – |
| On-hand inventory \(O_{i}\) | 2,600 | 700 | 4,200 | 450 | 7,950 |
| Protected reserve \(L_{i}\) (about 2 days) | 1,200 | 500 | 430 | 260 | 2,390 |
| Usable inventory \(A_{i} = O_{i} – L_{i}\) | 1,400 | 200 | 3,770 | 190 | 5,560 |
| Confirmed inbound \(Q_{i}\) | 500 | 0 | 600 | 0 | 1,100 |
| Vulnerability index \(v_{i}\) | 0.4 | 0.8 | 0.3 | 0.9 | – |
| Risk weight \(\rho_{i} = 1 + v_{i}\) | 1.4 | 1.8 | 1.3 | 1.9 | – |
| Buffer \(B_{i} = 1.645\,\sigma_{i}\) | 1,036 | 592 | 370 | 370 | – |
| Requirement \(R_{i}\) (6) | 3,336 | 2,192 | 0 | 1,080 | – |
| Transferable surplus \(\Gamma_{i}\) (7) | 0 | 0 | 2,500 | 0 | 2,500 |
| Unmet demand if each hospital relies on its own stock, \(\left\lbrack {\widehat{D}}_{i} – A_{i} – Q_{i} \right\rbrack^{+}\) | 2,300 | 1,600 | 0 | 710 | 4,610 |
| Historical weekly usage (for baseline rule) | 3,800 | 1,300 | 1,700 | 600 | 7,400 |
At the decision epoch, hospitals A, B and D show positive requirements (shortage alerts), whereas hospital C holds a transferable surplus of 2,500 respirators. A facility-level view would show only that three hospitals are short and one is not; the regional view, which integrates forecasts, inventory, inbound supply, reserves and uncertainty, shows that the surplus at C could cover much of the shortfall. If each hospital relied on its own stock and inbound supply alone, projected unmet demand would be 4,610 respirators (A 2,300; B 1,600; D 710), against only 1,800 respirators of regional supply.
Three simple rules allocate the 1,800 respirators of regional supply without redistribution: (i) first-come-first-served, with requests equal to forecast demand arriving in the order A, C, B, D; (ii) allocation in proportion to historical weekly usage; and (iii) allocation in proportion to forecast demand. The framework is then solved as a linear program with the objective and constraints of Equations (8)–(20) (\(w_{S} = 0\) in the first cycle), using balanced weights \(\left( w_{U},w_{E},w_{C} \right) = (0.4,0.2,0.4)\), first without and then with redistribution, and finally with efficiency-leaning weights \((0.5,0,0.5)\) for comparison. Table 7 reports the results.
Three observations follow. First, without redistribution all rules face the same binding constraint, regional supply of 1,800 respirators against a projected shortfall of 4,610. First-come-first-served directs all supply to A and leaves B with an 11% fill rate and D with 21%. The historical-usage and proportional rules send 414 and 321 respirators, respectively, to hospital C, which already holds a surplus, so total unmet demand is higher (3,224 and 3,131 units). The framework without redistribution sends no supply to C and allocates by risk-weighted need, which lowers the worst-off shortfall rate from 1.21–1.60 under the baselines to 0.63 and raises the lowest fill rate from 11–33% to 55%. Second, redistribution has the largest effect. When C releases its full transferable surplus of 2,500 respirators, retaining its buffer of 370 respirators and its protected reserve of 430, unmet demand falls from 2,810 to 310 units (a reduction of 89%) and all four hospitals reach fill rates of 95% or higher. Third, weights matter. With efficiency-leaning weights (no weight on equity), the model leaves remote hospital D with a 21% fill rate because delivering to D is costly, so unmet demand is 710 units and the worst-off shortfall rate is 1.50. Balanced weights cost more (840 versus 520 cost units) but yield unmet demand of 310 units and a worst-off shortfall rate of 0.07.
Table 7: Results by allocation policy (hypothetical data; cost in arbitrary units) Click to enlarge
| Policy | Supply allocated A/B/C/D | Transfers from C | Fill rate A/B/C/D (%) | Unmet units | Risk-weighted unmet | Worst-off shortfall rate | Cost index |
|---|---|---|---|---|---|---|---|
| First-come-first-served | 1,800/0/0/0 | None | 88/11/100/21 | 2,810 | 4,929 | 1.60 | 180 |
| Historical usage | 924/316/414/146 | None | 67/29/100/37 | 3,224 | 5,308 | 1.28 | 237 |
| Proportional to forecast demand | 900/386/321/193 | None | 67/33/100/43 | 3,131 | 5,128 | 1.21 | 255 |
| Framework without redistribution (balanced weights) | 416/972/0/412 | None | 55/65/100/67 | 2,810 | 4,334 | 0.63 | 344 |
| Framework with redistribution, efficiency-leaning weights | 1,800/0/0/0 | 500 to A; 1,600 to B | 100/100/100/21 | 710 | 1,349 | 1.50 | 520 |
| Framework with redistribution, balanced weights | 1,123/0/0/677 | 969 to A; 1,531 to B | 95/96/100/96 | 310 | 478 | 0.07 | 840 |
| Policy | Supply allocated A/B/C/D | Transfers from C | Fill rate A/B/C/D (%) | Unmet units | Risk-weighted unmet | Worst-off shortfall rate | Cost index |
|---|---|---|---|---|---|---|---|
| First-come-first-served | 1,800/0/0/0 | None | 88/11/100/21 | 2,810 | 4,929 | 1.60 | 180 |
| Historical usage | 924/316/414/146 | None | 67/29/100/37 | 3,224 | 5,308 | 1.28 | 237 |
| Proportional to forecast demand | 900/386/321/193 | None | 67/33/100/43 | 3,131 | 5,128 | 1.21 | 255 |
| Framework without redistribution (balanced weights) | 416/972/0/412 | None | 55/65/100/67 | 2,810 | 4,334 | 0.63 | 344 |
| Framework with redistribution, efficiency-leaning weights | 1,800/0/0/0 | 500 to A; 1,600 to B | 100/100/100/21 | 710 | 1,349 | 1.50 | 520 |
| Framework with redistribution, balanced weights | 1,123/0/0/677 | 969 to A; 1,531 to B | 95/96/100/96 | 310 | 478 | 0.07 | 840 |
Note. Fill rate is \(1 – u_{i}/{\widehat{D}}_{i}\). Risk-weighted unmet is \(\sum_{i}^{}\rho_{i}u_{i}\). Worst-off shortfall rate is \(\max_{i}\rho_{i}u_{i}/{\widehat{D}}_{i}\), the quantity minimized by the equity term before normalization. Cost index is \(\sum_{i}^{}\kappa_{i}^{A}x_{i} + \sum_{i,j}^{}\kappa_{ij}^{T}y_{ij}\).
Table 8: Sensitivity of the framework’s results to the equity weight and to forecast error (hypothetical data) Click to enlarge
| Panel A: equity weight \(w_{E}\) (with \(w_{U} = w_{C} = \left( 1 – w_{E} \right)/2\)) | ||||
|---|---|---|---|---|
| \[w_{E}\] | Unmet units | Risk-weighted unmet | Worst-off rate | Cost index |
| 0.00 | 710 | 1,349 | 1.499 | 520 |
| 0.05 | 310 | 455 | 0.089 | 834 |
| 0.10 | 310 | 455 | 0.089 | 834 |
| 0.20 | 310 | 478 | 0.069 | 840 |
| 0.40 | 310 | 478 | 0.069 | 840 |
| 0.60 | 310 | 478 | 0.069 | 840 |
| Panel B: forecast-error scale (balanced weights) | ||||
| Scale of \(\sigma\) | Transferable surplus \(\Gamma_{C}\) | Unmet units | Worst-off rate | Donor ending stock |
| 0.5 | 2,685 | 125 | 0.028 | 185 |
| 1.0 | 2,500 | 310 | 0.069 | 370 |
| 1.5 | 2,315 | 495 | 0.111 | 555 |
| 2.0 | 2,130 | 680 | 0.152 | 740 |
| Panel A: equity weight \(w_{E}\) (with \(w_{U} = w_{C} = \left( 1 – w_{E} \right)/2\)) | ||||
|---|---|---|---|---|
| \[w_{E}\] | Unmet units | Risk-weighted unmet | Worst-off rate | Cost index |
| 0.00 | 710 | 1,349 | 1.499 | 520 |
| 0.05 | 310 | 455 | 0.089 | 834 |
| 0.10 | 310 | 455 | 0.089 | 834 |
| 0.20 | 310 | 478 | 0.069 | 840 |
| 0.40 | 310 | 478 | 0.069 | 840 |
| 0.60 | 310 | 478 | 0.069 | 840 |
| Panel B: forecast-error scale (balanced weights) | ||||
| Scale of \(\sigma\) | Transferable surplus \(\Gamma_{C}\) | Unmet units | Worst-off rate | Donor ending stock |
| 0.5 | 2,685 | 125 | 0.028 | 185 |
| 1.0 | 2,500 | 310 | 0.069 | 370 |
| 1.5 | 2,315 | 495 | 0.111 | 555 |
| 2.0 | 2,130 | 680 | 0.152 | 740 |
Table 8 reports two sensitivity analyses. In Panel A, the equity weight is varied while unmet demand and cost share the remaining weight equally. Once \(w_{E}\) reaches 0.05, the solution protects the worst-off hospital: moving from \(w_{E} = 0\) to 0.05 cuts unmet demand from 710 to 310 units and the worst-off shortfall rate from 1.50 to 0.09. Raising \(w_{E}\) from 0.10 to 0.20 shifts part of the residual shortfall from hospital A to the more vulnerable hospital B and lowers the worst-off shortfall rate from 0.089 to 0.069 (a reduction of 22%) at the price of a 5% increase in risk-weighted unmet demand (455 to 478 units), which illustrates the efficiency–equity trade-off. Total unmet demand is unchanged at 310 units because regional supply is binding. In Panel B, forecast uncertainty is scaled. Larger forecast errors increase buffers and shrink the transferable surplus of hospital C from 2,685 to 2,130 units, so unmet demand rises from 125 to 680 units: each unit a donor withholds as buffer is a unit unavailable to recipients when supply is binding. The service level \(1 – \alpha_{k}\) therefore trades donor protection against recipient shortage and should be set by the Regional Steering Committee with the sensitivity report in view.
The example illustrates how the components of the framework interact. Integrating data identifies both the shortage and the surplus (P1); common rules and governance allow the surplus to be moved (P2); risk weighting and the minimax measure determine who bears the residual shortfall (P3); and conditional redistribution reduces unmet demand in the region while leaving the donor at its buffer (P4). Because the data are hypothetical and the outcomes follow from the model’s own assumptions, the example does not test or confirm the propositions and makes no claim about real-world effectiveness. After approval by the Regional Steering Committee, actual consumption, deliveries and transfers would replace forecasts in the next cycle, at which point the stability term (\(w_{S} > 0\)) would apply.
6. Discussion, Implications, Limitations and Future Research
This study views pandemic inventory preparedness as an adaptive regional decision problem and not as a set of separate forecasting, stockpiling and allocation activities. This view reflects the broader role of operations and supply chain management in managing demand, inventory, logistics, capacity and resource availability during public health emergencies [53]. This section answers the research questions, discusses implications and limitations, and sets out priorities for validation.
6.1 Answers to the Research Questions
RQ1 asked how uncertainty-adjusted forecasting combined with regional inventory visibility can support earlier and more coordinated allocation. The framework’s answer is that forecasts become decision-relevant only when they are compared, facility by facility, with usable inventory, confirmed inbound supply and protected reserves. Equations (2)–(7) convert a forecast and its uncertainty into a requirement \(R\) and a transferable surplus \(\Gamma\), so that a region can distinguish a regional shortage from a local one (P1). Coordination follows because all facilities are evaluated with the same classification and decision rules under common governance (P2).
RQ2 asked how regional decision-making can address conflicting goals. The answer is a weighted multi-objective formulation ((8)–(13)) with normalized components, an explicit minimax equity measure, protected reserves and optional service floors. Trade-offs are made visible by reporting allocations under alternative weights and by publishing the rationale (Tables 7 and 8), which supports distributive and procedural justice (P3).
RQ3 asked under what circumstances pooling, redistribution and rolling-horizon adaptation contribute to preparedness. The framework indicates that they do so when (i) transferable surplus exists after buffers and protected reserves are respected, (ii) demand peaks are asynchronous or at least one facility holds surplus, (iii) feasible transport arcs and sufficient lead time exist, (iv) data quality and trust are adequate to limit misreporting, and (v) governance gives the network authority to approve and execute transfers. Rolling-horizon adaptation matters most when forecast errors or deliveries change quickly relative to the cycle length (P4). These are conditional, theoretically derived answers that remain to be tested.
6.2 Theoretical and Practical Implications
The framework’s most important theoretical contribution is its movement from optimizing facility level inventory to a regional decision architecture that incorporates predictive and prescriptive elements throughout facilities over time. The literature in healthcare supply chain emphasizes systems thinking and simultaneously considering clinical, operational and financial goals [54]. The framework expands on this view by relating demand forecasts, regional inventory visibility, allocation based on equity awareness, reserve protection, redistribution, governance, and rolling-horizon adaptation. It also maps four theories to measurable constructs and testable propositions (Table 5).
A second contribution of the framework is the operational integration of efficiency, equity, and resilience. Traditional inventory models generally focus on cost or reducing overall shortage levels, whereas preparedness for pandemics requires preserving future capacity and preventing repeated disadvantages to vulnerable facilities. By categorizing inventory as either operational stock, protected reserve or transferable surplus it makes clear when sharing is suitable. Redistribution is therefore a condition-based mechanism of resilience instead of simply transferring available inventory without any conditions. This logic is supported by evidence demonstrating that healthcare supply chain resilience relies upon providing both buffer resources and bridging connections among supply chain partners [2].
For healthcare managers, the framework provides a structured format for developing preparedness plans. Participating facilities must adopt common reporting formats, set the reserve levels at which they will begin to transfer inventory, identify who holds approval and escalation responsibility for each transfer, and create mechanisms to track redistributed items. Forecasts should be treated as revisable decision signals, and recommendations should state their underlying assumptions, including uncertainty, priority assignments, constraint settings and trade-offs. These practices preserve professional discretion while increasing the likelihood of consistent and accountable decisions. Table 9 offers a short starting guide.
Regional health authorities and policymakers will find that the framework identifies the institutional structures necessary for coordination. Some examples of policies supporting coordination include developing and enforcing minimum data/information requirements and interoperability requirements, assigning authority for emergency allocations, supplying logistical support for transfers, defining ownership/financing of shared reserve inventories, establishing provisions related to patient confidentiality/data security, identifying liability arrangements and conflict resolution protocols. The framework supports rather than supplants clinical judgment and managerial judgment especially where there is a lack of information and/or the results of decisions will result in significant ethical considerations.
6.3 Limitations
This study is conceptual and methodological. No primary data were collected, the numerical example uses hypothetical values, and the framework has not been tested on real or historical pandemic data. The four propositions are therefore theoretically derived relationships and not empirically documented ones, and the study does not claim that the framework has reduced shortages, improved equity, shortened response times or increased resilience.
The framework also depends on data timeliness, accuracy, completeness and standardization, and poor data quality can weaken recommended actions. Its representations of vulnerability, reserve needs, delivery feasibility and allocation equity simplify complex operational and ethical decisions, and the vulnerability index, objective weights and minimax equity measure are normative choices that different organizations may interpret differently. Uncertainty is handled through a buffer rule and not through full stochastic or robust optimization, and the buffer assumes approximately normal forecast errors. The numerical example covers one item category and one cycle and does not establish how results generalize.
Table 9: Starting guide for practitioners Click to enlarge
| Element | Recommendation |
|---|---|
| Minimum data fields | Facility and item category; usable on-hand quantity and quantity expiring within the horizon; inbound quantity with expected arrival date; consumption over the previous 7 days; forecast demand for the next \(H\) days and its basis; storage capacity; receiving hours and contact; vulnerability indicators (optional at start) |
| Initial reserve policy | Each facility holds a protected reserve of 2–3 days of average forecast demand for critical categories, excluded from transfers and released only on a trigger declared by the RSC; reserves are reported every cycle |
| Pilot scope | Three to five hospitals in one geographic area; one critical category (for example N95 respirators); 8–12 weeks, preceded by a tabletop exercise; a named RCA team |
| Governance set-up | Signed data-sharing and transfer agreement; named RSC with decision rights; objective weights agreed after reviewing a sensitivity report; appeal window and independent review panel defined; legal review completed |
| Decision rules | Daily cycle and 14-day horizon (Table 3); shortage and transfer thresholds; net-benefit test; stopping rule |
| Key metrics | Shortage-alert lead time, recall and precision; forecast error by facility; unmet demand and days below reserve; fill-rate disparity (worst-off shortfall rate); reserve violations; time to complete transfers; override rate; donor stockout events |
| Element | Recommendation |
|---|---|
| Minimum data fields | Facility and item category; usable on-hand quantity and quantity expiring within the horizon; inbound quantity with expected arrival date; consumption over the previous 7 days; forecast demand for the next \(H\) days and its basis; storage capacity; receiving hours and contact; vulnerability indicators (optional at start) |
| Initial reserve policy | Each facility holds a protected reserve of 2–3 days of average forecast demand for critical categories, excluded from transfers and released only on a trigger declared by the RSC; reserves are reported every cycle |
| Pilot scope | Three to five hospitals in one geographic area; one critical category (for example N95 respirators); 8–12 weeks, preceded by a tabletop exercise; a named RCA team |
| Governance set-up | Signed data-sharing and transfer agreement; named RSC with decision rights; objective weights agreed after reviewing a sensitivity report; appeal window and independent review panel defined; legal review completed |
| Decision rules | Daily cycle and 14-day horizon (Table 3); shortage and transfer thresholds; net-benefit test; stopping rule |
| Key metrics | Shortage-alert lead time, recall and precision; forecast error by facility; unmet demand and days below reserve; fill-rate disparity (worst-off shortfall rate); reserve violations; time to complete transfers; override rate; donor stockout events |
Implementation assumes that participating facilities are willing and legally able to share information and transfer qualified inventory. Autonomous institutions, competitive markets, procurement rules, privacy and liability law, and unclear regional authority can inhibit cooperation. Strategic behavior (misreporting, hoarding and free-riding) is addressed through governance and incentive design but is not modeled formally, and the framework does not fully model the effects of trust, culture and power dynamics on compliance.
Finally, the framework addresses regional inventory decisions only. It does not model upstream suppliers, workforce dependencies, clinical pathways, epidemiology or wider public health disruptions (Table 2), and it covers durable and semi-durable consumable supplies and not temperature-controlled products or reusable equipment. Its application may therefore vary with inventory type, emergency type, network maturity and governance structure.
6.4 Future Research and Validation Strategy
Validation should proceed in three phases that are linked to the four propositions and the framework objectives through the metrics in Table 5. Phase one assesses the framework’s assumptions, construct definitions, usability and governance requirements through expert review. Experts will be selected purposively to cover healthcare operations, clinical practice, emergency planning, supply chain management, ethics and regional coordination, including urban and rural or safety-net institutions. A panel of about 12–15 members with at least five years of relevant experience will take part in a modified Delphi process of two or three rounds. Items will be rated on a five-point scale, consensus will be defined as at least 75% agreement with an interquartile range of 1 or less, and construct definitions will be accepted when their content validity index is at least 0.80. Feedback will refine the propositions, rules and implementation procedures.
Phase two consists of computational experiments on a simulated regional network of 5–20 hospitals. Demand scenarios will be generated from calibrated epidemic curves and, where available, historical hospital-level admission and supply records, and forecasts will be back-tested retrospectively on at least one real health system. The design will vary demand intensity, forecast error, supply disruption, transport capacity, reserve policy and cooperation level in a factorial or Latin hypercube design with at least 30 replications per cell and common random numbers. Benchmarks are (B1) independent facility-level policies, (B2) proportional allocation, (B3) historical-usage allocation, (B4) first-come-first-served, (B5) single-objective optimization without equity or reserve terms, (B6) a static, non-rolling version of the framework, and (B7) a perfect-information allocation as an upper bound on the value of information. Outcome measures are those in Table 5: shortage-detection lead time and accuracy; shortage frequency and duration; risk-adjusted demand satisfaction and the equity measure; reserve violations; donor stockout probability; transfer time; and allocation stability. A proposition will be treated as supported in simulation if the framework outperforms the relevant benchmarks on its linked metric with pre-specified practical significance (for example a relative improvement of at least 10%) and statistical significance (paired tests with correction for multiple comparisons, and effect sizes reported), without breaching donor stockout tolerance or reserve limits, and if the moderator effects have the predicted sign. Sensitivity analysis will cover the objective weights (sweeps of the weight simplex) and forecast-error levels. All metrics noted above are proposed evaluation metrics and not results of the current study.
Phase three is a small-scale regional pilot of three to five hospitals and one critical item category, run for eight to twelve weeks after a tabletop exercise. It will evaluate whether participating facilities can generate reliable data, interpret recommendations, implement transfers and integrate the framework into existing emergency response processes. Proposed success criteria include timely reporting by at least 90% of facilities, a median time from alert to completed transfer within an agreed target, no breach of protected-reserve limits by donors, and stakeholder acceptance measured by override rates and structured feedback. The pilot will also examine data reliability, decision timing, governance disputes and unintended inequity. This progression from expert review to controlled experimentation and field testing is consistent with design science methodologies that emphasize iterative development, testing and validation of artifacts [14], [55].
In summary, the framework offers a specified architecture and a research agenda for pandemic preparedness aimed at greater resilience, equity and accountability. Whether it delivers these benefits is a question for the validation strategy above and not a finding of this study.
7. Conclusion
This paper proposed a predictive inventory allocation framework for regional pandemic preparedness as a conceptual and methodological contribution. Theoretically, the framework explains regional preparedness as a network-based capability. Systems theory, dynamic capabilities theory, resource dependence theory, and distributive and procedural justice theory are mapped to four constructs (predictive visibility, coordination, equity and response speed) and to four testable propositions with indicators and moderators (Table 5). The framework moves the analysis from facility-level inventory control to regional decision-making in which forecasts, protected reserves, equity and governance are treated together.
Methodologically, the paper specifies a rolling-horizon, multi-objective model with explicit definitions of requirement, buffer, protected reserve and transferable surplus; a minimax equity measure that distinguishes equity from equality and avoids leveling down; and normalized objective components with a documented weighting procedure. A stylized four-hospital example shows how the model separates the effects of allocation rules and redistribution and how weights and forecast error change outcomes. Because the example uses hypothetical data, it illustrates the mechanics of the model and is not evidence of effectiveness.
For practitioners and policymakers, the framework identifies the institutional preconditions for regional sharing: common data definitions, a Regional Steering Committee with decision rights, human review and appeal, incentive and legal safeguards, and a phased pilot (Table 9). Facilities and regulators can use it to evaluate alternative allocation, reserve and transfer policies transparently.
The study has limitations. It is conceptual; no real or historical pandemic data were analyzed; uncertainty is handled by a buffer rule and not by stochastic optimization; the model covers a limited class of consumable supplies; and incentive, legal and behavioral factors are discussed but not modeled. The next step is the three-phase validation strategy of expert review, computational experiments on real or realistic data against defined benchmarks, and a small regional pilot. Extensions include scenario-based or robust formulations, multiple interacting item categories and models of strategic behavior among facilities.
- B. Scala, C. F. Lindsay, “Supply chain resilience during pandemic disruption: Evidence from healthcare,” Supply Chain Management: An International Journal, vol. 26, no. 6, pp. 672–688, 2021, doi:10.1108/SCM-09-2020-0434.
- A. Spieske, M. Gebhardt, M. Kopyto, H. Birkel, “Improving resilience of the healthcare supply chain in a pandemic: Evidence from Europe during the COVID-19 crisis,” Journal of Purchasing and Supply Management, vol. 28, no. 5, art. no. 100748, 2022, doi:10.1016/j.pursup.2022.100748.
- G. Arji, H. Ahmadi, P. Avazpoor, M. Hemmat, “Identifying resilience strategies for disruption management in the healthcare supply chain during COVID-19 by digital innovations: A systematic literature review,” Informatics in Medicine Unlocked, vol. 38, art. no. 101199, 2023, doi:10.1016/j.imu.2023.101199.
- G. Baloch, F. Gzara, S. Elhedhli, “COVID-19 PPE distribution planning with demand priorities and supply uncertainties,” Computers & Operations Research, vol. 146, art. no. 105913, 2022, doi:10.1016/j.cor.2022.105913.
- M. Alizadeh, M. S. Pishvaee, H. Jahani, M. M. Paydar, A. Makui, “Viable healthcare supply chain network design for a pandemic,” Annals of Operations Research, vol. 328, no. 1, pp. 35–73, 2023, doi:10.1007/s10479-022-04934-7.
- M. R. Ehmann, E. K. Zink, A. B. Levin, J. I. Suarez, H. M. E. Belcher, E. L. Daugherty Biddison, D. J. Doberman, K. D’Souza, D. M. Fine, B. T. Garibaldi et al., “Operational recommendations for scarce resource allocation in a public health crisis,” Chest, vol. 159, no. 3, pp. 1076–1083, 2021, doi:10.1016/j.chest.2020.09.246.
- J. Jiang, D. Sheng, X. Chen, Q. Tian, F. Li, P. Yang, “Data-driven collaborative healthcare resource allocation in pandemics,” Transportation Research Part E: Logistics and Transportation Review, vol. 192, art. no. 103828, 2024, doi:10.1016/j.tre.2024.103828.
- X. Yin, I. E. Büyüktahtakın, “A multi-stage stochastic programming approach to epidemic resource allocation with equity considerations,” Health Care Management Science, vol. 24, no. 3, pp. 597–622, 2021, doi:10.1007/s10729-021-09559-z.
- D. Bertsimas, L. Boussioux, R. Cory-Wright, A. Delarue, V. Digalakis, A. Jacquillat, D. L. Kitane, G. Lukin, M. Li, L. Mingardi et al., “From predictions to prescriptions: A data-driven response to COVID-19,” Health Care Management Science, vol. 24, no. 2, pp. 253–272, 2021, doi:10.1007/s10729-020-09542-0.
- S. Mehrotra, H. Rahimian, M. Barah, F. Luo, K. Schantz, “A model of supply-chain decisions for resource sharing with an application to ventilator allocation to combat COVID-19,” Naval Research Logistics, vol. 67, no. 5, pp. 303–320, 2020, doi:10.1002/nav.21905.
- Z.-Y. Chen, M. Sun, X.-X. Han, “Prediction-driven collaborative emergency medical resource allocation with deep learning and optimization,” Journal of the Operational Research Society, vol. 74, no. 2, pp. 590–603, 2023, doi:10.1080/01605682.2022.2101953.
- E. Jaakkola, “Designing conceptual articles: Four approaches,” AMS Review, vol. 10, pp. 18–26, 2020, doi:10.1007/s13162-020-00161-0.
- A. R. Hevner, S. T. March, J. Park, S. Ram, “Design science in information systems research,” MIS Quarterly, vol. 28, no. 1, pp. 75–105, 2004, doi:10.2307/25148625.
- K. Peffers, T. Tuunanen, M. A. Rothenberger, S. Chatterjee, “A design science research methodology for information systems research,” Journal of Management Information Systems, vol. 24, no. 3, pp. 45–77, 2007, doi:10.2753/MIS0742-1222240302.
- J. Cohen, Y. van der Meulen Rodgers, “Contributing factors to personal protective equipment shortages during the COVID-19 pandemic,” Preventive Medicine, vol. 141, art. no. 106263, 2020, doi:10.1016/j.ypmed.2020.106263.
- E. Furman, A. Cressman, S. Shin, A. Kuznetsov, F. Razak, A. Verma, A. Diamant, “Prediction of personal protective equipment use in hospitals during COVID-19,” Health Care Management Science, vol. 24, no. 2, pp. 439–453, 2021, doi:10.1007/s10729-021-09561-5.
- G. Oeser, P. Romano, “Exploring risk pooling in hospitals to reduce demand and lead time uncertainty,” Operations Management Research, vol. 14, pp. 78–94, 2021, doi:10.1007/s12063-020-00171-y.
- P. Atcha, I. Vlachos, S. Kumar, “Inventory sharing in healthcare supply chains: Systematic literature review and future research agenda,” The International Journal of Logistics Management, vol. 35, no. 4, pp. 1107–1141, 2024, doi:10.1108/IJLM-12-2022-0497.
- V. Khodaee, V. Kayvanfar, A. Haji, “A humanitarian cold supply chain distribution model with equity consideration: The case of COVID-19 vaccine distribution in the European Union,” Decision Analytics Journal, vol. 4, art. no. 100126, 2022, doi:10.1016/j.dajour.2022.100126.
- E. J. Emanuel, G. Persad, R. Upshur, B. Thome, M. Parker, A. Glickman, C. Zhang, C. Boyle, M. Smith, J. P. Phillips et al., “Fair allocation of scarce medical resources in the time of COVID-19,” The New England Journal of Medicine, vol. 382, no. 21, pp. 2049–2055, 2020, doi:10.1056/NEJMsb2005114.
- F. Fallucchi, M. Faravelli, S. Quercia, “Fair allocation of scarce medical resources in the time of COVID-19: What do people think?” Journal of Medical Ethics, vol. 47, no. 1, pp. 3–6, 2021, doi:10.1136/medethics-2020-106524.
- L. von Bertalanffy, General system theory: Foundations, development, applications, George Braziller, 1968.
- D. J. Teece, G. Pisano, A. Shuen, “Dynamic capabilities and strategic management,” Strategic Management Journal, vol. 18, no. 7, pp. 509–533, 1997, doi:10.1002/(SICI)1097-0266(199708)18:7<509::AID-SMJ882>3.0.CO;2-Z.
- J. Pfeffer, G. R. Salancik, The external control of organizations: A resource dependence perspective, Stanford University Press, 2003.
- C. Zamiela, N. U. I. Hossain, R. Jaradat, “Enablers of resilience in the healthcare supply chain: A case study of U.S healthcare industry during COVID-19 pandemic,” Research in Transportation Economics, vol. 93, art. no. 101174, 2022, doi:10.1016/j.retrec.2021.101174.
- J. A. Colquitt, “On the dimensionality of organizational justice: A construct validation of a measure,” Journal of Applied Psychology, vol. 86, no. 3, pp. 386–400, 2001, doi:10.1037/0021-9010.86.3.386.
- N. Daniels, J. Sabin, “Limits to health care: Fair procedures, democratic deliberation, and the legitimacy problem for insurers,” Philosophy & Public Affairs, vol. 26, no. 4, pp. 303–350, 1997, doi:10.1111/j.1088-4963.1997.tb00082.x.
- P. Chowdhury, S. K. Paul, S. Kaisar, M. A. Moktadir, “COVID-19 pandemic-related supply chain studies: A systematic review,” Transportation Research Part E: Logistics and Transportation Review, vol. 148, art. no. 102271, 2021, doi:10.1016/j.tre.2021.102271.
- M. Fattahi, E. Keyvanshokooh, D. Kannan, K. Govindan, “Resource planning strategies for healthcare systems during a pandemic,” European Journal of Operational Research, vol. 304, no. 1, pp. 192–206, 2023, doi:10.1016/j.ejor.2022.01.023.
- C. M. Harland, L. Knight, A. S. Patrucco, J. Lynch, J. Telgen, E. Peters, T. Tátrai, P. Ferk, “Practitioners’ learning about healthcare supply chain management in the COVID-19 pandemic: A public procurement perspective,” International Journal of Operations & Production Management, vol. 41, no. 13, pp. 178–189, 2021, doi:10.1108/IJOPM-05-2021-0348.
- X. Yin, İ. E. Büyüktahtakın, B. P. Patel, “COVID-19: Data-driven optimal allocation of ventilator supply under uncertainty and risk,” European Journal of Operational Research, vol. 304, no. 1, pp. 255–275, 2023, doi:10.1016/j.ejor.2021.11.052.
- F. Goodarzian, V. Kumar, P. Ghasemi, “A set of efficient heuristics and meta-heuristics to solve a multi-objective pharmaceutical supply chain network,” Computers & Industrial Engineering, vol. 158, art. no. 107389, 2021, doi:10.1016/j.cie.2021.107389.
- F. Zheng, L. Du, X. Li, J. Zhang, B. Tian, R. Jallad, “Multi-objective medical supplies distribution open vehicle routing problem with fairness and timeliness under major public health emergencies,” Management System Engineering, vol. 2, art. no. 5, 2023, doi:10.1007/s44176-023-00015-6.
- S. Reddy, S. Allan, S. Coghlan, P. Cooper, “A governance model for the application of AI in health care,” Journal of the American Medical Informatics Association, vol. 27, no. 3, pp. 491–497, 2020, doi:10.1093/jamia/ocz192.
- H. Moradi, N. Tavakolifard, S. Haghjooy Javanmard, A. Vaezi, “The imperative of preparedness in navigating health crises with a look at the pandemic of COVID-19,” Discover Public Health, vol. 22, art. no. 509, 2025, doi:10.1186/s12982-025-00911-0.
- S. T. Argaw, J. R. Troncoso-Pastoriza, D. Lacey, M.-V. Florin, F. Calcavecchia, D. Anderson, W. Burleson, J.-M. Vogel, C. O’Leary, B. Eshaya-Chauvin et al., “Cybersecurity of hospitals: Discussing the challenges and working towards mitigating the risks,” BMC Medical Informatics and Decision Making, vol. 20, art. no. 146, 2020, doi:10.1186/s12911-020-01161-7.
- M. Embrett, A. Carson, M. Sim, A. Conway, E. Moore, K. Hancock, I. Bielska, “Responses and the Lessons Learned from the COVID-19 Pandemic,” Health Research Policy and Systems, vol. 23, art. no. 38, 2025, doi:10.1186/s12961-024-01229-0.
- M. P. Sendak, M. Gao, N. Brajer, S. Balu, “Presenting machine learning model information to clinical end users with model facts labels,” npj Digital Medicine, vol. 3, art. no. 41, 2020, doi:10.1038/s41746-020-0253-3.
- A. D. Saenz, Mass General Brigham AI Governance Committee, A. Centi, D. Ting, J. G. You, A. Landman, R. G. Mishuris, “Establishing responsible use of AI guidelines: A comprehensive case study for healthcare institutions,” npj Digital Medicine, vol. 7, art. no. 348, 2024, doi:10.1038/s41746-024-01300-8.
- S. Sandhu, A. L. Lin, N. Brajer et al., “Integrating a machine learning system into clinical workflows: Qualitative study,” Journal of Medical Internet Research, vol. 22, no. 11, art. no. e22421, 2020, doi:10.2196/22421.
- M. P. Sendak, W. Ratliff, D. Sarro, E. Alderton, J. Futoma, M. Gao, M. Nichols, M. Revoir, F. Yashar, C. Miller et al., “Real-world integration of a sepsis deep learning technology into routine clinical care: Implementation study,” JMIR Medical Informatics, vol. 8, no. 7, art. no. e15182, 2020, doi:10.2196/15182.
- H. L. Lee, V. Padmanabhan, S. Whang, “Information distortion in a supply chain: The bullwhip effect,” Management Science, vol. 43, no. 4, pp. 546–558, 1997, doi:10.1287/mnsc.43.4.546.
- G. P. Cachon, M. A. Lariviere, “Capacity choice and allocation: Strategic behavior and supply chain performance,” Management Science, vol. 45, no. 8, pp. 1091–1108, 1999, doi:10.1287/mnsc.45.8.1091.
- L. Eriskin, M. Karatas, Y.-J. Zheng, “A robust multi-objective model for healthcare resource management and location planning during pandemics,” Annals of Operations Research, vol. 335, no. 3, pp. 1471–1518, 2024, doi:10.1007/s10479-022-04760-x.
- P. A. Pathak, T. Sönmez, M. U. Ünver, M. B. Yenmez, “Fair allocation of vaccines, ventilators and antiviral treatments: Leaving no ethical value behind in healthcare rationing,” Management Science, vol. 70, no. 6, pp. 3999–4036, 2024, doi:10.1287/mnsc.2022.00930.
- G. L. Tortorella, A. Prashar, J. Antony, F. S. Fogliatto, V. Gonzalez, M. Godinho Filho, “Industry 4.0 adoption for healthcare supply chain performance during COVID-19 pandemic in Brazil and India: The mediating role of resilience abilities development,” Operations Management Research, vol. 17, no. 2, pp. 389–405, 2024, doi:10.1007/s12063-023-00366-z.
- F. Goodarzian, P. Ghasemi, A. Gunasekaren, A. A. Taleizadeh, A. Abraham, “A sustainable-resilience healthcare network for handling COVID-19 pandemic,” Annals of Operations Research, vol. 312, no. 2, pp. 761–825, 2022, doi:10.1007/s10479-021-04238-2.
- Y. Birhanu, T. Gizaw, D. Teshome, B. Boche, T. Gudeta, “The mediating effect of information sharing on pharmaceutical supply chain integration and operational performance in Ethiopia: An analytical cross-sectional study,” Journal of Pharmaceutical Policy and Practice, vol. 15, art. no. 44, 2022, doi:10.1186/s40545-022-00440-0.
- P. Shi, J. E. Helm, C. Chen, J. Lim, R. P. Parker, T. Tinsley, J. Cecil, “Operations (management) warp speed: Rapid deployment of hospital-focused predictive/prescriptive analytics for the COVID-19 pandemic,” Production and Operations Management, vol. 32, no. 5, pp. 1433–1452, 2023, doi:10.1111/poms.13648.
- K. Govindan, H. Mina, B. Alavi, “A decision support system for demand management in healthcare supply chains considering the epidemic outbreaks: A case study of coronavirus disease 2019 (COVID-19),” Transportation Research Part E: Logistics and Transportation Review, vol. 138, art. no. 101967, 2020, doi:10.1016/j.tre.2020.101967.
- L. D. Hollebeek, R. K. Srivastava, M. K. Clark, S. Urbonavicius, W. M. Lim, “Crafting conceptual proposition-based contributions: The 7C framework,” Psychology & Marketing, vol. 41, no. 10, pp. 2396–2411, 2024, doi:10.1002/mar.22055.
- D. Friday, D. A. Savage, S. A. Melnyk, N. Harrison, S. Ryan, H. Wechtler, “A collaborative approach to maintaining optimal inventory and mitigating stockout risks during a pandemic: Capabilities for enabling health-care supply chain resilience,” Journal of Humanitarian Logistics and Supply Chain Management, vol. 11, no. 2, pp. 248–271, 2021, doi:10.1108/JHLSCM-07-2020-0061.
- N. A. Choudhury, M. Ramkumar, T. Schoenherr, S. Singh, “The role of operations and supply chain management during epidemics and pandemics: Potential and future research opportunities,” Transportation Research Part E: Logistics and Transportation Review, vol. 175, art. no. 103139, 2023, doi:10.1016/j.tre.2023.103139.
- L. Betcheva, F. Erhun, H. Jiang, “OM Forum—Supply chain thinking in healthcare: Lessons and outlooks,” Manufacturing & Service Operations Management, vol. 23, no. 6, pp. 1333–1353, 2021, doi:10.1287/msom.2020.0920.
- J. Venable, J. Pries-Heje, R. Baskerville, “FEDS: A framework for evaluation in design science research,” European Journal of Information Systems, vol. 25, no. 1, pp. 77–89, 2016, doi:10.1057/ejis.2014.36.
No related articles were found.