Real-Time Acquisition and Classification of Electrocardiogram Signal

(This article belongs to the Section Biomedical Engineering (BIE))
Export Citations
Cite
Islam, S. M. R. , Hossain, A. and Abdullah, A. (2022). Real-Time Acquisition and Classification of Electrocardiogram Signal. Journal of Engineering Research and Sciences, 1(11), 8–15. https://doi.org/10.55708/js0111002
Sheikh Md. Rabiul Islam, Akram Hossain and Asif Abdullah. "Real-Time Acquisition and Classification of Electrocardiogram Signal." Journal of Engineering Research and Sciences 1, no. 11 (November 2022): 8–15. https://doi.org/10.55708/js0111002
S.M.R. Islam, A. Hossain and A. Abdullah, "Real-Time Acquisition and Classification of Electrocardiogram Signal," Journal of Engineering Research and Sciences, vol. 1, no. 11, pp. 8–15, Nov. 2022, doi: 10.55708/js0111002.
Cardiovascular disease (CVD) is the leading cause of death. The transition in cardiovascular disease threatens the economies of the less developed world. An electrocardiogram (ECG) machine is a device that checks the patient's heart rhythm and electrical activity. ECG signals give crucial information about the heart and numerous cardiac problems, such as coronary artery disease, myocardial infarction, and hypertension, which can be detected with an ECG report. The success rate for cardiac disease diagnosis will rise if ECG signals can be adequately recognized and interpreted. Classic signal processing and machine learning algorithms are utilized to evaluate the ECG signal and detect distinct types of arrhythmia for early treatment and prevention of cardiovascular diseases. To provide a sustainable solution for developing countries, we need to make an accurate diagnosis device that is portable and low-cost. This research aims to create a new low-cost ECG device and interface patients with HealthyPi v3 which is a miniature raspberry pi-based vital sign monitor to record raw ECG signals. We proposed an integrated environment with classical ECG acquisition and classification techniques to obtain the preferable outcome. Also, we allowed us to assimilate with a mobile remote monitoring system to create a dynamic healthcare monitoring environment for the patients. This work implies the acquisition of real-time ECG data via HealthyPi V3 integrated with peripheral capillary oxygen saturation (SpO2) sensor and temperature sensor. The software is designed to read and analyze the hardware system-driven real-time ECG data, heart rate, blood pressure, respiratory rate, and temperature. To categorize the QRS complex of ECG data obtained and analyzed by the hardware-software system for heart disease prediction, Support Vector Machine (SVM) classifier, Convolutional Neural Network (CNN), and Recurrent Neural Network (RNN) is applied where CNN has achieved the highest accuracy while processing the signal.
1. Introduction
Every day, a considerable number of biomedical data is generated to monitor and observe the physiological status of the human body as a result of rapid technological developments and the rising use of portable monitoring devices. The physiological activity of organs, including the heart, brain, muscles, cornea, and others, is measured using these biological signals. One or more electrodes are frequently placed on the organ of interest to obtain them. The most frequent physiological signals collected from the heart and brain are the electrocardiogram and electroencephalogram (EEG), respectively.
Electrocardiography, also known as ECG or EKG, is the process of creating an electrocardiogram. It’s a graph of the voltage versus time of the heart’s electrical activity using electrodes on the skin. During each cardiac cycle, these electrodes detect the tiny electrical changes that occur due to cardiac muscle depolarization and repolarization. Several cardiac problems cause changes in the typical ECG pattern, including cardiac rhythm disturbances like atrial fibrillation and ventricular tachycardia, insufficient coronary artery blood flow such as myocardial ischemia and infarction, and electrolyte imbalances.
Diseases like these can be interpreted using ECG, making it a simple solution for a primary diagnosis of heart problems. Signals must be processed before they can be interpreted. A noisy raw signal can make it difficult to decipher the signal’s meaning. Different noise removal approaches have been implemented to remove this noise from ECG [1].
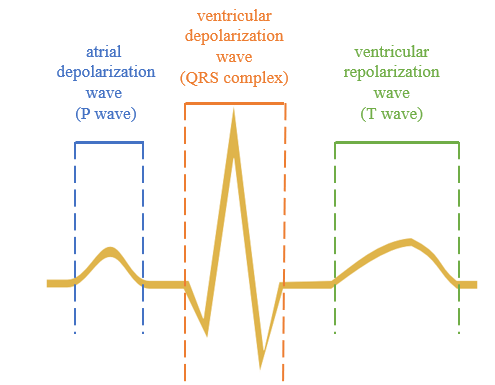
Einthoven pioneered the use of the electrocardiogram in clinical practice more than a century ago. It’s a linear recording of the heart’s electrical activity that’s been time-stamped for each cardiac cycle; an atrial depolarization wave (P wave), ventricular depolarization wave (QRS complex), and ventricular repolarization wave (T wave) are recorded in succession (Figure 1) [2]. The shape of these individual waves changes as they are recorded from various locations (leads). In either case, the order is always P–QRS–T.
While the three-lead ECG proved a valuable tool for detecting arrhythmias, it was quickly discovered that there were “silent zones” in the heart where a myocardial infarction may go undetected [3]. In 1934, Dr. Frank N. Wilson of the University of Michigan coined the phrase “central terminal.” Connecting the three limb electrodes established a central negative lead reflecting a ‘ground’ or reference terminal. The potential difference between that spot on the body and what might be thought of as zero was detected using an electrode from the body surface linked to this ground using a galvanometer. These ‘unipolar’ leads were not the same as ‘bipolar’ leads, which assess the difference in potential between two places on the body surface.
There are two remote heart monitoring device options: “on-site” and “off-site.” On-site monitoring eliminates the need to send the patient’s heart signal to a remote location for processing. On the other hand, the acquired cardiac signal must be sent to a remote site over WiFi or GSM [4]. During the integration, patients can get real-time remote monitoring and analysis of their ECG data. The cohesive transferable system allows wireless data transfer [5]. A non-intrusive, lightweight ECG monitoring equipment is essential for cardiac patients.
HealthyPi is a fully functional, open-source vital sign monitor. The HealthyPi add-on HAT (hardware attached on top) uses the Raspberry Pi as its compute and display platform, transforming it into a powerful sign-monitoring system [6]. It is the best and most recent solution for coronary disease. A sensor node is affixed to the patient’s skin to do this. Sensor nodes respond to even minor voltage variations and provide a precise and trustworthy assessment of cardiovascular status [7].
This study used a two-dimensional (2D) deep convolutional neural network to classify ECG signals. The most well-known and often-used algorithm is CNN. CNN has a structure akin to a traditional neural network modeled after the neurons found in human and animal brains. More specifically, the visual cortex of a cat’s brain is made up of an intricate pattern of cells, and the CNN simulates this pattern [8]. The short-time Fourier transform was used to first convert the time-domain ECG signals into time-frequency spectrograms, which represent the five different types of heartbeats: average beat (NOR), left bundle branch block beat (LBB), right bundle branch beat (RBB), premature ventricular contraction beat (PVC), and atrial premature contraction beat (APC). Finally, the ECG arrhythmia types were detected and categorized using the spectrograms of the five arrhythmia kinds as input to the 2D-CNN. The primary benefit of CNN over its forerunners is that it finds significant features automatically and without human supervision, making it the most popular. RNN is not thought to be as powerful as CNN. When compared to CNN, RNN has less feature compatibility [9].
When classifying various data clusters, the Support Vector Machine is employed as a training method. The algorithm underlies this classification strategy and looks for the best separation surface [10]. Finding a hyperplane that can divide data clusters so that the distance between the mean of the data points and the hyperplane is as little as possible is the classifier’s goal. SVM has often known as a maximum marginal classifier [11]. Due to its convex optimization problem, it has good generalization performance for high-dimensional data. The most used method is SVM. This is because it performs more generally for different types of data than algorithms like ANN, which have the issue of locally minimal solutions. Researchers have widely utilized SVM as a classification approach for ECG data [12-14].
Based on morphological and temporal data, a recurrent neural network is used to study the fundamental characteristics of ECG beats. Active learning is used to pick the most instructive beats and add them to the training set to increase system performance when new samples are collected. As the training set expands, the system is updated [15]. RNN instantly picks up on the subtle changes between samples from various classes. The recurrent connections enable a memory of past inputs to survive in the internal state of the network at every time step, which can subsequently be exploited to affect the final network output. The relative position and form of ECG waves can identify several kinds of ECG beats as a time and sequence. Regarding processing, the ECG beats can be categorized by looking at the relationship between time coordinates and signal point amplitudes. Due to the high correlation between ECG signal locations, it makes sense to use RNN in ECG beat categorization.
Many academics have been working on automated heart disease diagnosis for decades. Because it is a typical publicly available arrhythmia database, most of them used the MIT-BIH datasets. It’s a freely available dataset that includes reference materials for investigating heart arrhythmia detection according to industry standards, which has been used for basic research and the creation of medical devices since 1980. Many studies rely on handmade or manual feature extraction approaches exploiting the morphological characteristics and time-varying dynamics of ECG as one of the two primary phases in a conventional machine learning-based classification issue, namely feature extraction and classification [16]. Manual descriptions used a Kalman filter and Bayesian filtering strategy for high-accuracy classification, but it was confined to only two classes, i.e., binary classification. However, the accuracy and classification attained a beat-by-beat analysis technique with a class-oriented framework and an SVM classifier using Hermite transform coefficients [17, 18].
2. Materials and Methods
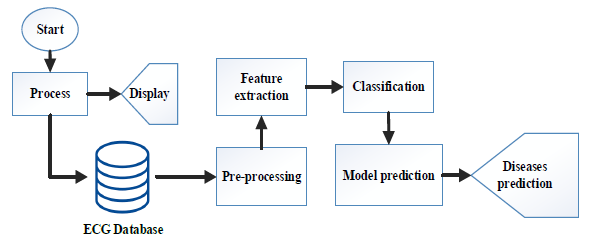
The principal flow diagrams of this research have shown in Figure 2. This work implemented a hardware and software module to create an interface between the patient and the device for collecting the ECG data from the patient. A computer, a Raspberry Pi, a HealthyPi v3 equipped with an ECG module, a Spo2 sensor, a temperature sensor, electrodes, and software platforms written in Python and Java have been used to construct the system. Later, to develop GUIs and do signal processing and categorization, Python was employed.
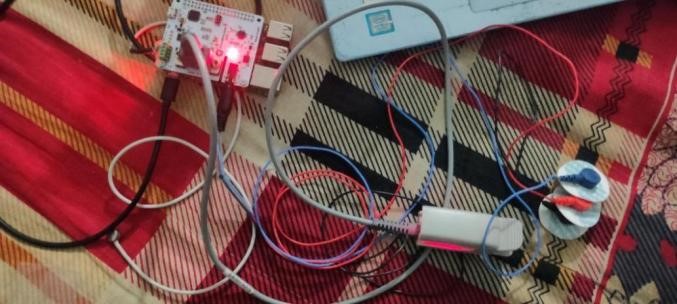
2.1. Data Acquisition
Raspberry Pi and the HealthyPi v3 module were used to collect data on the patient skin. This device employed three electrodes, as shown in Figure 2. The module was an interface, and the Raspberry Pi was the host microcontroller. A Raspberry Pi HAT called the HealthyPi v3 can also be used as a stand-alone device for medical diagnosis and treatment. With its mobility, Wi-Fi, and wearable characteristics, the third iteration of HealthyPi sets new standards in totally accessible health solutions. The device was used to assess real-time electrocardiogram data, heart rate, heart-rate variability, and breathing based on impedance pneumography, pulse oximetry, and body temperature.
The shield comes with a 3-electrode cable and a standard stereo jack for connecting the electrodes to the board. The electrode connector’s other end would connect to body-attached Snap-on electrodes [19].
The Module was attached to a Raspberry Pi and used to interface with the human body. The data was taken in the Biomedical Signal Processing Laboratory, Dept. of Biomedical Engineering, Khulna University of Engineering & Technology. This department approved the ethical issues.
2.2. Preprocessing
The suggested system’s power line noise distorts the recorded ECG data. The ECG signals’ integrity is compromised by these aberrations, making interpreting them more difficult. Even though the amplifiers employed in biomedical signal processing have a high common-mode rejection ratio (CMRR), residual Power Line Interference (PLI) noise frequently degrades ECG recordings [20]. We utilized a Bandpass filter to reduce noise from the raw ECG data. Band Pass Filters filter or isolate specific frequencies within a typical frequency band. We considered that the filter’s center frequency is 0, which determines the frequency band’s location and bandwidth. As the filter gets bigger, the frequency band it covers expands. At least two control parameters are usually present in bandpass filters: one for bandwidth modification and another for band position adjustment.
On the other hand, we have also used different filters to filter the raw ECG signal, such as the Moving Average Filter (MA) [21]. The MA filter is a standard FIR (Finite Impulse Response) filter for smoothing an array of sampled data or signals. It averages M input samples simultaneously to create a single output point.
1) It accepts M input points, computes their average, and outputs a single output point.
2) The filter introduces a certain level of delay due to the computations/calculations involved.
The Low Pass Filter function of the filter has a low-frequency domain response but a strong time domain response.
2.3. Feature extractions from ECG Signal
The process of peak detection was used to extract features. The Hamilton segment and window method were used to detect peaks. The signal is then divided using the R-peak value. Because we needed at least two ECG beats to compute separate intervals, we chose two peaks for a single segment. The remaining ECG peaks are then determined or found using the window technique. The window index falls between -90 and -10 of the R-peak value, with P standing for the highest value. Q is the lowest value in the -40 to -10 range, and T is the highest in the +25-to-+90-degree range. The wavelet component trains the model and QRS complexes. Discrete Wavelet Transform (DWT) has proven to be a valuable technique for detecting peaks. The DWT employs scale and position values based on two powers, which is the most evident distinction. Signal decomposition and reconstruction are the main concerns in DWT and inverse DWT, respectively. Low-pass and high-pass filtering with down sampling and up sampling are the essential concepts of decomposition and reconstruction. We obtained PR and RR intervals by detecting the rest of the peak.
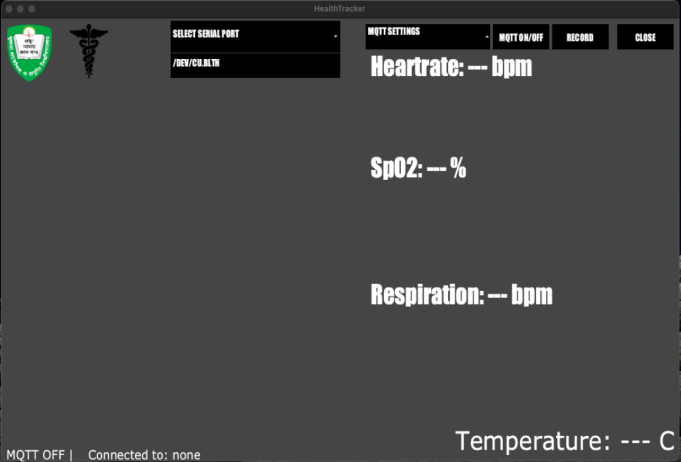
To determine heart rate and blood pressure, the patient and the HealthyPi device were both directly connected to the respiratory, cardiac, and temperature sensors. The Java Environment was then used to capture the data. The plotter was used to create a serial data plot (Figure 6). We first made a user interface using a processing plotter. The changes in blood volume, oxygen saturation, and ECG were graphed in real-time. We created a function that enables us to save the collected data as an a.csv file in JAVA GUI; the data collected by the healthy Pi v3 was visualized.
2.4. Filtering the Data
Residual Power Line Interference (PLI) noise typically impairs ECG recordings, even though the amplifiers used in biomedical signal processing have a high CMRR. These aberrations harm the integrity of the ECG signals, making them harder to interpret. Thus, a bandpass filter was designed to filter the data.
This work also attempted to use a different technique, a MA filter, to smooth the signal. Due to its ease of use and understanding, the Moving Average filter is the most used one in Digital signal Processing (DSP). The MA filter, despite being straightforward, is useful for a typical task: reducing random noise while keeping a distinct step response. Of all the available linear filters, the moving average produces a minor noise for a given edge sharpness. The square root of the number of averaged points yields the noise reduction amount. For instance, a 100-point moving average filter decreases noise by ten.
2.5. Classification
SVM, CNN, and RNN algorithms were used to classify the obtained ECG data. A Python Django application was developed. This program accepts a file as input and segments the raw ECG data into ECG beats before displaying it. After segmentation, it provides examples of the various beat kinds.
To distinguish normal and pathological beats in an ECG, recurrent neural networks were used. The main goal of this research was to make it possible to distinguish between regular and irregular beats automatically. The beat classification performance is classified using the MIT-BIH Arrhythmia Database. A large volume of standard data, such as ECG time series, is employed as inputs to the Long Short-Term Memory Network. The raw ECG dataset was separated into training and testing sub-data. The efficacy, accuracy, and capability of the technique for ECG arrhythmia identification have been proved, as well as quantitative comparisons with several RNN models.
3. Results and Discussion
The signal was collected at 20 fps speed and showed standard stability, as shown in Figure 4.
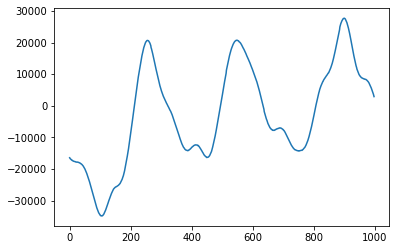
The data was then visualized using the Java environment. Serial data were plotted using the plotter, as shown in Figure 4. The data showed mild distortion, which was further removed by filtering the data. The acquired data was stored as a CSV file. Fig. 5 shows the GUI. The GUI method enables to the opening of a command or function on devices by clicking or pointing to a tiny picture, known as an icon or widget, such as tabs, buttons, scroll bars, menus, icons, pointers, and windows.
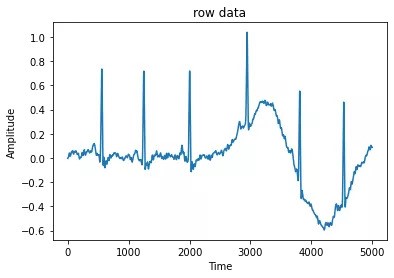
The acquired ECG, SpO2, and temperature data were plotted on a graph where the y-axis refers to amplitude, and the x-axis designates time. The graph shows the collected data for 5000 ms, and the highest amplitude obtained is 1 mv. The data showed fluctuation due to external noise and other cofactors related to the acquisition of the signal.
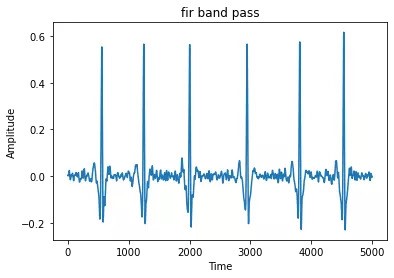
The FIR bandpass filter smoothens the obtained signal (Figure 7). As the signal was obtained by one standard lead system, the highest amplitude obtained after filtering the signal equals 0.6 mv, which is standard for one standard lead system data acquisition of ECG signal.
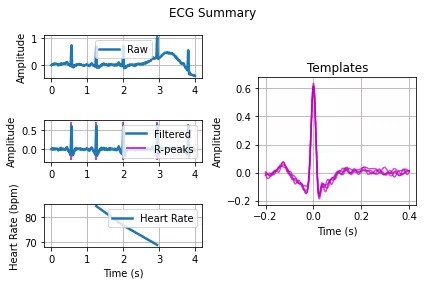
Hamilton Segmenter and the window approach were employed for peak detection, and R peak was effectively discovered. For the training model and QRS complex, we used discrete wavelet components. The heartbeat was retrieved from the signal in this case, Figure 8. The template is shown in a magenta colour. The derived maximum amplitude before and after filtering the signal was 1 mV and 0.6 mV, respectively, as shown in Figures 6 and 7. The amplitude of the signal shown in the template was 0.6 mV. The heart rate was measured by analyzing the characteristics of the obtained ECG signal, and it was found that the heart rate varied within the range of 68-85 bpm for a 4s time span.
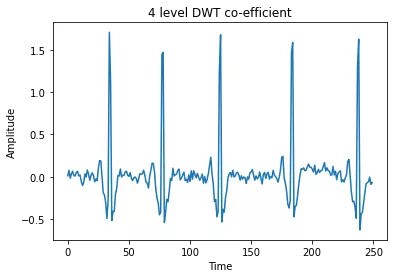
After restricting heartbeat with Hamilton Segmenter, we employed four-level DWT. Figure 9 shows a DWT that divides a signal into many sets, each with a group of coefficients that characterize the signal’s time evolution in the associated frequency band. A discrete wavelet transform decomposes a signal into several sets, each containing a time series of coefficients describing the signal’s time evolution in the corresponding frequency band.
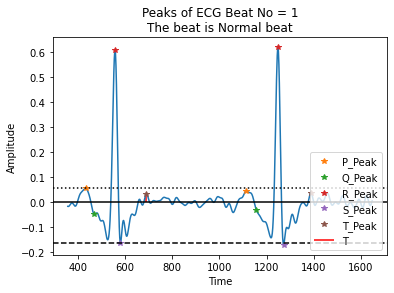
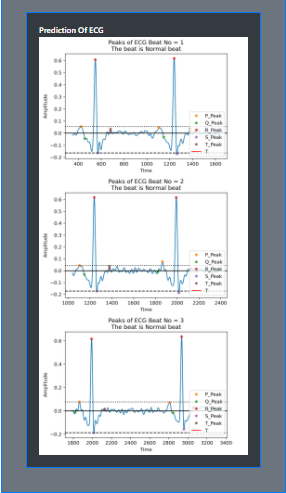
The detected peaks are classified using SVM, CNN, and RNN algorithms [22, 23]. The feature classification is shown in Figure 11, and the results of the classification performance are depicted in the Table. The result shows that the accuracy of detection using the RNN classifier is 95.62%, the CNN classifier is 96.56%, and the SVM classifier is 94.16%. From the table, CNN has shown the highest accuracy.
4. Conclusion
This study constructed a system for capturing ECG signals using the HealthyPi module in conjunction with Java script software and users. The majority of the researchers in their study used lead 12. However, we used the ensemble learning boosting strategy with two different classifiers and the lead two signals.
Table 1: Summary of the classification using different machine learning approaches.
Features methods | Lead | Number of ECG beat for training purpose | Classifier | Classification performance (%) |
Hamilton Segmenter and the window approach | Lead II: R peaks detection, ECG polynomial fitting, ST detection | ECG data sets by the proposed system (Normal: 615 patients *RBBB: 9 patients *LBBB: 32 patients Sinus Bradycardia (SB): 24 patients Atrial Fibrillation (AF): 17 patients ST segment: 6 patients *Critical Beat 1: 26 patients *Critical Beat 2: 3 patients) | RNN Training Data (75%) Testing Data (25%) | 95.62% |
Hamilton Segmenter and the window approach | Lead II: R-Peak detection, P-Peak detection, Q-Peak detection, S-Peak detection, T-Peak detection | CNN Training Data (75%) Testing Data (25%) | 96.56% | |
Hamilton Segmenter and the window approach, 4-level DWT co-efficient detection, Lyapunov exponent | Lead II: R-Peak detection, P-Peak detection, Q-Peak detection, S-Peak detection, T-Peak detection, QRS complex detection, | SVM Training Data (75%) Testing Data (25%) | 94.16% |
* Critical Beat 1: Arrhythmia with high-speed frequency signal with short-term ECG signal, Critical Beat 2: Arrhythmia with high-speed frequency signal with short-term ECG signal, RBBB: Right Bundle Branch Block; LBBB: Left Bundle Branch Block
We have acquired data from this machine for feature extractions and classifications by SVM, CNN, and RNN, such as ECG signal, heart rate, oxygen saturation, and respiration rate. The results show 95.62% accuracy by RNN, 96.56% by CNN, and 94.16% by SVM. We attempted a few different approaches to obtaining information on ECG beats. We believe that this device will meet the need for an urgent and reliable solution for remote monitoring of ECG signals and will help diagnose patients with cardiac abnormalities and assist cardiologists in analyzing patients’ heart conditions via dynamic monitoring in a real-world application.
Acknowledgment
The authors wish to thank the Dept. of Biomedical Engineering and Dept. of Electronics and Communication Engineering staff and all professors for supporting equipment and other facilities.
Conflict of Interest & Fund
The authors declare that they have no Conflict of Interest. This work was not supported in part by a grant.
- P. K. Jain, A. K.P. K. Jain, A. K. Tiwari, “Heart monitoring systems—A review”, Computers in Biology and Medicine, Volume 54,2014, Pages 1-13. https://doi.org/10.1016/j.compbiomed.2014.08.014.
- A. Gacek, “An Introduction to ECG Signal Processing and Analysis”, In: Gacek, A., Pedrycz, W. (eds), ECG Signal Processing, Classification and Interpretation, pp. 21-46, 2011. https://doi.org/10.1007/978-0-85729-868-3_2
- Z. Sankari, H. Adeli, “HeartSaver: a mobile cardiac monitoring system for auto-detection of atrial fibrillation, myocardial infarction, and atrioventricular block,” Computers in biology and medicine vol. Vol. 41, no. 4, pp. 211-214, 2011. https://doi.org/10.1016/j.compbiomed.2011.02.002
- N. Stojanovic, Y. Xu, A. Stojadinovic, L. Stojanovic, “Using Mobile-based Complex Event Processing to realise Collaborative Remote Person Monitoring. DEBS ’14,” 8th ACM International Conference on Distributed Event-Based Systems. 2014, page 225. https://doi.org/10.1145/2611286.2611306
- M. A. Mahamdy, H. B. Riley, “Performance Study of Different Denoising Methods for ECG Signals,” Procedia Computer Science, Volume 37, 2014, Pages 325-332. https://doi.org/10.1016/j.procs.2014.08.04800
- L. R. Yeh, W.C. Chen,H. Y. Chan,N. H. Lu, C. Y. Wang, W. C. Du, Y. H. Huang, S. Y. Hsu,T. B. Chen, “Integrating ECG Monitoring and Classification via IoT and Deep Neural Networks,” Biosensors (Basel). 2021 Jun 8;11(6):188. doi: 10.3390/bios11060188.
- J.J. Huang, B. Chen, B. Yao and W. He, “ECG Arrhythmia Classification Using STFT-Based Spectrogram and Convolutional Neural Network,” in IEEE Access, vol. 7, pp. 92871-92880, 2019, doi: 10.1109/ACCESS.2019.2928017.
- L. Alzubaidi, J. Zhang, A. J. Humaidi et al., ”Review of deep learning: concepts, CNN architectures, challenges, applications, future directions,” J. Big Data 8, 53 (2021).
- R. Thilagavathy, R. Srivatsan, S. Sreekarun, D. Sudeshna, P. L. Priya and B. Venkataramani, “Real-Time ECG Signal Feature Extraction and Classification using Support Vector Machine,” 2020 International Conference on Contemporary Computing and Applications (IC3A), 2020, pp. 44-48, doi: 10.1109/IC3A48958.2020.233266.
- Guijin Wang, Chenshuang Zhang, Yongpan Liu, Huazhong Yang, Dapeng Fu, Haiqing Wang, Ping Zhang, “A global and updatable ECG beat classification system based on recurrent neural networks and active learning,” Information Sciences, Volume 501, pp. 523 – 542,2019. https://doi.org/10.1016/j.ins.2018.06.062.
- F. T. Johura, S. M. R. Islam, M. Maniruzzaman and M. Hasan, “ECG signal for artrial fibrillation detection,” 2017 International Conference on Electrical, Computer and Communication Engineering (ECCE), 2017, pp. 928-934, doi: 10.1109/ECACE.2017.7913036.
- J. R. Mou, S. M. Rabiul Islam, X. Huang and K. L. Ou, “A new approach of noise elimination methodology for ECG signal,” 2017 International Conference on Electrical, Computer and Communication Engineering (ECCE), pp. 921 – 927, 2017 doi: 10.1109/ECACE.2017.7913035.
- H. Khorrami and M. Moavenian, “A comparative study of DWT, CWT and DCT transformations in ECG arrhythmias classification,” Expert Systems with Applications, vol. 37, no. 8, pp. 5751–5757, 2010. https://doi.org/10.1016/j.eswa.2010.02.033
- N. Tabassum, S. M. R. Islam, X. Huang, “Novel Multirate Digital Filter for EEG on FPGA”, 2nd International Conference on Electrical &Electronic Engineering (ICEEE), RUET, Rajshahi, Bangladesh, 19-21 December 2017. doi: 10.1109/CEEE.2017.8412848.
- Mishra et al., “ECG Data Analysis with Denoising Approach and Customized CNNs”, Sensors, vol. 22, no. 5, p. 1928, 2022. https://doi.org/10.3390/s22051928
- E. D. Übeyli, “Adaptive neuro-fuzzy inference system for classification of ECG signals using Lyapunov exponents,” Computer Methods and Programs in Biomedicine, Volume 93, Issue 3, 2009, pp. 313-321. https://doi.org/10.1016/j.cmpb.2008.10.012
- Tomasini, Marco, Simone Benatti, Bojan Milosevic, Elisabetta Farella, and Luca Benini. “Power line interference removal for high-quality continuous biosignal monitoring with low-power wearable devices.” IEEE Sensors, vol. 16, no. 10, pp. 3887-3895, 2016.
- K. Tanji, M.A.G de Brito,M.G. Alves,R. C. Garcia, G.L. Chen, N. R. N. Ama, “Improved Noise Cancelling Algorithm for Electrocardiogram Based on Moving Average Adaptive Filter,” Electronics vol. 10, no. 19, pp. 1 – 18, 2021, . https://doi.org/10.3390/electronics1019236
- N. Wang and S. Sun, “Event-triggered sequential fusion filters based on estimators of observation noises for multi-sensor systems with correlated noises”, Digital Signal Processing, vol. 111, p. 102960, 2021. https://doi.org/10.1016/j.dsp.2020.102960
- S. M. Anwar , M. Gul, M. Majid, M. Alnowami, “Arrhythmia Classification of ECG Signals Using Hybrid Features,” Comput Math Methods Med. 2018 Nov 12;2018:1380348. doi: 10.1155/2018/1380348. PMID: 30538768; PMCID: PMC6260536.
- C. Jha and M. Kolekar, “Cardiac arrhythmia classification using tunable Q-wavelet transform based features and support vector machine classifier”, Biomedical Signal Processing and Control, vol. 59, p. 101875, 2020. https://doi.org/10.1016/j.bspc.2020.101875
- A. Darmawahyuni et al., “Deep Learning with a Recurrent Network Structure in the Sequence Modeling of Imbalanced Data for ECG-Rhythm Classifier”, Algorithms, vol. 12, no. 6, p. 118, 2019. https://doi.org/10.3390/a12060118
- Z. He, Y. Chen, D. Zhang, W. Yin, and H. R. Karimi. “A new intelligent ECG recognition approach based on CNN and improved ALO-SVM.” Signal, Image and Video Processing (2022): 1-8. https://doi.org/10.1007/s11760-022-02300-5