CFD Analysis of Data Center Hall Cooling Performance under Normal and Failure Modes with Control Strategies and Airflow Leakages
(This article belongs to the Special Issue on Special Issue on Multidisciplinary Sciences and Advanced Technology 2025 and the Section Mechanical Engineering (MEE))
Export Citations
Cite
Surwase, S. A. , Badde, S. and Balakrishnan, R. (2026). CFD Analysis of Data Center Hall Cooling Performance under Normal and Failure Modes with Control Strategies and Airflow Leakages. Journal of Engineering Research and Sciences, 5(1), 9–28. https://doi.org/10.55708/js0501002
Sushil Ashok Surwase, Suribabu Badde and R. Balakrishnan. "CFD Analysis of Data Center Hall Cooling Performance under Normal and Failure Modes with Control Strategies and Airflow Leakages." Journal of Engineering Research and Sciences 5, no. 1 (January 2026): 9–28. https://doi.org/10.55708/js0501002
S.A. Surwase, S. Badde and R. Balakrishnan, "CFD Analysis of Data Center Hall Cooling Performance under Normal and Failure Modes with Control Strategies and Airflow Leakages," Journal of Engineering Research and Sciences, vol. 5, no. 1, pp. 9–28, Jan. 2026, doi: 10.55708/js0501002.
Data centers have become the backbone of an increasingly digitized world, supporting the rapid growth of cloud computing, big data, IoT, 5G, and other emerging IT technologies, with rising demand and innovations in AI and ML reinforcing their significance. Data centers are energy intensive, with data processing and storage accounting for 3 to 4% of global energy consumption, which continues to grow annually. Improving their efficiency is therefore a major industrial challenge, offering substantial cost savings. The modern data center involves an intricate interaction between various mechanical, electrical and control systems. The many possible operating configurations and non-linear interdependencies make it challenging to understand and optimize energy efficiency. In the present study, computational fluid dynamics (CFD) analysis is used to assess the cooling performance of a dynamically controlled data center hall with non-raised floor configuration and hot aisle containment (HAC) strategy. The operation of air-cooling units (ACUs) is dynamically regulated in response to the data hall IT load through an integrated network of sensors and controllers. These controllers modulate ACU fan speed and chilled water flow rates to maintain the IT cabinet inlet air temperature within each ACU’s zone of influence and below the specified threshold. This control strategy, informed by real-time temperature and pressure sensor data, ensures desired thermal conditions within the data hall while optimizing overall cooling power consumption. This study focuses on two modes of operation for the purpose of design analysis, i.e., normal mode (NM) and failure mode (FM). Based on CFD simulation results, the present paper highlights the effects of control strategy used for ACUs, cooling airflow leakage, recirculation of hot air on the performance of the data hall cooling design. Different simulation scenarios, which accommodate all possible combinations during NM and FM of operation i.e., with & without control and with & without leakages are evaluated to understand the significance of various design parameters, leading towards the right design. Results show that the control strategy delivers approximately 9.89% energy savings in normal mode, while leakages significantly degrade performance during failure mode.
1. Literature Review
The information technology (IT) sector and related technologies are changing at an exponential rate. Data centers have become a key infrastructure to support the rapid development of cloud computing, big data, internet of things (IoT), 5G, Metaverse etc. [1]; thus, data centers serve as the backbone of information in an increasingly digitized world [2]. The demand for data center services has gone up rapidly [3]. The advancements in technologies such as artificial intelligence (AI), machine learning (ML) leading to development of smart appliances, digitalization of transport, buildings and various industries simply reinforce its relevance [4]. Data centers are energy intensive buildings whose size and number have increased in response to the growing demands of a digital economy [5]. Data processing and storage represent 3 to 4% of global energy consumption, and this consumption is significantly growing year on year [6], [7], [8].
Data centers consume a lot of energy. Due to the large energy demands, data center generates a large amount of heat. Thus, cooling is a major aspect of data center design. Enhancing the efficiency of data centers is a significant challenge in the industry, as it can result in significant cost savings [9]. The modern data center involves an intricate interaction between various mechanical, electrical and control systems. The many possible operating configurations and non-linear interdependencies make it challenging to optimize energy efficiency [10].
1.1. Literature Review
The concept of hot and cold aisles was first introduced and formalized in [11], where it was demonstrated that an alternating arrangement of cold and hot aisles significantly improves data center cooling efficiency compared to earlier layouts that lacked floor planning and led to serious reliability problems. One of the earliest applications of CFD to data center cooling was presented in [12], at a time when such studies were scarce. The study proposed an alternative cooling arrangement with ceiling mounted heat exchangers, offering space saving advantages over conventional modular air conditioning unit designs. Using experimentally validated CFD simulations, the authors demonstrated the ability to predict system inlet temperatures and identify hot spots, highlighting the importance of CFD based design for reliable cooling in future high power and high density data center. Their methodology combined with experimental validation, became a benchmark for subsequent academic and industrial CFD studies. The paper [13] on airflow and cooling within data center provides one of the earliest comprehensive formulations of airflow management from a fluid mechanics perspective. The study evaluated how raised floor height, CRAC unit, tile layout and open area, and underfloor obstructions influence plenum airflow, noting that deliberate obstructions such as inclined solid or perforated partitions can beneficially redirect flow. The work also addressed above floor management strategies to prevent hot air recirculation into rack inlets, including sufficient cold air supply, air curtains, partitions, drop ceilings, and ducted racks. The work established the theoretical foundation for many subsequent CFD studies.
In [14], a literature review was conducted to examine corridor isolation and the integration of Building Information Modelling (BIM) with Computational Fluid Dynamics (CFD) in data centers. The authors identified a research gap in studies combining BIM and CFD for corridor isolation. Their findings revealed that hot aisle containment (HAC) provides greater cooling efficiency, lower power usage effectiveness (PUE), and improved working conditions compared to cold aisle containment (CAC). CFD simulations showed that leakage size and position, significantly influence airflow patterns and cooling capacity, while increased supply airflow does not mitigate leakage losses. Cold corridor isolation was found suitable for low-load data centers (up to 5 kW per cabinet) but can reduce personnel comfort, whereas hot aisle isolation is more efficient and preferred in high-load environments (up to 10 kW per cabinet). The study concluded that integrating BIM and CFD offers a reliable approach for designing and optimizing thermal management in data centers.
A comparative CFD analysis of three airflow-organization strategies: underfloor precision supply, inter-column supply, and rack backplane cooling was carried out in [15]. The investigation introduced thermal performance indices such as ASE, ARE, MCRI, RTI, SHI and RHI to evaluate system effectiveness. Results showed that adopting either CAC or HAC increased ASE and reduced SHI values, while the backplane configuration eliminated hot spots without requiring full aisle containment. Optimizing airflow organization scheme, significantly enhances cooling efficiency and energy utilization while minimizing hot spots. The HAC scheme showed the best thermal and energy performance, offering valuable insights into selecting efficient cooling strategies. A similar numerical and experimental study [16] compared HAC and CAC in legacy data centers, focusing on thermal performance and air leakage. The results showed that HAC outperformed CAC at a 15% leakage rate, delivering a 24.9% thermal performance improvement and allowing the supply air temperature in the HAC system to be raised by 2°C. The authors also noted that accurately measuring and validating leakage is challenging and therefore used the IT supply temperature range as a practical indicator of relative leakage effects. Furthermore, [17] conducted a CFD based comparison of raised floor and hard floor configurations with HAC in high density data centers, demonstrating that the raised floor HAC system delivers superior thermal performance over hard floor HAC system. The results showed that adopting a raised floor improves air distribution efficiency by 28% and reduces recirculation ratio by around 40%.
In [18], a combined cooling system that integrates heat storage, waste-heat recovery and different renewable energy sources with conventional air conditioning was modeled. The proposed system reported approximately 16% annual energy savings, an increase in system COP from 3.9 to 4.6, and a reduction of PUE from 1.36 to 1.30. The paper [19] investigated two improvement methods to achieve a uniform temperature distribution in data centers using CFD: (i) installing adjustable underfloor deflectors beneath perforated tiles with varied opening ratios to balance cold-air distribution, and (ii) replacing standard floor grilles near cooling units with fan-floor modules to enhance airflow delivery. Simulation results showed that the deflector method increased airflow to front end cabinets by 18.1% and reduced rear end airflow by 5.1%, while the fan-floor approach achieved a 4.9% increase and 3.8% reduction, respectively. Both methods improved thermal uniformity and showed that airflow is a key factor that influences cabinet temperature, reducing cabinet maximum outlet temperatures by up to 2.81°C.
The Kao Data case study [20] demonstrated the use of CFD based digital twin modelling (via Future Facilities’ 6SigmaDCX) to validate and optimize the indirect evaporative cooling (IEC) design of a high-density, 100% free-cooled sustainable colocation data center. The study conducted both internal and external airflow analyses: internally, the data hall whitespace was evaluated under normal operation and failure mode scenarios to verify cooling efficiency and uniform airflow distribution; externally, a range of wind speeds and directions were simulated to assess the risk of recirculation. Simulation analyses confirmed that the IEC system could maintain target temperatures without mechanical refrigeration, achieving a PUE of approximately 1.2. The study highlighted the value of CFD in enabling design optimization and refining the decision-making process. AKCP [21] illustrates the broader value of CFD to optimize data center airflow and thermal performance. The study emphasizes four key analyses: design airflow analysis to identify hotspots and uneven distribution, “Day One” analysis for early operational optimization, equipment switchover simulation to ensure resilience during cooling unit failures, and leakage analysis to reduce bypass losses and notes that simulation-driven optimization can lower operational costs and carbon footprint.
A new type of ducted HAC system for data center rack cooling was proposed and experimentally evaluated in [22]. The authors studied the effects of different hot duct containment configurations, door states, diffuser types, blanking panel percentages, and airflow volume scenarios on air distribution and cooling performance. They proposed average inlet rack temperature, standard deviation of temperature and temperature difference across rack as practical metrics instead of percentage leakage. Results showed that ducted containment offered performance close to that of full airtight containment but at a lower cost. The paper [23] combined experimental testing with physics based modelling to quantify cold air bypass and determine the optimal DP across aisle containment in data center. The results showed that even with containment, substantial bypass can occur through the rack itself, with bypass airflow reaching up to 20% of the ACU supply. The paper demonstrated that practical mitigation measures such as improved rack design and blocking leakage paths reduced power consumption by up to 8.8%, while optimizing the DP across the cold and hot aisles delivered up to a 16% reduction in power consumption. The authors of [24] conducted a CFD study of a data center with cold aisle containment (CAC), validated by experiments, to assess the impact of leakage. They argued for including realistic fan curves (both server and CRAC fans) in models, noting that fixed flow boundary conditions are a poor approximation in CAC systems. Their findings showed that rack level leakage can cause an inlet temperature rise of about 4°C, and identified a critical leakage threshold of approximately 15%, above which the containment allows so much hot air to recirculate that the benefits of containment are completely lost. In [25], validated CFD modelling was used to assess airflow improvements in a raised floor data center, testing blanking panels, vertical partitions and partial cold aisle enclosure. Partial cold aisle enclosure produced the greatest benefit, allowing a 3°C increase in supply air temperature while maintaining acceptable rack inlet conditions, thereby improving energy efficiency. The study also noted that RTI can be unreliable for identifying bypass or recirculation in complex airflow scenarios. In [26], the effect of CRAC unit placement by comparing units placed in line with the rack rows to units placed perpendicular to the rack rows was investigated. Using RTI, SHI, and RHI as performance indicators, it was found that the perpendicular layout improves airflow uniformity from perforated tiles, reduces hot air recirculation and cold air bypass, and significantly enhances overall cooling performance.
Advanced cooling control strategies for data centers with raised floors and HAC, proposing a decentralized MPC controller design to improve thermal management was examined in [27]. The approach used a dynamic thermal model and zone based control structure to regulate CRAC blower speeds and supply air temperatures. The decentralized control system structure lowers the risk of failure associated with centralized controllers and maintains acceptable rack inlet temperatures while reducing cooling power consumption. In [28], the concept of a smart cooled data center with variable capacity cooling system to allocate cooling dynamically where and when required was proposed. The cooling system consists of adjustable vents, sensors for real time temperature and pressure monitoring and CRAC units with VFD for fans speed and three way valves for chilled water control. Later, [29] implemented and experimentally tested this distributed sensor network coupled with CRAC control in a raised floor data center, reporting a 50% reduction in cooling power consumption and a 25% cost reduction in space and power.
The thermal performance of air cooled data centers under raised floor and non-raised floor configurations was numerically evaluated in [30]. They found that a non-raised floor design with overhead supply and overhead return strategy gives the best thermal performance. They also recommend using overhead supply and return even in raised floor setups, because obstructions (such as pipes and cables) in the underfloor plenum (should be used for only housing pipes and cable) significantly affect air flow distribution. Importantly, their results showed that using a ceiling return is better than a room level return for both raised floor and non-raised floor design.
The effect of air flow leakage from HAC system on their cooling performance was analyzed by the author of [31]. He evaluated the influence of leakage area, supply air ratio and rack cooling load on the performance of HAC system and found that leakage areas have the largest impact on the performance. An increase in leakage area raises the rate of air leakage, while the nature and location of the leakage paths alter airflow patterns, both of which negatively impact the cooling performance. He also finds that simply increasing supply airflow only reduces temperature of hot air exiting and does not mitigate leakage, and that varying rack cooling loads has little impact on leakage rates. The authors of [32] investigated airflow leakage in CAC and HAC systems. They introduced a Leakage Impact Factor (LIF) to quantify and rank leakage paths such as gaps beneath racks, above racks, and around containment doors. They assumed no leakage through the racks to isolate the effect of containment leakage. Their results showed that leakage beneath racks is the largest contributor to unwanted heat transfer into cold spaces, and they concluded that slight over provisioning of pressure differential is required to mitigate leakage effects. The authors of [33] motivated by experimental data showing air recirculation from the hot aisle to the cold aisle through the gap beneath server cabinets, investigated how tile perforation area, CRAC provisioning, leakage pressure gradients, and CAC affect cooling performance. Results indicate that even small under-cabinet leakage can reduce cooling effectiveness, with the effect being particularly sensitive to under provisioned conditions.
In [34], the authors demonstrated that properly sealed cold aisle containment (CAC) supports higher server heat loads (25.2 kW/cabinet) compared with standard hot aisle/cold aisle layouts (14.6 kW/cabinet). Their research also highlights the critical role of sealing accessories such as grommets and blanking panels, and unused U-slot closures being crucial for improving containment performance. In [35], the authors evaluated the effect of partial aisle containment in both hard floor and raised floor data center layouts under two supply flow rates, 100% and 50%. Their results showed that at a 100% flow rate, the top or side cover fully prevented recirculation in the raised floor configuration, while only reducing it in the hard floor configuration. However, at 50% flow, hard floor setup developed hotspots at the row ends: The side cover improved performance for hard floor layouts and the top cover worsened recirculation. In raised floor configurations partial containment remained beneficial over an open aisle under reduced airflow, with the side cover offering the best results and the top cover providing little improvement.
A containerized data center using CAC with an airside heat exchanger and waterside evaporative water chiller to improve performance in tropical and subtropical regions was demonstrated in [36]. CFD simulations evaluated temperature distribution and thermal performance under varying inlet air temperatures and velocities. Results showed that supply air temperature had minor impact, while inlet air velocity strongly influenced air distribution and thermal management. Overall, the overhead downward flow system with CAC significantly enhanced air distribution and thermal performance in large scale data centers. A comprehensive CFD based analysis of a real data center comprising 208 racks was conducted by authors of [37] to assess how airflow and thermal performance change under varying thermal loads and air supply velocities. They simulated four distinct case studies: two with spatially varying heat loads and two under uniform load, each tested with both maximum and minimum air velocity conditions. Their results showed that while operating CRAC units at maximum airflow can successfully cool the room, it does so at a high energy cost. Consequently, the authors argue that instead of costly CRAC upgrades, sustainability can be improved by optimizing rack layout such as removing selected end of row racks and thereby eliminating hot spots by improving airflow.
According to the authors of [38], the standard k–ε turbulence model is particularly well suited for turbulent flows due to its approach for calculating turbulent viscosity and conductivity. It is also the most extensively validated and commonly implemented model in commercial CFD codes. Furthermore, [39] report that previous studies have demonstrated the k–ε turbulence model outperforms the SST, k–ω, RSM, and RNG k–ε models. The paper [40] focused on improving the accuracy of CFD simulations for data center airflow by comparing different turbulence models, including the widely used k–ε model, Reynolds Stress Model (RSM), and Detached Eddy Simulation (DES). Using a full-scale data center test facility, the CFD results were validated against the experimental measurements. The study found that while the k–ε model captures general flow patterns, it fails to predict low velocity zones present above server racks. The differences in flow fields predicted by the different turbulence models are mostly observed in areas far from the main components of the data center. RSM and DES produced very similar results, with RSM being more computationally efficient and thus recommended for data center airflow modeling. A CFD based study to enhance the design of water cooled data centers using a rear door air to liquid heat exchanger for a 40 kW server rack was conducted in [41]. The simulation, performed with ANSYS and the RNG k-ε turbulence model, showed that inlet air temperature strongly affects rack thermal performance. The rear door liquid cooling system effectively reduced outlet air from about 40°C to near room temperature of 24°C, efficiently handling the full heat load without additional room cooling.
Finally, [42] states that thermal airflow within data centers exhibits inherently complex behavior with recirculating flow. Considering an inlet velocity of 1 m/s at the supply vents and a rack height of 2.4 m, the resulting Reynolds number is approximately 10⁵, indicating turbulent flow.
1.2. Role of CFD in Data Center Design
The CFD simulation plays an important role in data center design [43]:
- Virtual Design and 3D Analysis:Minimize rework by testing the design or design changes prior to implementation. Helps to validate and analyze design effectiveness through detailed 3D analysis of air flow and heat transfer in a data center.
- Performance-Based Analysis:Identifies issues with data center performance, such as improper air flow (excess or insufficient supply of cold air, bypass, recirculation of hot air, mixing of cold and hot air) during the design phase.
- What-if Scenarios:Using predictive results provided by CFD simulation, design and what-if scenarios can be evaluated, minimizing risk of failure such as server overheating and helps in identification of potential failures, which leads to an accurate design.
1.3. Raised Floor Versus Non-Raised Floor Data Hall
Data centers should be designed to operate at an optimal temperature for the highest efficiency of equipment. There are various cooling design approaches such as uncontained room cooling, CAC, HAC, in-row cooling, direct to chip cooling, immersion cooling each having advantages and disadvantages over one another. Irrespective of the cooling approach used, a data hall can be either raised-floor or slab floor (non-raised floor). Researchers continue to debate whether raised floor or non-raised floor configurations provide a better supply air path, with no clear conclusion yet. The thermal performance depends on the cooling conditions and IT environment, and although both approaches reduce loss of cooled air, they differ in practical implementation and operation [17]. The topic of raised floor versus slab floor construction is a topic that often sparks heated discussions in the data center industry as both having advantages and disadvantages over one another. Earlier, almost all the data centers used raised floor. In recent years, non-raised floor data center have gained popularity. The decision to go with raised floor or non-raised floor data centers is now driven by operational objectives, business objectives, business needs and market demands [44].
1.4. Scope of Study
In the present study, CFD analysis is used to assess the cooling performance of a dynamically controlled data hall with practical leakages, non-raised floor configuration and HAC strategy. The operation of air cooling units (ACUs) is dynamically regulated in response to the data hall IT load through an integrated network of sensors and controllers. These controllers modulate ACU fan speed and chilled water flow rates to maintain the IT cabinet inlet air temperature within each ACU’s zone of influence and below the specified threshold. This control strategy, informed by real-time temperature and pressure sensor data, ensures stable thermal conditions within the data hall while optimizing overall cooling power consumption.
This study focuses on two modes of operation for the purpose of design analysis, i.e., normal mode (NM) and failure mode (FM). In NM steady state operation, all the ACUs are functional. During FM of operation, a designated number of cooling equipment are offline in the worst-case scenario. Both modes operate with 100% IT loads with uniform distribution of load in data hall.
Based on CFD simulation results, the present paper highlights the effects of control strategy used for ACUs, cooling airflow leakages and recirculation of hot air on the performance of the data hall cooling design. Results from different simulation scenarios, which accommodate all possible combinations during NM and FM of operation i.e., with & without control and with & without leakages are evaluated to understand the significance of various design parameters, leading towards right design. Data center metrics such as ASHRAE (American Society of Heating, Refrigerating and Air-Conditioning Engineers) and SLA (Service Level Agreement) compliance are plotted for all simulation scenarios.
1.5. Novelty and Contribution
While numerous prior studies have examined thermal behavior and airflow management in data centers, most rely on highly simplified models of data halls (e.g. limited number of IT Cabinets, idealized geometric layouts or reduced scale representations), overlooking the complexity of real operational environments. Existing literatures predominantly focuses on raised floor configuration and CAC. Only a few investigations addresses non-raised floor facilities with HAC designs, that gained popularity and are increasingly adopted in modern data centers but remain underrepresented and less thoroughly investigated. Moreover, most prior studies typically assume fixed ACU fan speeds and constant chilled water flow rates, failing to explore the dynamic optimization crucial for energy efficiency. To the author’s knowledge, studies that do incorporate control often omit details of the control strategy, leaving its impact largely unexplored.
Addressing these gaps, the novelty of the present study lies in its comprehensive, holistic CFD simulation of a dynamically controlled, existing full-scale data hall comprising 308 IT cabinets configured with a non-raised floor and HAC design, thereby offering a level of practical complexity rarely addressed in previous works. A dedicated control strategy for optimizing ACU fan speed and chilled water flow rate is developed, described in detail, and its impact on overall energy consumption is quantified. Finally, unlike prior studies, which typically examine leakage effects, equipment failures, or normal steady state operation in isolation, this research provides a holistic evaluation of data hall performance under both NM and FM, including the practical leakages and active control strategy. By integrating real scale, dynamic control and multi-scenario operation, these contributions advance the state of knowledge by offering practical insights into the design, operational control strategy, and optimization of large-scale modern data centers.
2. Methodology
The air flow and temperature distribution within the data center are governed by the fundamental principles of conservation of mass, momentum, and energy. The full mathematical formulation and derivation of the Navier-Stokes equations (momentum conservation) and the energy conservation equation are omitted here, as these fundamental equations are well established and comprehensively documented in standard CFD books and literature [45], [46], [47], [48]. However, the underlying physics, key assumptions, the selection of the turbulence model, and the details of the computational approach including discretization, solving procedures, and convergence criteria critical to this simulation are discussed in detail in the following sections.
2.1. Governing Equations
The computational model is based on conservation laws, specifically the continuity, momentum, and energy equations, supplemented by the ideal gas equation of state. These equations collectively describe the steady state motion of an incompressible Newtonian fluid (air) and the associated heat transfer by the active information technology (IT) equipment, along with significant auxiliary sources such as uninterruptible power supplies (UPS) and lighting systems. The analysis considers a three-dimensional domain. Key assumptions include modeling the working fluid air as an ideal gas, treating the fluid flow as incompressible and turbulent, and assuming steady-state heat transfer process.
The mass balance (or continuity equation) ensures that mass is conserved within the fluid domain . It dictates that for any control volume within the simulation, the rate at which mass enters must equal the rate at which it leaves, plus any change in mass stored inside. This balance is fundamental for calculating the pressure field in incompressible flows and the density changes in compressible flows, ensuring a physically realistic flow pattern. The momentum balance applies Newton’s second law to fluid motion, stating that the net force on a fluid element equals its rate of momentum change. These forces include surface forces like pressure gradients, viscous stresses (internal friction), and body forces like gravity. By solving this balance, CFD determines the fluid’s velocity field which along with the pressure field describes the flow dynamics. The energy balance ensures that total energy is conserved by accounting for all energy transfers based on first law of thermodynamics. It relates changes in internal energy to heat transfer (conduction and convection) and the work done by pressure and viscous forces. This equation is solved to determine the temperature distribution throughout the fluid domain, making it essential for simulations involving heat transfer, and fluid property variations caused by temperature changes.
Modeling air as an ideal gas allows the simulation to account for the buoyancy effect by providing the necessary density variation caused by changes in temperature and pressure within the flow field. The equation of state is crucial for solving the system of governing equations, as it provides a way to calculate the density required in the continuity and momentum equations, based on the pressure and temperature calculated by the momentum and energy equations.
A steady state analysis is performed by setting all the time derivatives to zero ( = 0). This choice is justified because the primary objective is to predict the long term, time averaged thermal equilibrium and characteristic mean operating temperatures of the data hall, providing a computationally efficient approach.
As air velocities in the data hall are typically low (with Mach number, Ma < 0.3), incompressible flow assumption is applied. This neglects density variations due to pressure changes, which is a significant simplification used in the continuity and momentum equations.
2.2. Turbulence Modelling
The air flow patterns in data centers are highly complex and recirculating. Based on typical operating conditions such as an air inlet velocity of 1 m/s at supply vent and IT cabinet height of 2.4 m, the Reynolds number is approximately 105, clearly indicating a turbulent flow regime [42].
To computationally model the inherently turbulent flow characteristic of large indoor spaces such as data hall, these fundamental principles are typically expressed in their Reynolds-Averaged Navier–Stokes (RANS) form. RANS models decompose each instantaneous flow variable (e.g., velocity, pressure, temperature etc.) into a time-averaged mean component and a fluctuating component. This time-averaging process introduces the Reynolds stress tensorinto the momentum equations, which represents the effective momentum transfer due to turbulent fluctuations.
Since the Reynolds stress terms are unclosed (i.e., they introduce more unknowns than available equations), a turbulence model is required. Specifically, the Reynolds stress tensor, is a symmetric second-order tensor and thus introduces six independent unknown components into the three RANS momentum equations. These six unknowns cannot be determined solely by the existing four RANS equations (continuity and three momentum equations).
A common and robust approach is to employ the Boussinesq turbulence hypothesis, which postulates that the Reynolds stresses are directly proportional to the mean rate of strain tensor, analogous to the relationship between viscous stress and strain for a laminar flow. This hypothesis effectively replaces these six unknowns with a single scalar quantity, the eddy viscosity . The major drawback of this hypothesis is that it assumes the turbulent flow is isotropic (the same in all directions), which is often not true for complex engineering flows and cannot accurately predict stresses in highly anisotropic flows where turbulent stress and mean strain are misaligned (e.g., highly swirling or separating flows). Despite this simplification, it works remarkably well for a vast range of engineering applications, including the data center flows.
$$
-p\,\overline{u_i’ u_j’}
=
2\mu_t\,\overline{S}_{ij}
-\frac{2}{3}\rho k\,\delta_{ij}
\tag{1}
$$
Where, is the mean rate of strain tensor, is the fluid density, is the turbulent kinetic energy , is the Kronecker delta. With the six Reynolds stress components now expressed in terms of , and the new variable (which itself depends on ), the closure problem is reduced from six unknowns to one primary unknown, the eddy viscosity .
Unlike molecular viscosity , eddy viscosity is a flow property, not a fluid property, which varies throughout the flow field and is computed from averaged flow variable [49], necessitating the use of two-equation models for closure. For instance, the widely-adopted Standard model solves two auxiliary RANS transport equations, one for the turbulent kinetic energy () and another for turbulent kinetic energy dissipation rate () [50]. These two variables are then used to calculate the turbulent viscosity, , thus achieving closure for the RANS equations.
$$
\mu_t = C_{\mu}\,\rho\,\frac{k^2}{\varepsilon}
\tag{2}
$$
While the Standard model is utilized for its robustness and wide applicability, it is essential to acknowledge its inherent limitations. The model is known to perform less accurately for flow with strong adverse pressure gradients, substantial boundary layer separation, rotating fluid flows or flow over curved surfaces. This model also assumes a fully turbulent flow regime, an assumption that may not hold across all regions of the airflow within the data center.
The standard turbulence model remains the most commonly used approach for CFD simulations of data centers despite its well-known limitations because it offers a uniquely advantageous combination of numerical robustness, computational efficiency, and extensive historical validation. Its exceptional stability makes it unlikely to diverge or crash even on complex or coarse meshes, an attribute that is particularly valuable in data center design where many preliminary configurations must be evaluated rapidly and stability is prioritized over marginal increases in accuracy. The model is also computationally inexpensive, adding only two additional transport equations to the RANS formulation, whereas more advanced models such as the Reynolds stress model (RSM) require solving seven additional equations (six for the Reynolds stress tensor components plus one for epsilon), significantly increasing memory requirements and runtime for the large computational domains typical of data halls. Furthermore, the model’s empirical constants have been calibrated over decades against a wide range of turbulent flows, and commercial CFD packages have optimized their implementations extensively, reinforcing its position as an industry-standard model [51]. Although it fails to perfectly capture the physics of small, highly anisotropic eddies with high fidelity, it typically provides sufficiently accurate predictions of mean air flow and mean temperature distributions to identify hot spots, characterize recirculation, and support overall decision making. In practice, higher-fidelity alternatives such as the realizable or RNG , the SST model, or the RSM are employed when detailed accuracy in near-wall behavior, swirl, turbulence anisotropy or modeling of flow inside a server rack is required, but for large-scale airflow in typical data halls, the standard model continues to offer the most effective balance between stability, computational cost, and engineering reliability and practicality.
2.3. Near-Wall Treatment and Wall Functions
The simulation employs the Standard (SKE) turbulence model coupled with the wall function approach for near-wall modeling. This coupling is necessary because resolving the steep velocity profiles within the thin viscous sublayer of a turbulent boundary layer requires an extremely fine mesh (viscous sublayer resolving approach, ), leading to prohibitively high computational cost. Moreover, the SKE model is not formulated for low Reynolds number wall treatment, its core assumptions specifically the local isotropy of turbulence (turbulence is highly anisotropic near wall) and the validity of the – transport equation (The – transport equation is unsuitable near the wall because it is derived under the assumption of high local Reynolds numbers. But near the wall, viscous effects dominate, leading to low local Reynolds numbers) break down in the viscous sublayer and buffer region. To achieve computational feasibility, wall functions are used. These are semi-empirical formulas based on the universal law of the wall, effectively bypassing the need to resolve the viscous sublayer with the mesh. The universal law of the wall describes the mean velocity profile of turbulent flow close to the wall, stating that when the mean flow velocity () and distance from the wall () are scaled using friction velocity and kinematic viscosity to yield the dimensionless velocity () and dimensionless distance (), the resulting relationship becomes universally constant and independent of the overall Reynolds number. This universal velocity profile is characterized by a linear relationship in the viscous sublayer , transitioning through a buffer region and a logarithmic relationship in the log layer.
This approach requires the first grid cell center to be located within the turbulent logarithmic region of boundary layer, satisfying the meshing guideline of 30 < < 300 . This compromise is acceptable for data hall flows, which are generally high Reynolds number and attached.
2.4. Thermal Modelling and Buoyancy
Although a highly accurate thermal model could include the heat source at individual servers, a black box approach was utilized for each IT cabinet in this study, as the inclusion of server level heat details only offered a marginal contribution to overall data center thermal accuracy [52].
Furthermore, buoyancy effects, which are highly significant in thermally stratified air cooled data halls, are incorporated using the Boussinesq approximation. This approximation simplifies the equations by treating the fluid density () as constant in all equations, except within the gravity (buoyancy) term of the momentum equation. In this term, density is assumed to vary linearly with temperature.
$$
\rho = \rho_{\mathrm{ref}}
\left[1 – \beta \left(T – T_{\mathrm{ref}}\right)\right]
\tag{3}
$$
where ρref, and are the reference density, thermal expansion coefficient and reference temperature.
This simplification is valid provided air properties are constant, the flow is incompressible and exhibits small temperature-induced density variations resulting from a small temperature difference (ΔT). The use of this approximation is strongly justified for this study because data hall operates with a maximum design ΔT of 12 ± 1°C between the supply and return air. This value is well within the widely accepted limit (typically < 20 K) for air [53]. This assumption enables the accurate prediction of temperature and buoyancy driven airflow patterns such as the thermal plume rising from IT equipment without solving the full compressible Navier – Stokes equations, thereby reducing computational costs.
2.5. Numerical Methodology and Convergence
Together, the RANS formulation, the Boussinesq turbulence hypothesis, the Standard model, wall function, and the Boussinesq approximation establish a practical and robust framework for predicting the steady state distribution of air velocity, temperature, and pressure within data center spaces.
The set of coupled, non-linear partial differential equations (PDEs) comprising the RANS momentum, mass, energy, and turbulence equations cannot be solved analytically. They are solved using a computational approach. A computational approach based on the Finite Volume Method (FVM) was employed to discretize and solve the equations numerically. In FVM, the physical domain of the data hall is first divided into a finite number of non-overlapping continuous sub-regions, known as control volumes (or the computational mesh). In FVM, the governing PDEs are integrated over each control volume. This integration converts the differential equations into a system of linear algebraic equations that link the value of a variable (e.g., velocity or temperature) at the center of one control volume to the values in its neighboring control volumes. A primary challenge in solving the RANS equations is the inherent coupling between the pressure field and the velocity field, as the mass conservation (continuity) equation does not explicitly contain a term for pressure. This requires a specialized iterative algorithm for solution. For this steady state simulation, the SIMPLE (Semi-Implicit Method for Pressure-Linked Equations) algorithm, or a similar segregated scheme, was utilized. This algorithm iteratively adjusts the pressure and velocity fields until the mass and momentum equations are simultaneously satisfied throughout the entire domain. The system of algebraic equations is solved iteratively until a converged steady state solution is achieved. Convergence is confirmed when the residuals which represent the imbalance in the conservation equations for each control volume have reduced to a specified level. Specifically, the simulation was considered converged when the residuals for pressure, velocity, temperature and turbulence parameters () tended to 1. Furthermore, monitoring key performance metrics, such as the return air temperature to cooling unit, ensured that these values stabilized and ceased to change significantly between iterations.
2.6. Validity of CFD Simulation
‘DataCenterDesignPro’ which is an industry standard data center specific CFD software (Previously recognized as ‘6SigmaRoom’ Release 16.3, which is the latest version at the time of analysis) is used for modeling and CFD simulation. The software is a physics based simulation tool for data center design that utilizes digital twin models. It enables the rapid and accurate creation of digital twins, which serve as virtual representations of existing or planned data centers. These models allow the exploration of multiple design configurations and failure scenarios, supporting the optimization of new data center designs as well as the reevaluation of legacy facilities. By leveraging CFD simulations, the software facilitates the entire design process, from conceptual prototyping to detailed engineering [54].
It includes a comprehensive database of IT equipment and cooling systems, with information collected and verified directly by the respective manufacturers. This capability enables accurate modeling of real data center. The software incorporates the latest cooling technologies and offers greater flexibility in addressing a wide range of design challenges compared to other commercial CFD tools and emerges as the most extensive and feature rich. It is widely recognized as the most accurate tool in the industry for data center design. It is used by several global researchers and data center designers, including Facebook, Microsoft, and IBM, in their data center projects [55], [56], [57], [15], [16], [17], [19], [20] demonstrating the reliability of its CFD results.
2.7. Mesh Independence study
A mesh independence study is a fundamental requirement in all CFD simulations. It is conducted to confirm that the numerical solution is insensitive to further mesh refinement indicating that the discretization error due to the mesh size has been minimized and therefore represents the correct underlying physical behavior. The regions with high gradients are typically assigned a finer mesh. While a finer mesh enhances solution accuracy, it leads to a substantial increase in computational time. By progressively refining the computational grid and comparing key solution variables, it is possible to determine the point at which additional refinement produces negligible changes in the results.
The automatic grid generation feature of the software was used to generate the unstructured hexahedral mesh. Five different meshes were generated, and variables such as ACU return air temperature, cabinet inlet and outlet temperatures, and room temperature were monitored for each mesh size. The mesh containing 7,288,454 cells was found to be optimal, as further refinement caused negligible variation in the selected variable values, and was thus chosen for analysis. This method ensures the accuracy and reliability of the simulation results while avoiding unnecessary computational cost.
The essential components of the data hall (such as ACUs, PDUs, IT Cabinets etc.) can be added either from the software’s built-in library or through a neutral data format. This approach ensures the accuracy of simulation, as the mesh independence study of these components is already validated. Achieving grid independence alone does not guarantee simulation accuracy. The correctness of boundary conditions and the choice of turbulence model also significantly affect the simulation results.
3. Data Center Hall
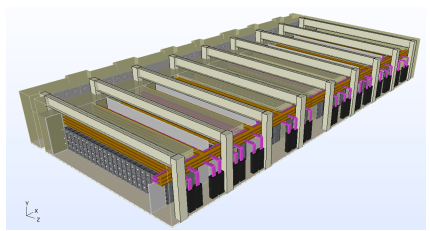
A data hall layout with non-raised floor configuration and HAC strategy as shown in Figure 1, 2 and 3 is used for the CFD analysis. The data hall measures approximately 41 m in length and 20 m in width, with a total floor area of 810 m². The floor to ceiling height is 5.7 m. The number of IT Cabinet are 308 and the corresponding total IT load is 1920 kW (6.23 kW per cabinet). Each cabinet has a height of 2.4 m and a footprint of 0.6 m×1.2 m.
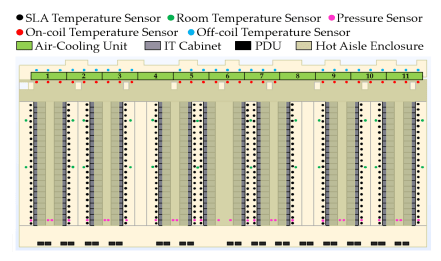
The cabinets are organized into 14 rows in face-to-face and back-to-back configurations, with the back sides of the cabinets facing each other to form HAC of varying sizes. Data hall layout is with caging. The cages are used to create enclosed areas within the data hall which provides an additional layer of security for IT cabinets in a colocation data center. The doors are provided in the containment to allow access to the rear of the cabinets. There are 11 ACUs separated by partition walls and 28 power distribution units (PDUs) which are located inside the data hall.
3.1. CFD Model of the Data Hall with IT Cabinets
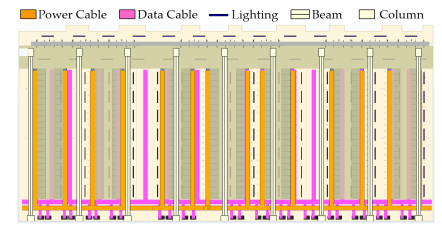
The 3D view of the data hall CFD model is shown in Figure 1. The data hall consists of ACUs, PDUs, IT cabinets, cages, hot aisle enclosure, power cables, data cables, lighting, structural beam, structural column, partition walls, walls, temperature and pressure sensors etc. as shown in Figure 2 and 3.
The CFD model of the data hall was fully constructed using the tools and options available in the software ‘DataCenterDesignPro’, with the CAD layout used as a reference. This CAD layout of the data hall was imported into the software to guide the modeling process, ensuring that the virtual representation accurately reflected the physical layout and arrangement of the data hall.
The ACU is custom built based on the manufacturer’s specifications and all other important elements such as PDUs, IT Cabinets etc. are imported from software’s built-in library. The other details such as power cables and data cables are included in the model as flow obstructions.
3.1.1. Materials
In data hall CFD simulations, accurately defining material properties is essential because these parameters directly influence heat transfer, and overall thermal performance. Materials with different thermal conductivities, densities, and heat capacities respond differently to temperature loads, affecting how heat is absorbed, stored, and dissipated within the space. Since data halls contain diverse architectural and equipment surfaces that interact with cooling systems, neglecting realistic material properties can lead to significant deviations between simulated and actual thermal conditions. Therefore, incorporating correct material characteristics ensures more reliable predictions of temperature distribution, airflow patterns, and cooling efficiency, ultimately supporting effective thermal management and design optimization.
The walls of the data hall are constructed from cement mortar. The HAC, partition wall and panels are fabricated from polycarbonate. The column, floor and ceiling are composed of concrete. The IT cabinets, ACUs and I-beam are made of mild steel. The key material properties include density, thermal conductivity and specific heat capacity and are listed in Table 1.
Table 1: Material Properties
| Material | Density (kg/m³) | Thermal Conductivity (W/(m·K)) | Specific Heat Capacity (J/(kg·K)) |
|---|---|---|---|
| Air | 1.19 | 0.026 | 1005 |
| Water | 997 | 0.612 | 4186 |
| Cement Mortar | 1200 | 0.50 | 850 |
| Polycarbonate | 1200 | 0.19 | 1300 |
| Concrete | 2100 | 1.37 | 1000 |
| Mild Steel | 7860 | 63.0 | 420 |
3.1.2. Sensors
The temperature and pressure sensors are used to monitor and control the conditions of the data hall. The aim is to ensure not only the sufficient air flow is provided for each IT cabinet but also efficiently cooling them without wastage of energy. The control strategy is developed in such a way that an efficient operation of data hall is achieved while ensuring all SLA temperature requirement are also being met.
The SLA sensors are placed at 0.9m & 1.5m off floor and 0.3m away from IT cabinet air intake side. The top-level sensors are placed at 2.4m off floor level (IT cabinet top level) and 0.3m away from IT cabinet air intake side. The pressure sensors are placed at the far end of each cabinet row. One pressure sensor is placed in the room while another is placed in hot aisle to measure the pressure differential across the IT cabinet. The room temperature sensors are placed in cages to measure room temperature.
One on-coil temperature sensor is placed in front and one off-coil temperature sensor is placed behind each heat exchanger of an ACU. In this case, on-coil temperature is defined as the temperature of hot return air from the conditioned space of data hall (after passing over IT cabinet and removing heat thereby cooling it) and entering the heat exchanger (cooling coil) of an ACU. The off-coil temperature is defined as the temperature of air leaving the heat exchanger of an ACU after getting cooled to the design value by exchanging heat with chilled water supplied by the chillers.
3.2. Working Principle
The ACUs supply cold air at the design supply temperature and it fills the data hall room. The cold air then passes through the IT cabinets and takes away heat generated by them. The hot air then gets collected in hot aisle enclosure. The hot return air from IT cabinets then passes through heat exchangers of ACUs and gets cooled to the design supply temperature and the cycle repeats.
As cold air fills the data hall and hot air is contained in an enclosure, the design approach is called hot aisle containment (HAC) design. The heat exchanger of an ACU is liquid-air type heat exchanger in which heat transfer takes place between hot return air from IT cabinet and chilled water supplied by chillers. The ACU supply air temperature will be higher than off-coil temperature as it includes heat dissipation from fan. The room air temperature will be higher than supply air temperature because it includes heat dissipation from lighting, PDUs and heat gained from unconditioned wall etc. to it.
3.3. Data Center Modes of Operations
Two modes of operation are considered for data center design analysis as follows:
- Normal Mode (NM)steady state operation is with all ACUs functional.
- Failure Mode (FM)operation where the designated number of ACUs are offline in the worst-case scenario.
4. Air Cooling Unit (ACU)
Data centers require precise thermal management to ensure the reliability and efficiency of IT equipment. The core device responsible for this management is ACU. To efficiently match the dynamic heat load generated by servers, these units rely on sophisticated control strategies. The two primary control mechanisms involve modulating the fan speed and regulating the chilled water flow rate. Fan speed varies using a Variable Frequency Drive (VFD). Simultaneously, the chilled water flow rate through the heat exchangers is regulated by a two-way Pressure Independent Control Valve (PICV).
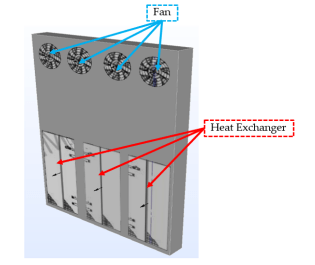
4.1. ACU Construction
Each ACU has four fans and three heat exchangers (Cooling coils) as shown in Figure 4. The design supply air temperature is 25°C and return air temperature is 37°C. The design ΔT of 12 ± 1°C is to be maintained between supply and return of ACU.
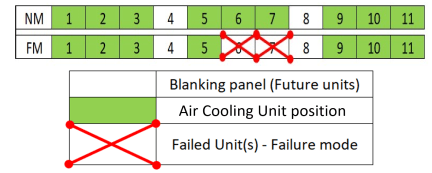
4.2. ACU position for NM and FM
Total nine ACUs are available during NM of operation as shown in Figure 5 with green color. The ACU 4 and 8 are for future expansion. The future expansion ACU is replaced by solid obstruction in the model which does not allow the flow through it. The ACUs 6 and 7 are considered offline during FM.
4.3. ACU Control Strategy
4.3.1. Fan Control Logic
All the ACU fans should operate at the same speed. Therefore, there is group control associated with fans and a single controller is used to control the fan speed. The fan speed control is a combination of temperature differential (DT) and pressure differential (DP) control. In this case DT is defined as the difference between on-coil temperature and room air temperature. The DP is pressure difference measured at end of the IT cabinet row across IT cabinet.
The DT between average on-coil temperature sensor readings and average room temperature sensor (corresponding cabinet row) readings are calculated. The maximum measured DT will be used for DT control. The fan speed will increase proportionally when DT increases and vice versa. The DT increases when hot return air temperature increases. When return air temperature increases the fan speed increases which supply more cooled air flow which bring down the temperature to the set point of 37°C and vice versa. The minimum fan speed is set at 40% and maximum is set at 100%.
DP at the far end of each cabinet row is measured by DP sensors. When DP is lower than set point of 3 Pa, fan speed will increase based on a reversed proportional curve. When measured DP is lower than 3 Pa (e.g. at fan initial start-up, or failure scenario), DP control will be dominant and fan speed will ramp up to ensure DP set point is reached and when measured DP is higher than 3 Pa, fan control logic will be DT control. The minimum measured DP will be used for DP control.
The DP control ensures that IT cabinets are provided with enough airflow and hot air from hot aisle is not recirculating back to the inlet of IT cabinet by maintaining sufficient DP across it. As DP across cabinet drops below 3 Pa, fan speed increases to increase the ACU air flow thereby increasing pressure on IT cabinet intake side. The greater the drop below 3 Pa, more will be increase in fan speed.
The control switches between DT control and DP control until steady state is reached which gives highest cooling efficiency without recirculation of hot air. During operation, control will be predominantly DT controlled.
4.3.2. Cooling Coil Control Logic
The cooling coil control is set based on off-coil temperature sensor readings. There are three off-coil temperature sensors per ACU. The off-coil temperature is controlled at 25°C. The maximum recorded off-coil temperature out of temperature recorded by three off-coil sensors is used to control coolant (chilled water) flow through the heat exchangers of ACU.
As the off-coil temperature increases coolant flow through the heat exchanger increases to bring down the temperature to the set point of 25°C and vice versa. The chilled water valve minimum opening is set at 10% and maximum opening is set at 100% of design maximum flow rate. The cooling coil control is on individual ACU, there is no group control associated.
5. CFD Simulation
5.1. Design Data for CFD Simulation
- The heat dissipation from each fan of an ACU is 2.28 kW. The total fan heat dissipation is 9.10 kW for each ACU.
- The total PDU heat dissipation is 6.72 kW. The heat dissipation from lighting and small power is 9.65 kW.
- Room total heat load is 2018.27 kW during NM and 2000.07 kW during FM, which includes IT load, lighting, small power, PDU, and ACU fan heat dissipation.
- All nine ACUs are modeled with each having 274.20 kW total cooling capacity. Total available cooling capacity is 2467.80 kW during NM and 1919.40 kW during FM.
- There is sufficient cooling capacity available during NM. but the cooling capacity is slightly less than the room total heat load during the FM.
5.2. Design Considerations
The following design considerations were made during the NM and FM of operation of data hall:
- Data hall operates with 100% IT load with uniform distribution of load throughout the data hall.
- The radiant heat transfer is negligible compared to the dominant conduction and convection in the data hall.
- Moreover, the room is located within the interior of the building and the influence of solar radiation on its thermal environment is minimal. Therefore, the effects of solar and thermal radiation are neglected.
- The thermal conductivity and specific heat capacity of the fluid were assumed to remain constant, as their variations with temperature and pressure are relatively small.
- The heat dissipation from lighting, occupants, and other minor power sources is included and amounts to 9.65 kW.
- In FM of operation, two ACUs are taken offline namely ACU 4 and ACU 8 as shown in Figure 5.
- Typical small gaps (5%) considered for cabinet leakages.
- A fixed temperature boundary condition is provided for data hall walls.
- For hot aisle enclosure leakage, specified gap size of 0.561 mm with 100% open area is considered.
- The coolant used is chilled water and chillers supply chilled water to ACUs at 22°C.
- The chiller COP is 3.71.
- The rated speed of ACU fan is 1530 rpm.
- The rated fan air flow rate is maximum 4.88 m3/s. The maximum total air flow rate is 19.5 m3/s per ACU.
- The ACU heat exchanger effectiveness is 0.80 and cooling capacity is 91.40 kW.
- The chilled water flow rate to each heat exchanger of an ACU can be maximum 3.63 l/s. The maximum chilled water flow rate is 10.90 l/s per ACU.
5.3. Simulation Scenarios
For NM and FM of operation, 4 simulations are carried out each as listed in Table 2.
Table 2: NM and FM simulation scenarios
| Normal Mode | Failure Mode | ||||
|---|---|---|---|---|---|
| Case No. | Control | Leakage | Case No. | Control | Leakage |
| 1 | ✓ | ✓ | 1 | ✓ | ✓ |
| 2 | ✓ | ✗ | 2 | ✓ | ✗ |
| 3 | ✗ | ✓ | 3 | ✗ | ✓ |
| 4 | ✗ | ✗ | 4 | ✗ | ✗ |
Note: ✓ indicates with, and ✗ indicates without.
6. CFD Simulation Results
After simulation is set up, run and converged, results can be visualized. CFD simulation provides visualization of performance characteristics such as temperature, velocity and pressure that are difficult to capture in the real world. Key results from CFD for evaluating design are ASHRAE compliance plot, top level and SLA sensor analysis, mean inlet temperature of the cabinets, effect of leakages, pressure distribution in space, percentage cooling capacity used, ACU supply and return air temperature, chilled water temperature curve, fan speed and cooling power curve.
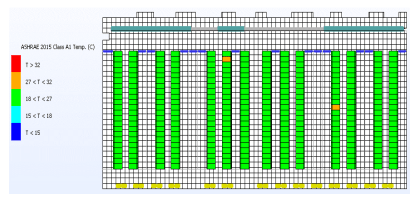
The thermal requirements of IT equipment are typically defined in terms of inlet air temperature of the equipment. According to ASHRAE guidelines [58], the allowable inlet air temperature range is 15 to 32°C, while the recommended operating range is 18 to 27°C.
6.1. Normal Mode (NM)
6.1.1. NM Simulation Results for Case 1
The CFD simulation results of NM Case 1 which is with control and with leakages is discussed in detail:
Figures 6, 7 and 8 shows the temperature distribution in space at height of 0.9m, 1.5m and 2.4m off floor respectively. The SLA sensor readings at 0.9 m and 1.5m off floor level in front of each cabinet is in the range of 25.91 to 26.51°C and 25.88 to 26.52°C respectively. The SLA sensor reading meets the design requirement. The top-level sensor reading at 2.4 m off floor level in front of each cabinet is in the range of 25.84 to 26.72°C.
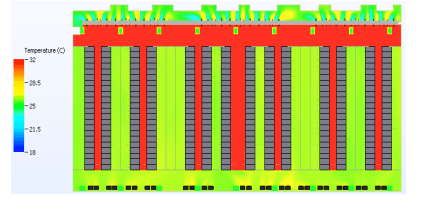
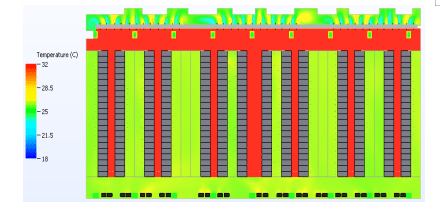
Figure 10 shows the mean inlet air temperature of the IT cabinet. The mean air temperature measured at IT cabinet intake side is in the range 25.91 to 27.08°C which is slightly above the ASHRAE recommended temperature range (18 to 27°C). Figure 11 shows the temperature plot across the IT cabinets (IT cabinets hidden). The temperature plot across cabinets indicates leakage of hot air from hot aisle into the cabinet inlet through cabinet’s typical small gaps, resulting in increased peak inlet air temperature for five IT cabinets. Therefore, in case higher peak inlet air temperature is recorded due to leakages, SLA sensor readings will take precedence over the ASHRAE readings to check for compliance.
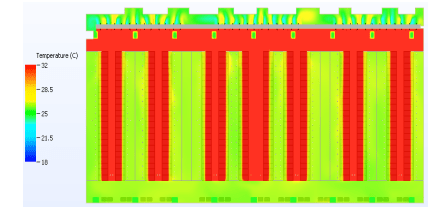
Figure 9 shows the ASHRAE temperature compliance plot for NM Case 1. The ASHRAE compliance temperature is the peak inlet air temperature of the IT cabinet. The peak air temperature measured at IT cabinet intake side is in the range of 25.97 to 30.11°C. All the IT cabinets except five are having peak inlet air temperature in the range of 18 to 27°C, which comply with ASHRAE recommended temperature range.
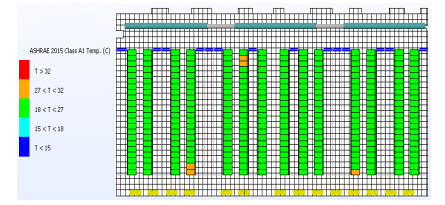
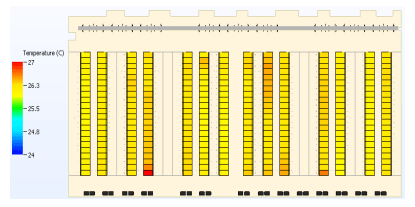
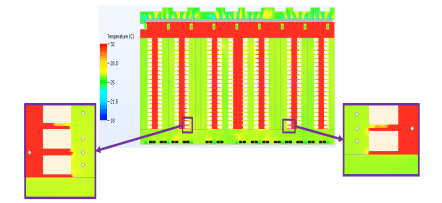
Figure 12 shows pressure distribution in space at 2.4m off floor (IT cabinet height level) with differential pressure across the IT cabinet at the far end of each cabinet row. Figure 12 also shows the fan speed and corresponding air flow rate from an ACU. During normal steady state operation of the data hall, fans operate at 1395 rpm with air flow rate of 17.78 m3/s. All fans operate at the same speed and air flow rate, as there is a group control associated with ACU fans and a single controller is used to control the speed. The DP varies from 2.94 to 24.02 Pa. Figure 13 shows the cooling capacity utilization of an ACU. The cooling capacity of ACUs varies from 203.11 to 236.63 kW. Only 74.07 to 86.30% of the total available cooling capacity of 274.2 kW is utilized by the ACUs.
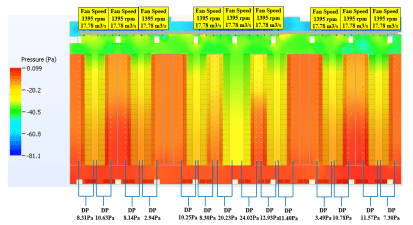
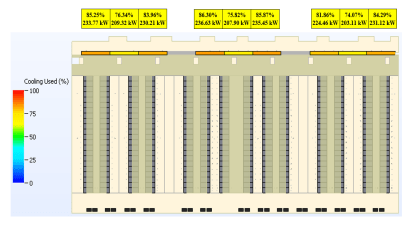
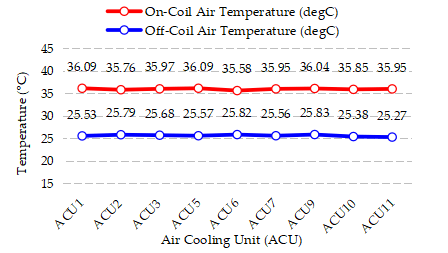
Figure 14 shows the average ACU on-coil and off-coil temperature. The ACU on-coil temperature is the average of the temperature recorded by on-coil sensor of heat exchangers of an ACU. Similarly, the ACU off-coil temperature is the average of the temperature recorded by off-coil sensor of heat exchangers of an ACU. The simulation result showed an average of 25.60°C supply and 35.92°C return which is close to the design values. This indicates that the control logic is functioning well.
6.1.2. NM Simulation Results for Case 2, 3 and 4
Figure 15 shows the ASHRAE temperature compliance plot for NM Case 2. The peak air temperature measured at IT cabinet intake side is in the range of 26.10 to 27.05°C. All the IT cabinets except one are having peak inlet air temperature in the range of 18 to 27°C, which comply with ASHRAE recommended temperature range.
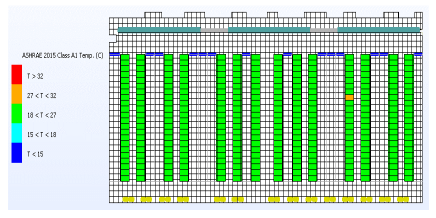
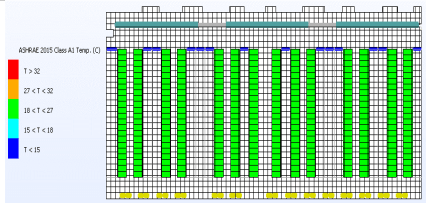
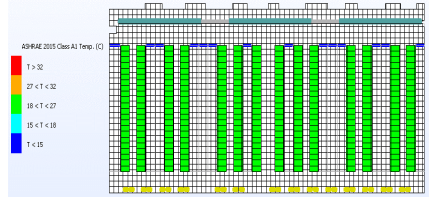
Figure 16 and 17 shows the ASHRAE temperature compliance plot for NM Case 3 and 4 respectively. The peak air temperature measured at IT cabinet intake side is in the range of 25.10 to 26.36°C and 25.12 to 25.96°C for Case 3 and 4 respectively. All the IT cabinets are having peak inlet air temperature in the range of 18 to 27°C for both Case 3 and 4, which comply with ASHRAE recommended temperature range.
6.1.3. NM Simulation Results Summary
Table 3 summarizes the NM simulation results. From CFD simulation result it is observed that:
Table 3: Normal Mode simulation results summary
| Case | 1 | 2 | 3 | 4 |
|---|---|---|---|---|
| Control | ✓ | ✓ | ✗ | ✗ |
| Leakages | ✓ | ✗ | ✓ | ✗ |
| Fan Speed Controller Temperature Input | 9.99°C | 11.00°C | – | – |
| Fan Speed Group Controller Output | 85.30% | 69.80% | – | – |
| Fan Speed | 1395 rpm | 1253 rpm | 1530 rpm | 1530 rpm |
| Chilled Water Controller Output | 62.39–85.47% | 60.24–81.01% | – | – |
| Pressure Difference | 2.94–24.02 Pa | 11.39–30.83 Pa | 12.33–38.97 Pa | 69.00–96.98 Pa |
| Maximum On-Coil Temperature | 36.79°C | 37.48°C | 35.50°C | 34.54°C |
| Minimum On-Coil Temperature | 33.94°C | 36.70°C | 33.19°C | 33.97°C |
| Maximum Off-Coil Temperature | 26.02°C | 26.02°C | 25.49°C | 24.22°C |
| Minimum Off-Coil Temperature | 24.68°C | 24.76°C | 24.13°C | 25.31°C |
| Total Cooling Power (kW) | 203.11–236.63 | 206.64–232.21 | 202.78–232.03 | 206.40–230.50 |
| Coolant Temperature Out (Average) | 27.20–29.78°C | 27.41–29.90°C | 25.99–27.86°C | 26.07–27.64°C |
| Cabinet Maximum Temperature In | 25.97–30.11°C | 26.10–27.05°C | 25.10–26.36°C | 25.12–25.96°C |
| Cabinet Mean Temperature In | 25.91–27.08°C | 25.99–26.62°C | 25.05–25.68°C | 25.05–25.64°C |
| Room Temperature | 25.94–26.49°C | 25.98–26.71°C | 24.98–25.73°C | 24.99–25.66°C |
| Top-level Temperature Sensor at 2.4 m | 25.84–26.72°C | 25.90–26.95°C | 25.07–26.03°C | 25.06–26.01°C |
| SLA Temperature Sensor at 1.5 m | 25.88–26.52°C | 25.93–26.60°C | 25.04–25.67°C | 25.03–25.62°C |
| SLA Temperature Sensor at 0.9 m | 25.91–26.51°C | 25.98–26.59°C | 25.01–25.66°C | 25.01–25.59°C |
Note: ✓ indicates with, and ✗ indicates without.
The leakage causes recirculation of hot air from hot aisle back into the cabinet inlet through cabinets typical small gaps, resulting in increased peak inlet air temperature for cabinets. For case without control logic (Case 3&4), all IT cabinets are having peak inlet air temperature in the range of 18 to 27°C, and SLA sensor readings at 0.9 m and 1.5 m off floor in front of each cabinet are less than 27°C, which met the design requirement.
For cases with control logic (Case1&2), ASHRAE compliance is not met due to recirculation of hot air because of leakages. But SLA sensor readings at 0.9 m and 1.5 m off floor in front of each cabinet is less than 27°C, which met the design requirement.
6.2. Failure Mode (FM)
6.2.1. FM Simulation Results for Case 1 to 4
Figure 18 shows the ASHRAE temperature compliance plot for FM Case 1. The peak air temperature measured at IT cabinet intake side is in the range of 25.84 to 34.82°C. The simulation result showed that many IT cabinets are having peak inlet air temperature between 27 to 32°C and greater than 32°C, which does not comply with ASHRAE recommended temperature range.
Figure 19 shows the ASHRAE temperature compliance plot for FM Case 2. The peak air temperature measured at IT cabinet intake side is in the range of 25.81 to 27.27°C. All the IT cabinets except five are having peak inlet air temperature in the range of 18 to 27°C, which comply with ASHRAE recommended temperature range.
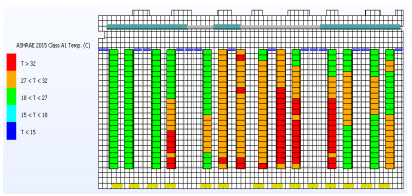
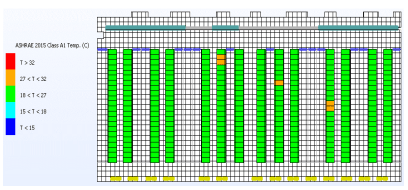
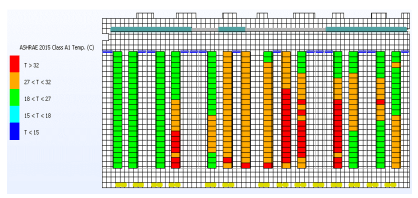
Figure 20 shows the ASHRAE temperature compliance plot for FM Case 3. The peak air temperature measured at IT cabinet intake side is in the range of 25.43 to 34.66°C. The simulation result showed that many IT cabinets are having peak inlet air temperature between 27 to 32°C and greater than 32°C, which does not comply with ASHRAE recommended temperature range.
Figure 21 shows the ASHRAE temperature compliance plot for FM Case 4. The peak air temperature measured at IT cabinet intake side is in the range of 25.58 to 27.15°C. All the IT cabinets except two are having peak inlet air temperature in the range of 18 to 27°C, which comply with ASHRAE recommended temperature range.
6.2.2. FM Simulation Results Summary
Table 4 summarizes the FM simulation results. From CFD simulation result it is observed that:
During FM of operation, no significant difference observed when simulation is run with or without control (Comparing Case 1&2 with Case 3&4). This is because during FM fan speed is ramped up to 100% and chilled water controller output also is almost 100%. The negative DP is observed across cabinets in the area served by offline cooling units. The area served by offline cooling units also experiences recirculation of hot air from the hot aisle into the cold aisle.
The results showed significant effect of leakages on the performance especially during FM. When comparing Case 1&3 with Case 2&4, with leakages heavy recirculation of air is observed, which causes leakage of hot air from hot aisle into the cold aisle. The recirculated hot air enters cabinet inlet resulting in increased inlet temperature of cabinet, in turn return air temperature increases and supply air temperature increases. Thus, increasing the room temperature. Because of which SLA temperatures recorded are higher and design requirement is not met. Therefore, it is important to minimize leakage.
Table 4: FM simulation results summary
| Case | 1 | 2 | 3 | 4 |
|---|---|---|---|---|
| Control | ✓ | ✓ | ✗ | ✗ |
| Leakages | ✓ | ✗ | ✓ | ✗ |
| Fan Speed Controller Temperature Input | 12.20°C | 11.80°C | – | – |
| Fan Speed Group Controller Output | 100.00% | 100.00% | – | – |
| Fan Speed | 1530 rpm | 1530 rpm | 1530 rpm | 1530 rpm |
| Chilled Water Controller Output | 81.02–100% | 84.53–100% | – | – |
| Pressure Difference | -6.40 to 7.33 Pa | -6.35 to 15.77 Pa | -6.39 to 7.47 Pa | -6.38 to 15.86 Pa |
| Maximum On-Coil Temperature | 39.17°C | 38.37°C | 38.98°C | 38.24°C |
| Minimum On-Coil Temperature | 35.61°C | 36.56°C | 35.32°C | 36.36°C |
| Maximum Off-Coil Temperature | 26.72°C | 26.47°C | 26.60°C | 26.41°C |
| Minimum Off-Coil Temperature | 24.96°C | 24.97°C | 24.74°C | 24.85°C |
| Total Cooling Power (kW) | 248.4–353.5 | 261.3–340.7 | 252.3–349.1 | 264.5–337.3 |
| Coolant Temperature Out (Average) | 27.16–29.84°C | 27.22–29.55°C | 26.96–29.73°C | 27.15–29.49°C |
| Cabinet Maximum Temperature In | 25.84–34.82°C | 25.81–27.27°C | 25.43–34.66°C | 25.58–27.15°C |
| Cabinet Mean Temperature In | 25.80–28.46°C | 25.76–26.64°C | 25.40–28.37°C | 25.49–26.52°C |
| Room Temperature | 25.82–27.16°C | 25.79–26.93°C | 25.41–27.08°C | 25.46–26.75°C |
| Top-level Temperature Sensor at 2.4 m | 25.84–28.41°C | 25.78–27.20°C | 25.41–28.31°C | 25.49–27.16°C |
| SLA Temperature Sensor at 1.5 m | 25.81–27.88°C | 25.76–26.78°C | 25.40–27.78°C | 25.47–26.65°C |
| SLA Temperature Sensor at 0.9 m | 25.79–27.54°C | 25.74–26.67°C | 25.38–27.42°C | 25.46–26.55°C |
Note: ✓ indicates with, and ✗ indicates without.
7. Operational Impact of Control Strategy & Leakages
7.1. Normal Mode Steady State Operation
The leakage causes recirculation of hot air from hot aisle back into the cabinet inlet through cabinets typical small gaps, resulting in increased peak inlet air temperature for only a few cabinets which is not a concern. The SLA sensor readings at 0.9 m and 1.5 m off floor in front of each cabinet are less than 27°C for all the cases, which met the design requirement.
When Case 1 and Case 3, both of which incorporate practical leakage conditions, are compared, the influence of the control strategy on the cooling performance of the data hall becomes evident. Under the control strategy, the ACUs operate at an optimized fan speed and chilled water flow rates, resulting in reduced overall power consumption. Specifically, the fan speed decreases from 1530 rpm to 1395 rpm, lowering the fan power demand. Similarly, the total chilled water flow rate across all ACUs decreases from 98.1 l/s to 77 l/s, which reduces pump power consumption due to the presence of a variable frequency drive (VFD).
The reduction in ACU fan speed also decreases the heat dissipation by fans into the data hall space, thereby lowering the cooling load on the chiller. Furthermore, the decrease in chilled water flow rate increases the chilled water return temperature for a fixed supply water temperature. As a result, the chiller evaporator operates at a higher temperature, increasing the evaporator saturation pressure. Because the condenser pressure remains unchanged (ambient conditions are constant), the compressor lift is reduced, leading to lower chiller compressor power consumption.
Overall, the implementation of the control strategy yields an approximate 9.89% reduction in cooling power consumption.
7.2. Failure Mode Operation
The results with control and without control logic are almost similar. Significant effect of leakages is observed on the performance especially during FM. Only in an ideal case with no leakages, SLA sensor readings at 0.9 m and 1.5 m off floor in front of each cabinet are than 27°C, which met the design requirement. But in a practical case with leakages, SLA sensor readings at 0.9 m and 1.5 m off floor in front of each cabinet are more than 27°C, which does not meet the design requirement, necessitating revision of the design cooling capacity.
In the FM with the control strategy active, the ACU fans continue to operate at full speed and the chilled water flow rate remains close to the rated value. Because the data hall heat load is nearly equal to the available cooling capacity, no meaningful optimization is possible under this condition. As a result, the control strategy provides no substantial reduction in power consumption.
8. Conclusions
A CFD based approach was adopted in this paper to assess the cooling performance of a dynamically controlled, non-raised floor data hall with a HAC configuration. The control strategy, which adjusts ACU fan speed and chilled-water flow rates using real-time temperature and pressure feedback, effectively maintains cabinet inlet temperatures within allowable limits while reducing overall cooling energy consumption. Under normal mode operation, control strategy reduces fan, pump, and chiller compressor power consumption and lowers the chiller cooling load, resulting in approximately 9.89% overall energy savings. The leakages become critical during failure mode, as only the idealized no leakage scenario satisfies the SLA temperature requirement, whereas practical leakage results in non-compliance with the design criteria.
The key insights from the CFD analysis are highlighted as follows:
- The accurate prediction of data center cooling performance is made possible by the use of CFD technology.
- By using performance-based analysis, issues were identified and addressed at the design stage itself, which minimized rework by testing the design or design changes prior to implementation.
- By analyzing multiple simulation scenarios, potential failures are identified, which minimizes the risk of failures and leads to an accurate design for the data center.
- The design requirements are met while the efficient operation of the data center is achieved through the control strategy used.
- The proper design studies and predictions from the CFD simulation provide assurance that the data center will perform reliably and efficiently under normal and failure mode of operation.
- Y. Zhang, J. Liu, “Prediction of Overall Energy Consumption of Data Centers in Different Locations,” Sensors, vol. 22, no. 10, pp. 3704, 2022, doi:10.3390/s22103704.
- E. Masanet, A. Shehabi, N. Lei, S. Smith, J. Koomey, “Recalibrating global data center energy-use estimates,” Science, vol. 367, no. 6481, pp. 984–986, 2020, doi:10.1126/science.aba3758.
- CISCO, Cisco Global Cloud Index: Forecast and Methodology, 2016–2021, 2018.
- International Energy Agency, Digitalization & Energy, 2017.
- A. Shehabi, S.J. Smith, E. Masanet, J. Koomey, “Data center growth in the United States: Decoupling the demand for services from electricity use,” Environmental Research Letters, vol. 13, no. 12, 2018, doi:10.1088/1748-9326/aaec9c.
- ABB, Data centers energy efficiency and management, 2023.
- M. Law, “Energy efficiency predictions for data centres in 2023,” 2022.
- Y. Liu, X. Wei, J. Xiao, Z. Liu, Y. Xu, Y. Tian, “Energy consumption and emission mitigation prediction based on data center traffic and PUE for global data centers,” Global Energy Interconnection, vol. 3, no. 3, pp. 272–282, 2020, doi:10.1016/j.gloei.2020.07.008.
- P. Sharma, P. Pegus II, D. Irwin, P. Shenoy, J. Goodhue, J. Culbert, “Design and Operational Analysis of a Green Data Center,” IEEE Internet Computing, vol. 21, no. 4, pp. 16–24, 2017, doi:10.1109/MIC.2017.2911421.
- J. Gao, “Machine Learning Applications for Data Center Optimization,” 2014.
- Sullivan R, Alternating Cold and Hot Aisles Provides More Reliable Cooling for Server Farms, 2000.
- C.D. Patel, C.E. Bash, L. Stahl, D. Sullivan, “Computational Fluid Dynamics Modeling of High Compute Density Data Centers to Assure System Inlet Air Specifications,” in IPACK, ASME, 2001.
- S. Patankar, “Airflow and Cooling in a Data Center,” ASME Journal of Heat Transfer, vol. 132, no. 7, 2010, doi:10.1115/1.4000703.
- S. Pogorelskiy, I. Kocsis, “BIM and Computational Fluid Dynamics Analysis for Thermal Management Improvement in Data Centres,” Buildings, vol. 13, no. 10, 2023, doi:10.3390/buildings13102636.
- D. Jiang, “Effects and optimization of airflow on the thermal environment in a data center,” Frontiers in Built Environment, vol. 10, , 2024, doi:10.3389/fbuil.2024.1362861.
- J. Cho, C. Park, W. Choi, “Numerical and experimental study of air containment systems in legacy data centers focusing on thermal performance and air leakage,” Case Studies in Thermal Engineering, vol. 26, , 2021, doi:10.1016/j.csite.2021.101084.
- J. Cho, J. Woo, B. Park, T. Lim, “A comparative CFD study of two air distribution systems with hot aisle containment in high-density data centers,” Energies, vol. 13, no. 22, 2020, doi:10.3390/en13226147.
- C. Zhou, Y. Hu, R. Liu, Y. Liu, M. Wang, H. Luo, Z. Tian, “Energy Performance Study of a Data Center Combined Cooling System Integrated with Heat Storage and Waste Heat Recovery System,” Buildings, vol. 15, no. 3, 2025, doi:10.3390/buildings15030326.
- Y. Guo, C. Zhao, H. Gao, C. Shen, X. Fu, “Improving Thermal Performance in Data Centers Based on Numerical Simulations,” Buildings, vol. 14, no. 5, 2024, doi:10.3390/buildings14051416.
- Kao Data, Using Simulation to Validate Cooling Design, 2021.
- AKCP, Computational Fluid Dynamics to Improve the Performance of Data Centers, 2021.
- B. Zhan, S. Shao, M. Lin, H. Zhang, C. Tian, Y. Zhou, “Experimental investigation on ducted hot aisle containment system for racks cooling of data center,” International Journal of Refrigeration, vol. 127, pp. 137–147, 2021, doi:10.1016/j.ijrefrig.2021.02.006.
- M. Tatchell-Evans, N. Kapur, J. Summers, H. Thompson, D. Oldham, “An experimental and theoretical investigation of the extent of bypass air within data centres employing aisle containment, and its impact on power consumption,” Applied Energy, vol. 186, pp. 457–469, 2017, doi:10.1016/j.apenergy.2016.03.076.
- S.A. Alkharabsheh, B.G. Sammakia, S.K. Shrivastava, “Experimentally Validated Computational Fluid Dynamics Model for a Data Center with Cold Aisle Containment,” Journal of Electronic Packaging, vol. 137, no. 2, pp. 21010, 2015, doi:10.1115/1.4029344.
- C. Gao, Z. Yu, J. Wu, “Investigation of Airflow Pattern of a Typical Data Center by CFD Simulation,” Energy Procedia, vol. 78, pp. 2687–2693, 2015, doi:10.1016/j.egypro.2015.11.350.
- S.A. Nada, M.A. Said, “Effect of CRAC units layout on thermal management of data center,” Applied Thermal Engineering, vol. 118, pp. 339–344, 2017, doi:10.1016/j.applthermaleng.2017.03.003.
- R. Zhou, Z. Wang, “Modeling and Control for Cooling Management of Data Centers with Hot Aisle Containment,” in IMECE, ASME: 739–746, 2011, doi:10.1115/IMECE2011-62506.
- C.D. Patel, C.E. Bash, R. Sharma, M. Beitelmal, R. Friedrich, “Smart cooling of data centers,” in Advances in Electronic Packaging, American Society of Mechanical Engineers: 129–137, 2003, doi:10.1115/ipack2003-35059.
- C.B. Bash, C.D. Patel, R.K. Sharma, “Dynamic thermal management of air cooled data centers,” in Thermal and Thermomechanical Proceedings 10th Intersociety Conference on Phenomena in Electronics Systems, 2006 (ITHERM 2006), pp. 8– 452, 2006, doi:10.1109/ITHERM.2006.1645377.
- S. Nagarathinam, B. Fakhim, M. Behnia, S. Armfield, “Thermal Performance of an Air-Cooled Data Center With Raised-Floor and Non-Raised-Floor Configurations,” Heat Transfer Engineering, vol. 35, pp. 384–397, 2014, doi:10.1080/01457632.2013.828559.
- K. Khankari, “Analysis of Air Leakage from Hot Aisle Containment Systems and Cooling Efficiency of Data Centers,” in ASHRAE Winter Conference, 2014.
- H. Alissa, K. Nemati, B. Sammakia, K. Ghose, M. Seymour, D. King, R. Tipton, “Ranking and Optimization of CAC and HAC Leakage Using Pressure Controlled Models,” in Proceedings of the ASME IMECE, 2015, doi:10.1115/IMECE2015-50782.
- Z. Song, B.T. Murray, B. Sammakia, “Parametric analysis for thermal characterization of leakage flow in data centers,” in Fourteenth Intersociety Conference on Thermal and Thermomechanical Phenomena in Electronic Systems (ITherm), IEEE: 778–785, 2014, doi:10.1109/ITHERM.2014.6892360.
- Y.U. Makwana, A.R. Calder, S.K. Shrivastava, “Benefits of properly sealing a cold aisle containment system,” in Fourteenth Intersociety Conference on Thermal and Thermomechanical Phenomena in Electronic Systems (ITherm), IEEE: 793–797, 2014, doi:10.1109/ITHERM.2014.6892362.
- E. Wibron, A.L. Ljung, T. Staffan Lundström, “Comparing performance metrics of partial aisle containments in hard floor and raised floor data centers using CFD,” Energies, vol. 12, no. 8, 2019, doi:10.3390/en12081473.
- Y.-T. Lee, C.-Y. Wen, Y.-C. Shih, Z. Li, A.-S. Yang, “Numerical and experimental investigations on thermal management for data center with cold aisle containment configuration,” Applied Energy, vol. 307, , pp. 118213, 2022, doi:10.1016/j.apenergy.2021.118213.
- D. Macedo, R. Godina, P.D. Gaspar, P.D. da Silva, M.T. Covas, “A parametric numerical study of the airflow and thermal performance in a real data center for improving sustainability,” Applied Sciences, vol. 9, no. 18, 2019, doi:10.3390/app9183850.
- J. Cho, T. Lim, B.S. Kim, “Measurements and predictions of the air distribution systems in high compute density (Internet) data centers,” Energy and Buildings, vol. 41, no. 10, pp. 1107–1115, 2009, doi:10.1016/j.enbuild.2009.05.017.
- S. Alkharabsheh, J. Fernandes, B. Gebrehiwot, D. Agonafer, K. Ghose, A. Ortega, Y. Joshi, B. Sammakia, “A Brief Overview of Recent Developments in Thermal Management in Data Centers,” Journal of Electronic Packaging, Transactions of the ASME, vol. 137, no. 4, pp. 40801, 2015, doi:10.1115/1.4031326.
- E. Wibron, A.L. Ljung, T.S. Lundström, “Computational fluid dynamics modeling and validating experiments of airflow in a data center,” Energies, vol. 11, no. 3, 2018, doi:10.3390/en11030644.
- R. Sethuramalingam, A. Asthana, Design Improvement of Water-Cooled Data Centres Using Computational Fluid Dynamics, Springer: 105–113, 2021, doi:10.1007/978-3-030-63916-7_14.
- A. Almoli, A. Thompson, N. Kapur, J. Summers, H. Thompson, G. Hannah, “Computational fluid dynamic investigation of liquid rack cooling in data centres,” Applied Energy, vol. 89, no. 1, pp. 150–155, 2012, doi:10.1016/j.apenergy.2011.02.003.
- R. Balakrishnan, M. Munirajulu, “CFD Simulation of Tier 4 Data Center for Cooling and Backup Power,” in 2023 2nd International Conference for Innovation in Technology (INOCON), 1–7, 2023, doi:10.1109/INOCON57975.2023.10101234.
- D. Pickut, Data Center Design: Raised Floor Versus Slab Floor?, 2011.
- H.K. Versteeg, W. Malalasekera, An Introduction to Computational Fluid Dynamics, Second Edition, Pearson, 2007.
- S.V. Patankar, Numerical Heat Transfer and Fluid Flow, First Edition, Hemisphere Publishing Corporation, 1980.
- J.D., Jr. Anderson, Computational Fluid Dynamics: The basics with applications, McGraw-Hill Education, 1995.
- J.H. Ferziger, M. Perić, Computational Methods for Fluid Dynamics, Third Edition, Springer, 2002.
- J. ’Tannehill, A. ’Dale, R. Pletcher, Computational Fluid Mechanics and Heat Transfer, Second Edition, Taylor&Francis, 1997.
- B.E. Launder, D.B. Spalding, “The numerical computation of turbulent flows,” Computer Methods in Applied Mechanics and Engineering, vol. 3, no. 2, pp. 269–289, 1974, doi:10.1016/0045-7825(74)90029-2.
- Ansys, Ansys CFX-Solver Modeling Guide, 2025.
- S.A. Nada, M.A. Said, M.A. Rady, “CFD investigations of data centers’ thermal performance for different configurations of CRACs units and aisles separation,” Alexandria Engineering Journal, vol. 55, no. 2, pp. 959–971, 2016, doi:10.1016/j.aej.2016.02.025.
- D.D. Gray, A. Giorgini, “The validity of the boussinesq approximation for liquids and gases,” International Journal of Heat and Mass Transfer, vol. 19, no. 5, pp. 545–551, 1976, doi:10.1016/0017-9310(76)90168-X.
- Cadence Reality DC Design, https://www.cadence.com/en_US/home/resources/product-briefs/cadence-reality-dc-design-pb.html, 2025.
- E. Frachtenberg, D. Lee, M. Magarelli, V. Mulay, J. Park, “Thermal design in the open compute datacenter,” in ITherm, IEEE: 530–538, 2012, doi:10.1109/ITHERM.2012.6231476.
- H. Alissa, K. Nemati, B. Sammakia, K. Ghose, M. Seymour, R. Schmidt, “Innovative Approaches of Experimentally Guided CFD Modeling for Data Center,” in SEMI-THERM, IEEE: 176–184, 2015, doi:10.1109/SEMI-THERM.2015.7100157.
- M.I. Tradat, Y. Manaserh, B.G. Sammakia, C.H. Hoang, H.A. Alissa, “An experimental and numerical investigation of novel solution for energy management enhancement in data centers using underfloor plenum porous obstructions,” Applied Energy, vol. 289, , 2021, doi:10.1016/j.apenergy.2021.116663.
- ASHRAE TC 9.9, 2021 Equipment Thermal Guidelines for Data Processing Environments.
No related articles were found.