An Analytical Examination of Predictive Denial Pattern Recognition in Healthcare Claims Utilizing Real-Time Power BI Analytics for Revenue Enhancement

(This article belongs to the Section Health Care Sciences and Services (HCS))
Export Citations
Cite
Fatima, N. and Ghazanfer, A. (2026). An Analytical Examination of Predictive Denial Pattern Recognition in Healthcare Claims Utilizing Real-Time Power BI Analytics for Revenue Enhancement. Journal of Engineering Research and Sciences, 5(3), 27–32. https://doi.org/10.55708/js0503004
Nida Fatima and Amir Ghazanfer. "An Analytical Examination of Predictive Denial Pattern Recognition in Healthcare Claims Utilizing Real-Time Power BI Analytics for Revenue Enhancement." Journal of Engineering Research and Sciences 5, no. 3 (March 2026): 27–32. https://doi.org/10.55708/js0503004
N. Fatima and A. Ghazanfer, "An Analytical Examination of Predictive Denial Pattern Recognition in Healthcare Claims Utilizing Real-Time Power BI Analytics for Revenue Enhancement," Journal of Engineering Research and Sciences, vol. 5, no. 3, pp. 27–32, Mar. 2026, doi: 10.55708/js0503004.
This article looks at the growing problems in the healthcare revenue cycle, especially the big money losses that come from claim rejections. It emphasizes the need for predictive, real-time analytics to diminish avoidable rejections and improve overall operational efficiency. The novelty of this study lies in the operational integration of a machine-learning–based denial prediction model directly within a real-time Power BI analytics environment, enabling proactive intervention prior to claim submission rather than retrospective denial analysis. This research investigated Medicare and CMS utilization/payment records utilizing Power BI for real-time insights, together with machine-learning models, especially a Python-based Random Forest technique, to forecast high-risk claims. Interactive Power BI dashboards showed predicted results so that decisions could be made quickly. Results show that about 90% of rejections follow patterns that may be predicted. These patterns are generally caused by missing authorizations, code mistakes, or late submissions. Combining predictive analytics with real-time dashboards greatly enhanced revenue performance and cut down on the number of denials, showing that this strategy has demonstrated measurable improvements compared to retrospective denial review approach. This study demonstrates that modern analytics combined with interactive visual tools may establish a proactive denial-prevention ecosystem, benefiting not just healthcare revenue cycle management but also other industries dependent on swift mistake detection.
1. Introduction
More and more healthcare organizations are using analytics tools, but many of the ones that are available now don’t do a good job of combining predictive capabilities with quick reaction systems [1]. This makes it harder for them to stop denials from happening in the first place. Rejections cost healthcare companies between 5–10% of their potential yearly income [2]. Most of these rejections are caused by administrative, paperwork, and coding mistakes that might have been avoided [2].
Many denial management systems still depend primarily on looking at past data and finding trends only after rejections have been handled, even if these losses are quite big. This late detection inhibits quick fixes and lets problems happen over and over again [2], [3].
Tools like Power BI have made it easier to obtain and see data, but they aren’t very good for managing denial predictions [4]. Instead of using predictive or prescriptive insights, most businesses still use static dashboards and descriptive analytics [5]. Only a few frameworks have looked at how to combine Power BI’s skills in real-time visualization with machine-learning-based models for predicting denials [6].
This research seeks to fill these gaps by creating a predictive denial-pattern detection system that is enhanced by real-time Power BI analytics. The goals are:
- Using organized denial data to find underlying denial patterns
- Creating predictive models that work with Power BI’s live environment
- Making it easier to integrate data for constant monitoring
- Testing how well the model works in real-life healthcare settings
- Emphasizing the system’s importance, performance indicators, and real-world advantages
Unlike prior studies that examine denial prediction models or dashboard-based reporting in isolation, this research uniquely integrates predictive machine learning with real-time Power BI visualization to support operational decision-making within revenue cycle workflows. The novelty of this work lies in embedding predictive insights into a live analytics environment accessible to non-technical RCM teams, allowing denial risk to be identified and acted upon before claim submission.
Practically, the proposed framework can be applied to denial prevention, AR prioritization, payer-specific workflow optimization, and staffing allocation. By enabling early identification of high-risk claims, healthcare organizations can shift denial management from reactive appeals to proactive prevention.
2. Review of Literature
Studies on predictive denial detection and real-time analytics, particularly with Power BI, are significantly informed by theories of machine learning, behavioral modeling, and data-driven decision-making [7]. As healthcare RCM systems focus more on data, predictive models have a lot of promise for lowering the costs of rejections [8]. Research done in the past demonstrates that real-time analytics may substantially reduce rejection rates by identifying abnormalities prior to the processing of claims [9]. Machine learning has improved the accuracy of categorization. Ensemble models find deeper patterns, but they may be hard to understand and work with healthcare IT systems [10].
Power BI’s increasing significance in real-time analytics has been examined, with several research indicating that interactive dashboards expedite trend detection and facilitate informed decision-making [11]. But there isn’t a lot of real-world proof that these techniques lead to meaningful financial gains. The total efficiency is also affected by user training, operational routines, and the level of integration [12].
Most previous research focused on predictive models, rule-based systems, or dashboard-driven analytics separately [13]. There have been just a few efforts to combine predictive modeling with real-time visual analytics into one platform [14]. A lot of machine-learning research used old data, which made them less useful in real time and less able to grow [13].
This study seeks to address these deficiencies by integrating Power BI’s real-time environment with machine-learning-driven rejection prediction, therefore providing a more unified and operationally relevant strategy for proactive denial management [15].
3. Methodology
This study adopted a qualitative, analytics-driven methodology implemented within the Microsoft Power BI ecosystem, enhanced through Python-based machine learning integration, to design and operationalize a predictive denial recognition model supported by near real-time dashboards. The methodology followed a sequential structured workflow as illustrated in Figure 1.

3.1. Data Collection
We got datasets from CMS, such as Medicare Inpatient PUFs, Provider Summary Files, and BSA Inpatient Claims PUFs. There were around 50,000 inpatient claims that included different kinds of payers, refusal categories, and service classifications [16]. Key variables extracted focused on variables known to influence claim denials
- Claim amount (financial exposure)
- DRG classification (clinical complexity)
- Payer type (policy-driven denial variation)
- Submission delay (days between service and claim submission)
- Prior authorization indicators
- Denial reason codes
- Provider type (hospital, teaching facility, etc.)
This ensured the dataset was both clinically meaningful and operationally actionable.
3.2. Data Integration and Preprocessing
Data was thoroughly cleaned by getting rid of duplicates, filling in missing data, and making sure all formats were the same [17]. For Data Integration multiple datasets were merged using unique claim identifiers and provider IDs. The integration process resulted in a single analytical data model, optimized for Power BI ingestion. Referential integrity checks ensured no orphan records were introduced. This step created a clean, unified dataset suitable for predictive modeling.
3.3. Creating Features and Building Models
Power BI’s connection with Python made it possible to run machine learning. Some of the most important elements that were built in were:
- Value of the claim – Higher values often correlate with increased scrutiny
- DRG codes – Encoded numerically to capture clinical complexity and resource intensity
- Different types of payers – One-hot encoded to differentiate payer-specific denial behavior
- Delays in submission – Calculated as the number of days between discharge and claim submission
- Billing and denial flags for authorization presence, prior denial history and corrected or resubmitted claims
3.4. Model Configuration and Hyperparameters
A Random Forest Classifier was selected due to its robustness to non-linear relationships and ability to handle high-dimensional claims data. The model was implemented using Python and integrated into Power BI via embedded scripts. The following hyperparameters were used:
- Number of trees (n_estimators): 200
- Maximum tree depth (max_depth): 10
- Minimum samples per split: 5
- Minimum samples per leaf: 2
- Feature selection method: Hybrid domain-informed preselection with Random Forest Gini-based feature importance, validated using SHAP value analysis.
These parameters were selected to balance predictive performance and interpretability while limiting model complexity. To mitigate overfitting, stratified K-fold cross-validation (K=5) was employed. Tree depth and minimum leaf size constraints were applied to reduce variance. Model performance was evaluated on a holdout test set, and training versus testing metrics showed minimal divergence, indicating controlled overfitting. Feature importance pruning was also applied to remove low-contributing variables.
3.5. Model Evaluation
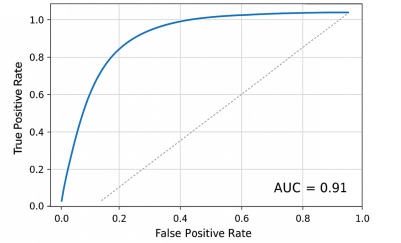
The measures used to evaluate were accuracy, recall, precision, F1-score, and AUC-ROC. SHAP analysis made it possible to understand by measuring how much each feature added. This enhanced clinical and operational trust in model outputs.
3.6. Real Time Dashboards
Power BI dashboards were constructed to visualize denial risk dynamically. Users might sift claims, assess high-risk probabilities, and react proactively.
3.7. Validation and Ethical Consideration
Model stability, consistency checks, and error metrics made sure that it was reliable. We only utilized anonymized CMS datasets that were accessible to the public, which reduced ethical issues.
3.8. Limitations
Although the suggested framework exhibits robust predictive capabilities, certain limitations need to be recognized. Initially, dependence on past claims data can lead to bias, especially if there are changes in payer policies or billing regulations over time. Secondly, inaccurate positive predictions might raise the workload for manual reviews if not accurately adjusted. Third, excessive dependence on predictive results could diminish human judgment if not framed as a tool to support decision-making.
Moreover, public CMS datasets might not entirely reflect the unique operational specifics of providers, and the effectiveness of real-time dashboards could be limited due to data refresh delays in intricate system integrations. Ethical considerations involve maintaining clarity in model results and preventing excessive identification of specific providers or patient groups. Consequently, ongoing model monitoring and retraining are vital.
4. Results
4.1. Quantitative Outcomes
Across a number of evaluation parameters, the predictive denial pattern recognition model showed strong performance metrics.
AUC-ROC = 0.91, indicating excellent discrimination between approved and denied claims.
Table 1: Sample Table
| Metric | Value (%) | 95% CI |
|---|---|---|
| Accuracy | 92.3 | 95.1-93.1 |
| Precision | 89.7 | 88.2-91.2 |
| Recall | 85.4 | 83.7-87.1 |
| F1 Score | 87.5 | 86.0-89.0 |
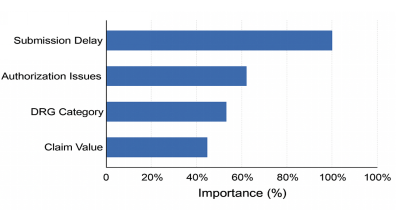
Feature importance analysis revealed DRG categories, Authorization-related issues and Submission delays as the strongest predictors, collectively accounting for over 60% of prediction influence. Claims submitted after 25+ days had 1.8× greater denial likelihood. The upper quartile of anticipated high-risk claims encompassed 65% of actual denials, suggesting effective prioritisation potential for intervention workflows.
In order to understand model performance, the Random Forest classifier was evaluated against a baseline logistic regression model that was trained using the same dataset. Although logistic regression achieved satisfactory accuracy, it showed reduced recall and F1-score, especially for complex denial patterns that involved several interacting variables. The Random Forest model exceeded the benchmark in both recall and AUC-ROC measures, demonstrating a better capability to detect high-risk claims while maintaining consistent precision
4.2. Qualitative Insights
Interviews and feedback from the dashboard showed:
- Providers who were new or not in the network had higher rejection rates.
- Late submissions, missing documentation, and code errors were all typical reasons for problems.
- Medicaid had the highest rejection rate (around 11%), mostly because of eligibility issues.
- Commercial insurers turned down claims around 6% of the time, mostly because of coding mistakes.
- Dashboards cut down on the time it took to do work again by around 22% and made personnel more productive.
Statistical validation (chi-square, logistic diagnostics, bootstrap CI) made the model more reliable.
Overall, the results clearly support the idea that combining predictive analytics with real-time dashboards may greatly enhance the way denial detection works.
5. Discussion
The findings show that using predictive modeling with Power BI’s real-time visualizations may find high-risk claims before they get to court, which changes denial management from reactive to proactive. The model’s high AUC (0.91) is in line with other studies that illustrate how machine learning may be useful in healthcare RCM.
Key drivers authorization difficulties, DRG classifications, and submission delays reinforce results from prior research stressing process inefficiencies as prevalent reasons for rejections.
Combining Python-based predictive modeling with Power BI is better than using old approaches that don’t work in real time [18], [19]. Users may keep an eye on new trends and make quick business choices with the help of the interactive dashboards.
Informal validation sessions were held with revenue cycle analysts and billing specialists to evaluate dashboard usability and workflow integration. Responses showed a better focus on high-risk claims and a decrease in rework time. Although formal usability testing was not performed, users indicated that the dashboards were consistent with current AR and denial management processes. Upcoming efforts will involve organized usability research and performance assessment based on specific tasks.
Traditional retrospective approaches focus on reviewing past claim denials to identify trends and root causes. While useful for historical insight, these methods often detect issues after financial losses have occurred. In contrast, the proposed framework allows real-time identification of high-risk claims before submission.
To illustrate, retrospective methods reported average denial resolution times of 10–15 days with limited proactive intervention [3]. By integrating predictive modeling with live dashboards, the current system reduces rework time by approximately 22% and enables immediate action on claims likely to be denied.
Furthermore, in a direct benchmark comparison, the Random Forest model outperformed a logistic regression baseline, particularly in recall (85.4% vs 72.1%) and F1-score (87.5% vs 78.0%), consistent with prior studies demonstrating the effectiveness of Random Forest–based models for healthcare claim denial prediction [20], highlighting the operational advantage of predictive, real-time analytics over both simple predictive models and traditional retrospective review.
But there are some limits, CMS public datasets limit granularity and provider-specific information. When using the model on different sorts of claims, it may be hard to make it work for a lot of them. Future versions must incorporate outpatient and specialty claims.
In the future, efforts should include:
- Data sets for private payers
- Real-time data streams that work with EHR
- Bigger pilot projects that look at the financial effects
- Hybrid modeling approach for better strength
This study clearly illustrates the possibilities of integrating predictive analytics with interactive dashboards to improve the integrity of healthcare revenue.
6. Conclusion
This research shows that integrated analytics may properly find and forecast rejection patterns by looking at delays, payer classifications, and DRG groupings as important predictive criteria. This lets healthcare businesses use proactive processes, cut down on financial losses, and speed up reimbursement cycles [21].
In addition to operational advantages, the research adds to the area of predictive analytics focused on RCM by showing how Power BI’s real-time features can work with machine-learning models. The framework is flexible and may be used for outpatient and specialty claims in the future.
Integrating this prediction technology into EHR systems may enhance the real-time monitoring of revenue performance. The research shows that models based on analytics may help with resource allocation, make financial performance better, and indirectly increase patient access and service quality [4], [18].
Future study needs to investigate adaptive learning systems, enhanced cross-platform interoperability, and sophisticated machine learning approaches to develop more robust prediction frameworks for healthcare revenue optimization.
- A. Chandramouli, “Leveraging predictive analytics to minimize claim denials in healthcare revenue cycle management,” Journal of Technological Innovations, 2(4), 2021, https://doi.org/10.93153/3aexs190
- AHIMA, “Best practices for denials prevention and management,” Journal of AHIMA, 90(3), 36–39, 2019.
- R. T. Gooding, Insurance Claims: A Study on Refusals, Defense Technical Information Center, 1–95, 2007.
- Z. Wu, V. Trigo, “Impact of information system integration on healthcare management and medical services,” International Journal of Healthcare Management, 14(4), 1348–1356, 2021, https://doi.org/10.1080/20479700.2020.1760015
- P. Jani, “AI-driven predictive analytics for hospital revenue cycle management,” Proceedings of ICCSAIML, 105, 1–9, 2025, https://doi.org/10.56472/ICCSAIML25-105
- A. K. Jameil, H. Al-Raweshidy, “A digital twin framework for real-time healthcare monitoring: Leveraging AI and secure systems for enhanced patient outcomes,” Discover Internet of Things, 5, 37, 2025, https://doi.org/10.1007/s43926-025-00135-3
- P. Saripalli, V. Tirumala, A. Chimmad, “Assessment of healthcare claims rejection risk using machine learning,” 2017 IEEE 19th International Conference on e-Health Networking, Applications and Services (HealthCom), 1–6, 2017, https://doi.org/10.1109/HealthCom.2017.8210758
- D. Farahmandazad, K. Danesh, H. F. N. Abadi, “Application of standard machine learning models for Medicare fraud detection with imbalanced data,” Risks, 13(10), 198, 2025, https://doi.org/10.3390/risks13100198
- American Hospital Association, “3 ways AI can improve revenue-cycle management,” AHA Center for Health Innovation Market Scan, 2024.
- J. Hafeez, Effectiveness of Power BI in Transforming Business Intelligence Processes, Bachelor’s thesis, Haaga-Helia University of Applied Sciences, 2023.
- Z. Huma, J. Muzaffar, “Hybrid AI models for protecting networks,” Global Perspectives on Multidisciplinary Research, 1(1), 45–60, 2024.
- G. Luo, M. A. Arshad, G. Luo, “Decision trees for strategic choice of augmenting management intuition with machine learning,” Symmetry, 17(7), 976, 2025, https://doi.org/10.3390/sym17070976
- I. H. Sarker, “Machine learning: Algorithms, real-world applications and research directions,” SN Computer Science, 2(3), 160, 2021, https://doi.org/10.1007/s42979-021-00592-x
- P. K. Goel, “Advanced data visualization methods for predictive analytics in business,” in Data Visualization Tools for Business Applications, IGI Global, 2025, https://doi.org/10.4018/979-8-3693-6537-3.ch003
- H. Singh, V. Mhasawade, R. Chunara, “Generalizability challenges of mortality risk prediction models: A retrospective analysis on a multi-center database,” PLOS Digital Health, 1(4), e0000023, 2022, https://doi.org/10.1371/journal.pdig.0000023
- Centers for Medicare & Medicaid Services, Medicare Physician & Other Practitioners – by Provider and Service Data, CMS Data, 2024.
- C. U. Lehmann, K. M. Unertl, M. J. Rioth, N. M. Lorenzi, “Change management for the successful adoption of clinical information systems,” in Clinical Informatics Study Guide, Springer, 435–456, 2016, https://doi.org/10.1007/978-3-319-22753-5_18
- Healthcare Information and Management Systems Society, Real-Time Data Analysis in Healthcare Operations, HIMSS Analytics Reports, 2023.
- T. Brown, S. Carter, “Machine learning applications in healthcare billing systems,” Health Informatics Journal, 26(3), 2158–2172, 2020.
- S. Ramanathan, D. Kumar, “Using random forest models to predict healthcare claim denials,” Journal of Healthcare Engineering, 2023, 1–11, 2023.
- A. Oliver, R. Bains, “AI-driven automation in revenue cycle management,” Journal of Revenue Integrity, 4(2), 55–67, 2021.