Identification of Walking Balance using Acceleration Sensors
(This article belongs to the Special Issue on SP8 (Special Issue on Digital and Engineering Transformations in Science and Technology (SI-DETST-26)) and the Section Medical Informatics (MDI))
Export Citations
Cite
Chen, J. , Hirokane, M. and Horiguchi, Y. (2026). Identification of Walking Balance using Acceleration Sensors. Journal of Engineering Research and Sciences, 5(5), 1–11. https://doi.org/10.55708/js0505001
Junyu Chen, Michiyuki Hirokane and Yukio Horiguchi. "Identification of Walking Balance using Acceleration Sensors." Journal of Engineering Research and Sciences 5, no. 5 (May 2026): 1–11. https://doi.org/10.55708/js0505001
J. Chen, M. Hirokane and Y. Horiguchi, "Identification of Walking Balance using Acceleration Sensors," Journal of Engineering Research and Sciences, vol. 5, no. 5, pp. 1–11, May. 2026, doi: 10.55708/js0505001.
The risk of falling increases with age, affecting approximately one in three individuals over 65 and one in two over 80 annually. In Japan, the fall rate among older adults ranges from 8.5% to 25.3%, and falls are a major cause of fractures and long-term care needs. Balance impairment is one of the key factors contributing to falls, as maintaining the body’s center of gravity within the base of support is essential for stable walking. To address this issue, this study proposes a method for classifying balance conditions during walking using acceleration data collected from four sensors attached to the waist. Two classification approaches were examined: MiniROCKET as a kernel-based method, and InceptionTime as a deep learning method. By comparing these two representative time-series classification paradigms, the study aims to clarify which approach is more suitable for gait balance assessment. Furthermore, a preliminary analysis was conducted to determine the optimal number and placement of sensors. The results suggest that the proposed method can effectively identify deviations from normal gait, indicating its potential for anomaly detection in walking balance. Identifying the minimal number of sensors required to maintain sufficient accuracy is crucial for practical applications, and this study provides a foundation for future verification with elderly populations to enhance long-term daily monitoring and fall-risk prevention.
1. Introduction
As individuals age, the risk of falling increases significantly. It has been reported that one in three people aged 65 and older experience at least one fall per year, and this incidence rises to one in two among those aged 80 and above [1]. In Japan, the annual fall rate among elderly individuals aged 65 and over ranges from 8.5% to 25.3%, with this rate increasing as age advances according to the survey (Cabinet Office, Government of Japan, 2005, https://www8.cao.go.jp/kourei/ishiki/). Moreover, falls are the primary cause of fractures in older adults, notably proximal femur fractures, and constitute a major factor leading to the need for long-term care. Even when falls do not result in death, the resulting injuries, particularly fractures, severely impact physical functioning and pose serious issues [2].
Falls can be attributed to external environmental factors, such as inappropriate footwear, slippery flooring, poor or overly bright lighting, and carrying heavy loads. Internal factors related to individual characteristics include impaired balance, reduced muscle strength, visual impairments, and medication use, among others [2]. Particularly, it has been reported that the walking ability of elderly individuals is significantly influenced by both static and dynamic balance functions [3], and declines in these balance functions are closely associated with an increased risk of falls [4]. Balance function refers to the ability to maintain or restore equilibrium by keeping the body’s center of gravity within the support base under gravitational conditions [5]. Preventing falls is crucial for enhancing the quality of life (QOL) of elderly individuals, and physical exercise has been reported as an effective intervention for this purpose [2]. However, elderly individuals are at risk of losing balance during physical activities, increasing the likelihood of falls.
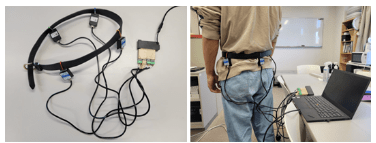
To address falls caused by balance impairment during walking and exercise, this study proposes a method to identify three different balance conditions using acceleration data collected during walking. Specifically, acceleration data were gathered using four acceleration sensors attached to the waist during walking. Previous research has indicated that the rotation of the body around the three axes of the trunk, centered on the hips, is essential for evaluating fall risks [6]. Following this biomechanical reasoning, as shown in Figure 1, the sensors were strategically placed on the front, back, left, and right sides of the waist to capture multi-axial gait stability. Two classification approaches were examined: MiniROCKET as a kernel-based method [7], and InceptionTime as a deep learning method [8].
This study compares MiniROCKET, a feature-based kernel method, and InceptionTime, an end-to-end deep learning model, to examine which approach is more suitable for classifying short, low-dimensional acceleration data obtained during walking. The comparison aims to clarify the advantages and limitations of these two-representative time-series classification paradigms when applied to gait balance assessment.
Furthermore, since the number and placement of sensors directly affect both recognition accuracy and user comfort, we conducted a preliminary analysis to determine an optimal sensor configuration. Identifying the minimal number of sensors required to maintain sufficient accuracy is crucial for practical applications such as long-term daily monitoring and fall-risk prevention in elderly individuals.
2. Experimental Methods
In the experiment, subjects wore data collection devices consisting of acceleration sensors attached at four locations around the waist: (front, back, left, right). The devices collected data on acceleration, angular velocity, and angles under three different walking conditions, as illustrated in Figure 2. These conditions were walking with a 1 kg weight attached to the left leg (Figure 2(a)), walking with a 1 kg weight attached to the right leg (Figure 2(b)),
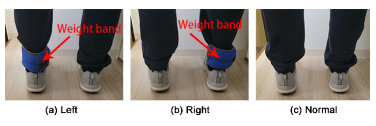
and normal walking without weights (Figure 2(c)). The weights used were “weight bands,” educational tools simulating the physical experience of elderly individuals using simulation equipment (Sanwa Manufacturing, 2025, https://www.sanwa303.co.jp/product/914/).The purpose of attaching these weights was to simulate leg injuries or fatigue. While these weights are tools for simulating the physical experiences of elderly individuals, it should be noted that they may not perfectly replicate the complex gait patterns of geriatric populations. However, this setup serves as a preliminary evaluation of the system’s ability to detect gait anomalies. Each walking condition lasted approximately 5 minutes. The subjects consisted of five male university students in their twenties.
The acceleration sensors used in the experiment were high-precision HWT901B-TTL sensors(Wit-Motion, China; technical specifications available at: https://www.wit-motion.com/hwt901b-ttl.html). As shown in Figure 1, the sensors were mounted at the front, back, left, and right positions on a belt. Each sensor recorded data at 0.1s intervals (10Hz) during walking, including acceleration, angular velocity, and orientation. Each sensor measured nine variables in total: acceleration , angular velocity , and Euler angles . The acceleration components represent changes in acceleration along the left–right, up–down, and front–back directions, respectively, and are used to evaluate walking patterns and stability. The Euler angles correspond to roll, pitch, and yaw, respectively, describing the subject’s posture and orientation in three-dimensional space. Specifically, roll () represents rotation around the x-axis (forward–backward tilt), pitch () represents rotation around the y-axis (left–right tilt), and yaw () represents rotation around the z-axis (horizontal rotation). The angular velocity components represent the rate of change of these rotations about each corresponding axis, reflecting how quickly the body changes orientation during walking.
The collected data were saved in MATLAB format and exported into four CSV files according to sensor IDs. Missing values with sampling intervals exceeding 0.1s were detected and corrected using linear interpolation based on adjacent data points.
3. Data Processing
3.1. ROCKET
ROCKET (Random Convolutional Kernel Transform) [9] is a method that utilizes random convolutional kernels for time series classification along with a simple linear classifier. ROCKET transforms time series data using numerous random convolutional kernels (random length, weights, biases, dilation, padding, and stride) and trains a linear classifier using the transformed features. Each convolutional kernel in ROCKET generates two features: the proportion of positive values (PPV) and the maximum value, enabling the classifier to account for the frequency of specific patterns within the time series.
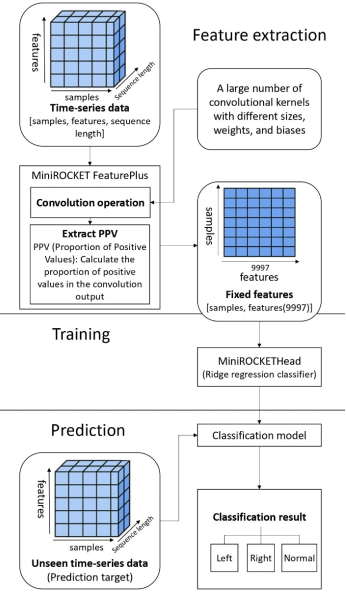
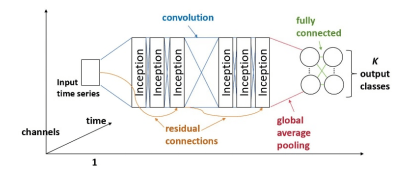
Table 1: Differences between MiniROCKET and ROCKET [7].
| Property | ROCKET | MiniROCKET |
|---|---|---|
| Length | {7, 9, 11} | 9 |
| Weights | N(0, 1) | {-1, -2} |
| Bias | μ(-1, 1) | From convolution output |
| Dilation | Random | Fixed, relative to input length |
| Padding | Random | Fixed |
| Features | PPV + max | PPV |
| Number of features | 20K | 10K |
3.2. MiniROCKET
MiniROCKET [7] is an improved version of ROCKET, structured into three phases: feature extraction, learning, and prediction, as shown in Figure 3. It transforms time-series data using a small number of fixed convolution kernels and extracts features through PPV pooling. These extracted features are then used to train and classify with a linear classifier. Table 1 summarizes the differences in convolutional kernel parameters between MiniROCKET and ROCKET.
MiniROCKET aims to achieve faster processing speeds by limiting parameters while maintaining comparable accuracy. Similar to ROCKET, MiniROCKET also uses convolutional kernels to train a linear classifier with transformed features. However, MiniROCKET differs from ROCKET by employing a smaller, fixed set of convolutional kernels and adopting an almost entirely deterministic approach. Unlike ROCKET, MiniROCKET generates only the proportion of positive values (PPV) as features.
3.3. InceptionTime
InceptionTime [8] is a deep learning model designed for time series classification, consisting of multiple parallel Inception modules that use convolutional kernels of different lengths to capture both local and global patterns. The architecture typically includes stacked Inception modules, a Global Average Pooling layer, and a Dense layer with softmax activation for classification, as shown in Figure 4. Residual connections are employed to stabilize training and mitigate vanishing gradients, while an ensemble of multiple networks is often used to improve generalization performance.
MiniROCKET and InceptionTime were selected because they represent two distinct approaches to time-series classification. MiniROCKET offers a lightweight, deterministic, and extremely fast training process, which is advantageous for tasks requiring repeated experiments—such as searching for optimal time-window lengths, testing additional feature sets, and verifying model robustness—since results can be obtained quickly and reproducibly. This computational efficiency is particularly beneficial for resource-constrained wearable applications, as it significantly reduces the time and energy required for model training and deployment.
In contrast, InceptionTime is a deep-learning model that learns hierarchical temporal features directly from raw multichannel data. Its multi-scale convolutional structure enables it to model interactions and correlations among multiple sensor inputs (front, back, left, and right sensors) and to generalize well across diverse subjects with varying gait patterns and body types. The comparison of these two complementary paradigms allows evaluation of both computationally efficient and
deeply expressive approaches for gait balance classification using wearable sensors.
3.4. Time Series Processing
The raw data underwent Z-score standardization [10] before being reshaped into the format [samples × variables × sequence length], where samples denotes the total number of segmented data points, variables the number of features, and the sequence length (set to 24, equivalent to 2.4 seconds) corresponds to twice the average walking cycle duration. A sliding window approach was employed to generate the time series segments for training. After preprocessing, the dataset comprised 8,629 samples for Subject A, 9,129 for Subject B, 8,198 for Subject C, 7,588 for Subject D, and 8,608 for Subject E, amounting to 42,152 samples in total. The processed dataset was then divided into training, validation, and test sets in a 6:2:2 ratio, a common practice in deep learning-based time series classification.
This study examined three scenarios, each differing in the number and types of features used, though employing identical training methods. In the four-sensor prediction scenario (front, back, left, right), each sensor collected nine data types, totaling 36 features, formatted as [samples × 36 × 24]. In the two-sensor prediction scenario (front-back and left-right), each sensor collected nine data types, totaling 18 features, formatted as [samples × 18 × 24]. For single-sensor predictions (front, back, left, right individually), each sensor collected nine data types, formatted as [samples × 9 × 24].
3.5. Model Training Procedures
Feature extraction was performed using MiniRocketFeaturesPlus, a feature extraction model based on the MiniROCKET algorithm (I. Oguiza, 2020, https://github.com/timeseriesAI/tsai). This model was fitted to the training dataset to extract unique feature patterns. Using the fitted model, feature extraction was applied simultaneously to all data in the training, validation, and test sets, resulting in 9,996 features.
Finally, a time series model was constructed using the MiniRocketHead classifier model (available in the tsai library), evaluating its performance through precision, recall, and F-score metrics. The training was conducted
Table 2: Subject-averaged macro Precision, Recall, and F1-scores for MiniROCKET and InceptionTime.
| Configuration | MiniROCKET | InceptionTime | ||||
|---|---|---|---|---|---|---|
| Prec. | Rec. | F1 | Prec. | Rec. | F1 | |
| 4BLR | 0.93 | 0.93 | 0.93 | 0.91 | 0.90 | 0.90 |
| 2FB | 0.93 | 0.92 | 0.92 | 0.88 | 0.86 | 0.86 |
| 2LR | 0.90 | 0.89 | 0.89 | 0.86 | 0.86 | 0.86 |
| Front | 0.96 | 0.95 | 0.95 | 0.98 | 0.98 | 0.98 |
| Back | 0.97 | 0.96 | 0.96 | 0.98 | 0.98 | 0.98 |
| Left | 0.94 | 0.94 | 0.94 | 0.97 | 0.96 | 0.96 |
| Right | 0.94 | 0.94 | 0.94 | 0.96 | 0.96 | 0.95 |
over 50 epochs with early stopping, using an initial learning rate set at 10-4.
In addition, an InceptionTime model was trained directly on the original time series data without feature extraction. Training was performed for up to 50 epochs with early stopping, using an initial learning rate of 10-4, and model performance was evaluated with the same metrics as MiniROCKET. In this model, the convolutional dropout rate was set to 0.6 to enhance regularization and mitigate overfitting, while all other hyperparameters were kept at their default values.
4. Experimental Results
4.1. Individual-specific Results
Models based on MiniROCKET and InceptionTime were trained separately for each of the five subjects using the processed training sets, and evaluated with their corresponding test sets. The classification performance of MiniROCKET and InceptionTime models across various sensor configurations for the five subjects (A-E) is summarized in Tables A1–A4 in Appendix A, where Tables A1 and Tables A2 correspond to MiniROCKET, and Tables A3 and Tables A4 correspond to InceptionTime.
Tables A1 presents the MiniROCKET results for multi-sensor configurations (four-sensor (4FBLR) and two-sensor (2FB, 2LR) combinations), summarizing Precision (Prec.), Recall (Rec.), and F1-scores (F1) for each subject.
Tables A2 shows the MiniROCKET results for single-sensor configurations (Front, Back, Left, Right) under the same evaluation metrics.
Similarly, Tables A3 and Tables A4 summarize the corresponding results for the InceptionTime model, with Tables A3 presenting the multi-sensor configurations and Tables A4 the single-sensor configurations.
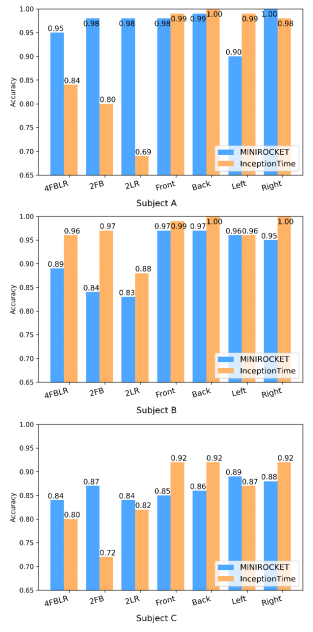
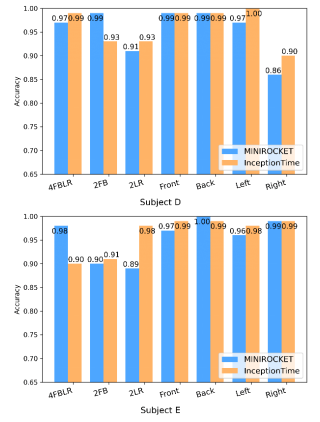
Figure 5 presents bar charts of classification accuracy for each subject under different sensor configurations. Here, the differences in classification accuracy between the two models (MiniROCKET and InceptionTime) are visualized for each of the five subjects. The bar charts represent accuracy values derived from Tables A1-A4, covering seven sensor configurations: four-sensor (4FBLR), two-sensor (2FB and 2LR), and single-sensor setups (Front, Back, Left, Right).
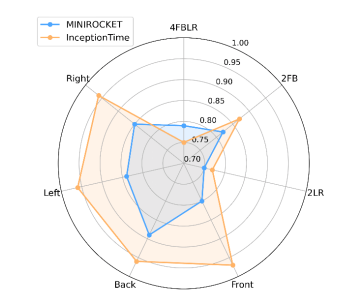
To provide a clearer comparative view, macro-averaged Precision, Recall, and F1-scores across subjects were calculated (Tables 2), and radar charts illustrating macro F1-scores across configurations were plotted (Figure 6). Overall, both models achieved high accuracy but demonstrated distinct tendencies depending on the sensor combinations and individual differences.
4.2. Performance of MiniROCKET
From the macro-averaged F1-scores (Tables 2), MiniROCKET maintained relatively consistent classification performance across different sensor configurations. In multi-sensor settings such as four sensors (4FBLR) (F1 = 0.93), two sensors front–back (2FB) (F1 = 0.92), and two sensors left–right (2LR) (F1 = 0.89), the results were stable, though slightly lower than those obtained with single-sensor setups. In single-sensor conditions, particularly at the front (F1 = 0.95) and back (F1 = 0.96) positions, higher scores were observed. These findings suggest that data from the front and back sensors may provide relatively more representative information for distinguishing gait patterns.
4.3. Performance of InceptionTime
InceptionTime showed a somewhat different trend. In multi-sensor configurations (Tables 2), its performance was lower compared to MiniROCKET, for instance four sensors (4FBLR) (F1 = 0.90), two sensors front–back (2FB) (F1 = 0.86), and two sensors left–right (2LR) (F1 = 0.86), indicating a higher sensitivity to noise and redundant inputs. In contrast, in single-sensor conditions, the model performed comparatively well, particularly at the front and back positions where F1 values reached 0.98. This suggests that InceptionTime can extract useful temporal features from a single input channel and may perform better when the input dimensionality is reduced.
4.4. Comparative Analysis
After comparing the two models through radar charts of subject-averaged macro comparison for MiniROCKET and InceptionTime (Figure 6), it can be observed that MiniROCKET tended to provide more stable results under multi-sensor configurations, whereas InceptionTime yielded relatively better results in single-sensor settings. Taken together, these observations indicate that adding
different sensor configurations.
more sensors does not necessarily improve classification performance, and in some cases may even reduce it due to additional noise and the summation of motion artifacts from multiple attachment points. For applications requiring a simple system design, single-sensor setups—particularly at the front or back positions—appeared sufficient in this experiment. When multi-sensor redundancy is needed, MiniROCKET appeared to handle such inputs more consistently.
4.5. Analysis of Individual Differences
By examining Figure 5, the results at the individual level revealed notable variation across subjects. For MiniROCKET, most subjects showed stable performance across sensor configurations, though some differences were evident. Subject A consistently obtained high accuracy (0.95–1.00), suggesting relatively stable gait features. In contrast, Subjects B and C were more sensitive to configuration changes; for example, Subject B’s recall for the Right class dropped to 0.62 under the two sensors front–back (2FB) setup, while Subject C showed lower recall for the Left class (0.55–0.77), resulting in lower overall accuracy. Subjects D and E generally achieved higher scores across configurations, with accuracies often above 0.95.
For InceptionTime, individual differences were more pronounced. Subjects A and C showed noticeable performance decreases in multi-sensor conditions, particularly for the Normal class recall (as low as 0.55-0.64), leading to overall accuracies of 0.69-0.84. However, in single-sensor conditions, their performance improved (Accuracy 0.95). Subjects B, D, and E maintained relatively high accuracy across all configurations (0.90-1.00), with Subject B achieving close to perfect results in several cases.
MiniROCKET and InceptionTime
under different sensor configurations (combined-subject training).
4.6. Potential Sources of Interference
During the experiments, some non-gait factors were observed that may have affected model performance. The sensors experienced slight shaking during walking, which could introduce noise and reduce classification reliability. In addition, natural arm swings occasionally came into contact with the sensors placed at the sides of the waist, generating additional disturbances. These factors may partly explain the performance drops observed for some subjects under multi-sensor configurations and highlight certain limitations of the current experimental setup.
4.7. Combined-subject Results
To reduce bias from individual-specific characteristics and to more comprehensively evaluate model applicability in cross-subject scenarios, training was conducted using combined data from five subjects. Tables A5 in Appendix A presents the classification performance of MiniROCKET and InceptionTime across different sensor configurations based on the combined data from five subjects. Figure 7 illustrates radar charts of macro F1 performance across configurations.
For MiniROCKET, macro-averaged performance under multi-sensor configurations was relatively limited, with F1 values around 0.75–0.82 for four-sensor (4FBLR) and two-sensor (2FB, 2LR) setups. Among these, the two sensors left–right (2LR) configuration showed the lowest scores. This may reflect greater variability in lateral waist signals across individuals, making it more difficult for the model to extract consistent features. In contrast, the two sensors front–back (2FB) two-sensor configuration performed comparatively better. A possible explanation is that balance loss during walking tends to manifest as forward or backward leaning rather than lateral sway. Consequently, sensors placed at the front and back may capture more distinctive motion patterns related to balance changes, allowing the models to separate walking conditions more effectively. In single-sensor settings, particularly at the back position (F1 = 0.89), performance further improved, suggesting that this position may provide more representative motion information.
InceptionTime showed a different trend, performing particularly well in single-sensor conditions. At the front and back positions, macro F1 values reached 0.96–0.97, close to optimal, suggesting that the model was able to capture essential temporal features effectively when the input dimensionality was low. However, its performance decreased with multi-sensor inputs. For example, the four-sensor (4FBLR) configuration yielded a macro F1 of 0.75, considerably lower than its single-sensor results. The two sensors front–back (2FB) two-sensor configuration performed somewhat better (F1 = 0.87), but the overall tendency still indicated sensitivity to multi-source inputs.
In summary, MiniROCKET appeared to produce more stable results with multi-sensor inputs in the combined-subject setting, whereas InceptionTime performed better under single-sensor conditions. These findings are consistent with the individual-subject analyses, reinforcing the observation that increasing the number of sensors does not necessarily improve performance and may even introduce noise-related degradation. From a practical perspective, a single waist-mounted sensor—particularly at the front or back position—already demonstrated high discriminative ability in this study, while also reducing system complexity and deployment cost.
5. Conclusion
In this study, we constructed classification models using MiniROCKET and InceptionTime based on walking acceleration data collected from four acceleration sensors attached at the waist. These models were trained to identify three different balance conditions. Their performance was evaluated, and a preliminary investigation regarding the optimal number and placement of sensors was conducted. The main findings of this research are summarized below:
- Models achieved 86–98% accuracy when trained on individual subject data. Under combined-subject training, accuracy ranged from 75–97%, indicating not only a general decrease but also greater variability across configurations and subjects. This reduction is likely due to variations in sensor placement and data distribution stemming from differences in subjects’ height, waist circumference, and walking patterns. While both models were affected, MiniROCKET tended to provide more stable results across subjects, whereas InceptionTime showed larger performance fluctuations in multi-subject settings.
- Regarding the number of sensors, the single-sensor models yielded the highest accuracy, followed by four-sensor models and then two-sensor models. Increasing the number of sensors did not enhance prediction accuracy, likely because sensor vibrations introduced noise that complicated both training and inference. This trend was consistent across both models; however, InceptionTime in particular benefited from reduced input dimensionality and achieved especially high scores in the single-sensor condition.
- In terms of sensor placement, single sensors positioned in the anterior-posterior direction demonstrated higher predictive performance than those placed laterally. This suggests that, during walking, imbalances cause more substantial posture variations in the anterior-posterior direction than in the lateral direction, making front-back sensors more effective at detecting balance disturbances. Both models reflected this tendency, with InceptionTime showing relatively higher accuracy at the front and back positions compared to MiniROCKET.
Overall, these findings indicate that MiniROCKET and InceptionTime exhibit complementary characteristics: MiniROCKET tended to provide more robust performance with multi-sensor inputs, while InceptionTime achieved higher accuracy in single-sensor configurations. While this study demonstrated high accuracy in identifying balance conditions for specific individuals and suggests the potential for anomaly detection—specifically in identifying gait patterns that deviate from a person’s normal state—further evaluation is required to develop identification methods that account for individual differences between different subjects. Future research will involve gait experiments with elderly participants to evaluate the reproducibility of the elderly simulation equipment and assess the system’s effectiveness in real-world geriatric care. Additionally, increasing the sample size will be a priority to further investigate the potential for improving classification accuracy and refining the robustness of the single-sensor system for practical, long-term daily monitoring.
- M. E. Tinetti, M. Speechley, and S. F. Ginter, “Risk factors for falls among elderly persons living in the community,” New England Journal of Medicine, vol. 319, no. 26, pp. 1701–1707, 1988, doi:
10.1056/NEJM198812293192604. - Y. Otaka, “Current status and issues of fall prevention in the elderly,” Journal of Japan Society for Fall Prevention, vol. 1, no. 3, pp. 11–20, 2014 (article in Japanese with an abstract in English), doi:
10.11335/tentouyobou.1.3_11. - T. Ikasai, T. Tatsuno, and S. Miyano, “Relationship between walking ability and balance function,” Japanese Journal of Rehabilitation Medicine, vol. 43, no. 12, pp. 828–833, 2006 (article in Japanese with an abstract in English), doi:
10.2490/jjrm1963.43.828. - K. Berg, S. Wood-Dauphinee, J. I. Williams, and D. Gayton, “Measuring balance in the elderly: development and validation of an instrument,” Canadian Journal of Public Health, vol. 83, no. S2, pp. S7–S11, 1992.
- L. M. Nashner, C. L. Shupert, F. B. Horak, and F. O. Black, “Organization of posture controls: an analysis of sensory and mechanical constraints,” Progress in Brain Research, vol. 80, pp. 411–418, 1989, doi:
10.1016/S0079-6123(08)62237-2. - Y. Murakami, M. Shogenji, and T. Watanabe, “Effects of task type and aging on shoulder rotational movement with respect to the hips while walking under multiple task conditions,” Journal of Nursing Science and Engineering, vol. 8, pp. 230–241, 2021 (article in Japanese with an abstract in English), doi:
10.24462/jnse.8.0_230. - A. Dempster, D. F. Schmidt, and G. I. Webb, “MiniROCKET: a very fast (almost) deterministic transform for time series classification,” Proceedings of the 27th ACM SIGKDD Conference on Knowledge Discovery and Data Mining, pp. 248–257, 2021, doi:
10.1145/3447548.3467231. - H. Ismail Fawaz, B. Lucas, G. Forestier, C. Pelletier, D. F. Schmidt, J. Weber, G. I. Webb, L. Idoumghar, P.-A. Muller, and F. Petitjean, “InceptionTime: finding AlexNet for time series classification,” Data Mining and Knowledge Discovery, vol. 34, no. 6, pp. 1936–1962, 2020, doi:
10.1007/s10618-020-00710-y. - A. Dempster, F. Petitjean, and G. I. Webb, “ROCKET: exceptionally fast and accurate time series classification using random convolutional kernels,” Data Mining and Knowledge Discovery, vol. 34, no. 5, pp. 1454–1495, 2020, doi:
10.1007/s10618-020-00701-z. - L. Al Shalabi, Z. Shaaban, and B. Kasasbeh, “Data mining: a preprocessing engine,” Journal of Computer Science, vol. 2, no. 9, pp. 735–739, 2006, doi:
10.3844/jcssp.2006.735.739.
No related articles were found.