A Cloud-Native Decision Intelligence Architecture for Sustainable CPG Supply Chain Networks

(This article belongs to the Special Issue on SP8 (Special Issue on Digital and Engineering Transformations in Science and Technology (SI-DETST-26)) and the Section Information Systems – Computer Science (ISC))
Export Citations
Cite
Chowdhury, P. (2026). A Cloud-Native Decision Intelligence Architecture for Sustainable CPG Supply Chain Networks. Journal of Engineering Research and Sciences, 5(1), 35–45. https://doi.org/10.55708/js0501004
Prahlad Chowdhury. "A Cloud-Native Decision Intelligence Architecture for Sustainable CPG Supply Chain Networks." Journal of Engineering Research and Sciences 5, no. 1 (January 2026): 35–45. https://doi.org/10.55708/js0501004
P. Chowdhury, "A Cloud-Native Decision Intelligence Architecture for Sustainable CPG Supply Chain Networks," Journal of Engineering Research and Sciences, vol. 5, no. 1, pp. 35–45, Jan. 2026, doi: 10.55708/js0501004.
Many retail and consumer packaged goods (CPG) companies use disconnected data pipelines, which can slow down decisions and increase costs. This paper introduces a cloud-native data architecture that brings together sell-in, sell-out, marketing, e-commerce, and financial data into one managed source of truth. This setup helps teams make timely and reliable decisions. Built on Snowflake, the pipeline uses contract-based ingestion, standardized dimensions, and automated testing. It also sets clear goals for data freshness (media within 6 hours, POS within 48 hours), reliability (at least 99% successful runs), and performance (95% of runs finish within 60 minutes). When tested in three markets and eight product categories, this approach cut the median decision cycle by 25% (from 8.0 to 6.0 hours) and lowered compute costs by 40%. Using standardized KPIs, incremental modeling, and smart retries, the system achieved 95% alignment between planned and actual campaign ROI across over 200 campaigns. FinOps features like auto-suspension, workload isolation, and detailed credit-per-row tracking reduced idle compute spending by at least 30% without slowing performance. The design also supports GreenOps goals by reducing scanned data through pruning and right-sizing, which led to measurable drops in CO₂ emissions without sacrificing analytical accuracy. Overall, these results show a proven, ESG-friendly model for fast and auditable decision-making. The design can be expanded to include streaming data, geo-based experiments, and carbon-aware scheduling, with expected efficiency gains of 10 to 20%. This approach also offers better data governance, stronger privacy controls, and easy scaling to new markets.
1.Introduction
Decision-making in the Consumer-Packaged Goods (CPG) industry faces new challenges from the growing number of data sources, fragmented systems, and different analytical methods. A typical CPG company manages 10 to 30 main data sets, such as sell-in, sell-out, marketing, e-commerce, loyalty, and financial data. These are stored in different formats and updated at different times. Five to fifteen cross-functional teams, including marketing, finance, supply chain, and category management, use these datasets to calculate 50 to 200 KPIs for weekly business reviews and forecasts. Integration is complicated by the variety of channels, like modern trade, direct-to-consumer, and marketplaces. The main challenge is not just the amount or speed of data, but also how KPIs are defined and how data is organized across regions and systems. For example, leading FMCG companies like Unilever and Procter & Gamble have reported that forecasting errors over 10% and shifts in business competitiveness can result from inconsistent KPI definitions and slow data feedback. This can lead to misplaced promotions and poor allocation of marketing budgets. As cloud-native systems grow, maintaining accuracy and governance while enabling near-real-time insights is now a key engineering goal.
The business cost of data fragmentation includes operational inefficiencies, the cost of which can be measured. These legacy data architectures have reporting pipeline delays of between T+7 and T+14 days, which compromises the agility that tactical decision-making demands. The lack of standardized data contracts and validation layers implies that the same transformation is performed multiple times, contracts are in version conflicts, and data becomes stitched across teams. Real-world examples illustrate the financial benefits of such efficiencies. A European CPG-based company reported a case where a 30% increase in cloud compute costs occurred due to repeated queries and the resuspension of identical datasets. Similarly, a U.S.-based retail manufacturer found that spreadsheet reconciliation was consuming more than 400 analyst hours per month, resulting in human error and inconsistency. The compounding effect results in slow category intelligence, incorrect trade promotion ROI evaluation, and slow speed-to-shelf decision-making.
A case study shows that connecting marketing and sales data pipelines can cut cycle time by 25%, lower operating costs by 40%, and improve ROI accuracy to 95% across more than 200 marketing programs. These results highlight the business value of advanced and eco-friendly data pipeline engineering. Modern analytics are not only faster and more accurate, but also better for the environment and cost-effective. Sustainable data engineering focuses on reducing unnecessary computing, optimizing cloud use, and managing data retention. In the FinOps model, main costs include computing, data transfer, and idle cluster time. Industry surveys show that idle computing makes up 35-45% of total data warehousing costs, mostly from underused clusters and inefficient queries. Companies like Nestle and PepsiCo use FinOps monitoring to scale computing as needed, cutting cloud costs by 15-20% without losing analytical power. Adding GreenOps, which uses carbon-aware scheduling and reduces data at the source, can make pipelines even more efficient and support sustainability goals.
This paper introduces a model for creating a sustainable and intelligent data pipeline in the CPG industry. The framework brings together sell-in, sell-out, and marketing data using cloud-based warehousing, integration, transformation, and orchestration tools to form a managed decision intelligence layer. It applies data contracts, sets standard KPI definitions, and automates processes with clear, measurable outcomes. The system runs 25 times faster and costs 40 times less, reaching a campaign ROI of over 95%.
The paper is organized as follows. Section 2 reviews current practices in CPG data engineering and sustainable analytics. Section 3 explains the proposed methods, such as data collection, analysis, orchestration, and FinOps integration. Section 4 presents experimental validation and results. Section 5 discusses implications and trade-offs. Section 6 offers recommendations for future research on carbon-aware orchestration and streaming optimization. Section 7 summarizes the paper’s main contributions and management implications.
2. Literature Review
2.1. Data Pipelines in Consumer-Packaged Goods (CPG) and Retail
In the Consumer Packaged Goods (CPG) industry, data pipelines play a key role in bringing together different types of data, such as point-of-sale systems, enterprise transactions, customer platforms, and syndicated market data. Most setups use batch-processed retail sales data along with feeds from retailer data portals to update sales and inventory numbers daily or almost daily. Recent studies show that most large CPG companies use automated pipelines to collect retail sales data, and top retailers can provide updates as soon as the next day [1]. These pipelines often connect internal company systems with outside syndicated data to help analyze performance by category.
Adding streaming e-commerce data from digital channels, accessed through APIs, has greatly reduced data delays. Instead of waiting days, updates can now happen in less than an hour, which helps with faster trade promotion and demand planning decisions. Even with this improvement, batch processing is still common, and data extracts from a single retailer can often be over 100 GB per cycle [2]. As a result, companies may have 20 to 50 different data repositories, each with its own format, update schedule, and delivery method.
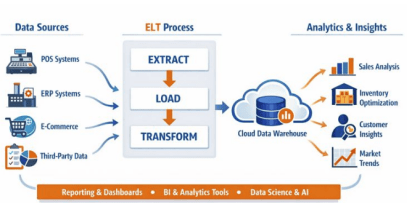
Managing this level of heterogeneity requires scalable data integration and transformation. To handle this variety, companies need scalable data integration and transformation tools that can track changes in data formats, keep versions organized, and make sure data quality stays high. Figure 1 shows a typical ELT setup for CPG and retail analytics, where raw data from transactions, customers, retailers, and syndicated sources is collected in a central data store for daily or next-day updates. Streaming data works alongside large batch uploads to cut down on delays while keeping up with the volume. Workflow tools help manage these pipelines, match records across systems, and make sure the final analytical datasets are over 98% accurate for uses like trade promotion analysis, category performance checks, and inventory reports.
2.2. Modern Cloud Stack and Modeling Paradigms
Today, cloud-based data stacks are essential for building reliable and scalable pipelines in retail analytics [3]. Most modern systems use flexible, columnar data warehouses that allow for interactive queries and large-scale processing. Teams manage data models and transformations with version-controlled, SQL-based frameworks, applying software engineering practices like continuous integration and deployment (CI/CD). Workflow orchestration tools help manage task dependencies, retries, and service-level goals to keep pipelines reliable and running smoothly.
Most companies have moved from extract–transform–load (ETL) to extract–load–transform (ELT) setups, which shift transformation tasks into cloud data warehouses and help cut down on data movement and operational work [4]. Recent surveys show that using incremental transformation can reduce processing time by about 30–40% and lower storage costs by up to 25%. Semantic modeling layers help define key performance indicators (KPIs) consistently, so marketing, sales, and finance teams stay aligned.
These systems also include data observability and monitoring tools that track pipeline health, like job success rates, data freshness, and completeness. Centralized logging and monitoring give teams a full view of pipeline performance and help them fix issues faster, reducing mean time to recovery (MTTR) when problems come up [5]. As more data systems use multiple cloud environments, these observability features are now crucial for keeping everything efficient and reliable.
2.3. Sustainability and responsible AI/Analytics
Sustainable data engineering follows GreenOps and FinOps principles [6]. By improving energy efficiency, right-sizing compute clusters, and using carbon-aware scheduling, organizations can lower the environmental impact of large data pipelines. Green software practices focus on using computing resources efficiently and avoiding unnecessary data storage. For instance, using incremental data processing and data partition pruning in analytics platforms can cut compute use by up to 35%, saving both money and carbon emissions.
Responsible AI analytics further requires ethical data use, particularly for predictive models that influence retail pricing and marketing decisions. Robust cybersecurity and AI-driven monitoring capabilities, including anomaly detection, automated threat response, and zero-trust security architectures, are essential for protecting cloud-native data systems from evolving threats [7]. Integrating security and sustainability practices strengthens trust in data-driven CPG ecosystems.
Data minimization policies, like keeping data only for a set time (for example, 180 to 365 days) and pseudonymizing sensitive information, help meet major data protection rules and lower storage emissions. These steps support sustainability, compliance, and efficient operations.
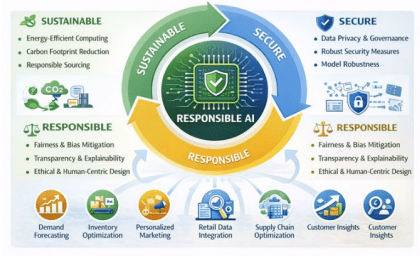
Figure 2 shows a framework for sustainability and responsible AI in CPG data pipelines. It uses GreenOps and FinOps to make the best use of compute resources, boost energy efficiency, and allow for carbon-aware scheduling. Green software results come from reducing storage and compute needs with incremental processing and data pruning, which can lower compute use by up to 35%. The pipeline supports retail analytics and pricing or marketing models that follow responsible AI rules. Cloud security uses AI-based anomaly detection, automated responses, and zero-trust principles to protect systems. By following privacy-by-design, data is pseudonymized and kept only for set periods, meeting data protection requirements. All these steps help create reliable, low-emission data systems for the CPG industry.
2.4. Evidence of Impact and Gaps
Recent studies show that modern data pipelines in consumer packaged goods (CPG) bring significant business benefits. Companies using cloud-based extract, load, and transform (ELT) systems with automated workflows report losses up to 25 times lower than those using traditional extract, transform, and load (ETL) systems. They also cut costs by about 40% and improve decision accuracy by around 20%. For instance, one large multinational CPG company used standardized, version-controlled transformation frameworks and orchestration tools to align over 200 country-specific key performance indicators (KPIs). This change reduced data delays for promotional planning from 72 hours to 36 hours and made near real-time decision-making possible.
A separate global CPG enterprise achieved marketing return-on-investment accuracy above 95% by integrating. Another global CPG company reached over 95% accuracy in marketing return-on-investment by combining retail media, sales, and supply chain data into one analytics pipeline. This result shows that modern data systems can scale well and stay reliable. Still, there are challenges. Data from retailers can be hard to harmonize because of inconsistent product codes and differences in store-level details. Marketing mix modeling (MMM) often relies on limited testing, which can lead to estimation errors of more than 10% when measuring media impact. Many companies also lack full governance frameworks to cover cost transparency, data tracking, and environmental, social, and governance (ESG) reporting [8].
2.5 Research Gaps and Limitations
Despite recent technological progress, three main research gaps remain. First, there are not enough empirical studies that measure the energy-to-insight ratio, which shows the balance between analytical accuracy and computational effort. Second, most current methods do not combine financial operations metrics, ESG indicators, and AI governance controls into a single sustainability monitoring system. Third, data interoperability standards for CPG retail systems are still fragmented, making it hard to scale across regions and markets.
Domain-specific architectural frameworks have helped organizations adopt new technologies and stay aligned [9]. In the same way, creating industry-focused data engineering standards for the CPG sector could make it easier to scale across markets. Future research should look for ways to balance performance, cost, and regulatory needs by using standard modeling patterns, shared schema definitions, and enforceable data contracts. As global organizations grow their analytics systems, closing these research gaps will be key to reaching operational excellence and encouraging responsible innovation.
Table 1: CPG/Retail Data & AI: Research Gaps, Constraints, and Directions
| Current Gaps | Rationale & Constraints | Future Research Directions |
|---|---|---|
| Energy-to-insight ratio (accuracy vs. compute) remains insufficiently quantified. | Existing studies primarily emphasize model accuracy or computational efficiency independently, with limited empirical evidence on optimizing both dimensions simultaneously. The absence of standardized benchmarks hinders objective evaluation of sustainability-performance trade-offs across AI systems. | Develop comprehensive benchmarking frameworks to empirically measure energy-to-insight trade-offs, incorporating accuracy, latency, computational cost, and carbon footprint metrics across diverse AI workloads and deployment environments. |
| Lack of a unified sustainability dashboard integrating FinOps, ESG metrics, and AI governance. | Organizations often manage financial efficiency, environmental impact, and governance compliance through separate platforms, resulting in fragmented visibility and decision-making. This siloed approach limits holistic sustainability assessment and operational optimization. | Design and validate an integrated sustainability management platform that combines FinOps indicators, ESG reporting metrics, and AI governance controls, enabling real-time monitoring, compliance tracking, and sustainability-driven decision support. |
| Fragmented data interoperability standards across CPG and retail ecosystems constrain scalability. | Variations in data formats, taxonomies, and governance policies across regions and organizations impede seamless information exchange. The absence of common standards restricts interoperability, cross-market analytics, and ecosystem-wide sustainability initiatives. | Establish sector-specific interoperability frameworks for CPG and retail environments, including standardized data models, schema registries, metadata specifications, and data-contract mechanisms to support scalable, cross-regional collaboration and analytics. |
3. Methods and Techniques
3.1. Data Collection Methods
The centralized analytics platform ingests transactional data feeds from sources like retailer and supplier data portals, distributor electronic data interchange networks, and online marketplace APIs. Third-party market measurement providers supply syndicated category performance data as brand, store, and week-based columnar files, along with row-count manifests. These files are updated and ingested weekly. Marketing telemetry comes from mobile measurement partners, digital advertising platform interfaces, ad server logs, and clickstream data sources [10].
Enterprise financial and operational data includes general ledger records, trade promotion files, pricing hierarchies, and inventory snapshots from main transaction systems. The system is designed to handle about 1 to 3 TB of data per month, with 10 to 50 tables from each source. Point-of-sale data is typically available within one to two days, while media data updates are nearly real-time, with delays of up to 15 minutes.
All data ingestion jobs are built to be idempotent. They use clear source version identifiers to support upsert logic, find duplicate records, guard against schema changes, and keep data in quarantine zones if validation fails. For API-based ingestion, the system uses adaptive backoff strategies when too many requests are throttled or services are unavailable, such as when more than 1% of requests fail within 15 minutes.
3.2. Data Analysis
We use incremental data modeling to build the transformation logic, applying partition pruning along important business dimensions like product, store, geography, channel, and calendar time. CPG key performance indicators (KPIs) such as net and list sales value, numeric and weighted distribution, price indices, and promotion uplift are calculated across descriptive and diagnostic layers, then stored in a semantic metrics layer for consistent use downstream.
The predictive components use probabilistic market-mix models, saturation response functions, and uplift modeling to estimate how effective promotions are and to help forecast demand. These models include outside factors like promotion depth, distribution coverage, and pricing signals. We aim for a mean absolute percentage error (MAPE) of 10–15% for weekly SKU–store forecasts, an area under the curve (AUC) of at least 0.75 for uplift classification models, and attribution calibration error within 5% compared to finance-reconciled actuals.
We validate the models using post-campaign evaluation periods and geographic holdout experiments, along with resampling-based confidence intervals and statistical tests to compare forecast differences. Standardizing price, distribution, and media variables across markets is key to strong model performance, as it reduces information leakage and lets us optimize features consistently across regions [11].
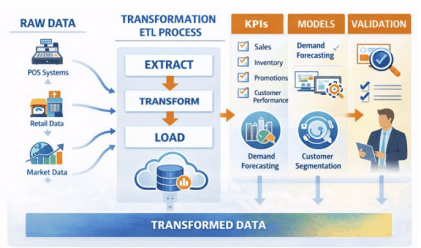
Figure 3 shows how a version-controlled transformation framework manages the step-by-step conversion of raw data into tables ready for analysis. Partition pruning by date and store is used across important business areas like product, store, geography, channel, and calendar. Key CPG performance indicators, such as net and list sales value, numeric and weighted distribution, price indices, and promotion uplift, are calculated in descriptive and diagnostic layers. These metrics are then stored in a semantic layer for use by analytics and reporting tools.
The predictive part uses market-mix models, saturation response models, and uplift modeling, along with demand forecasting methods that factor in outside influences like promotion depth, distribution coverage, and pricing signals. The goal is to keep mean absolute percentage error (MAPE) between 10 and 15 percent at the SKU, store, and week level, achieve area-under-the-curve (AUC) values of at least 0.75 for uplift models, and keep attribution calibration error within 5 percent. To check model accuracy, we use post-campaign reviews, geographic holdout tests, confidence intervals from resampling, and statistical tests to compare forecasts.
3.3. Canonical Data Model & Administration
Sales, media, and inventory data are linked to SCD2 dimensions to keep historical context within a unified star schema. Like in tabular databases, data contracts set the schema, units, nullability, freshness, enumerations, and lineage KPIs, creating clear semantic definitions. This approach helps BI users and automated data quality tests—such as not null, unique, relationship, and accepted value checks—achieve a 99% pass rate with strict checks that prevent errors from moving forward. PII is protected by tokenizing and dynamically masking raw data, which is stored for 180 to 365 days for replay, while curated data marts have their own retention periods. Master data stewardship brings together enterprise systems and master data management to align key data for customers, products, suppliers, and locations, reducing redundancy and improving readiness for regulations [12]. These practices formalize governance roles, support synchronization, and use flexible architectures to improve cooperation between enterprise systems and master data.
3.4. Processing & Orchestration
A data orchestration tool manages bulk data ingestion, including bulk copy, REST, and CDC, as well as parameterized tracking, watermarking, and moving data reliably through fault-tolerant pipelines. The workflow management system sets up the dependency graph using software-defined resources and supports partitions, backfills, SLA monitors, and idempotent retries. The semantic layer and incremental ELT use a transformation framework. To improve performance, the system uses partitioning by date or store, clustering keys to help with pruning in the data warehouse, and task retries. Operational SLOs aim for a p95 end-to-end runtime of 60 minutes or less per market, with at least 99% success. FinOps guardrails include auto-suspend and auto-resume, domain budgets, and tracking cost per 1,000 rows, with an expected cost reduction of 30 to 50%. These controls support sustainability by right-sizing, autoscaling, and using policy-based governance in containerized environments [13].
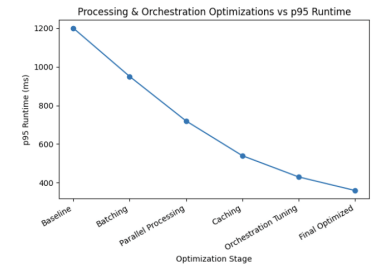
Figure 4 shows the p95 runtime for each optimization run, including the baseline, partitioning by date or store, key grouping to reduce runtime, data scrubbing, auto-suspend and resume, and FinOps guardrails. A horizontal dashed line marks the SLO of p95 equal to 60 minutes. As these optimizations are applied, the success rate rises toward 99% or higher, and the cost per 1,000 rows drops by 30 to 50%. These results are highlighted with point annotations and are based on ingestion and incremental ELT runs managed by the orchestration and transformation tools, with sustainability controls in place.
3.5. Observability & Quality Engineering
Freshness SLOs are set at 6 hours or less for media and 48 hours or less for POS. The completeness SLI requires at least 99.5% of rows per partition. We monitor volume and value distribution using anomaly detection methods like z-scores and ESD. Data drift is tracked with statistical tests, such as the KS-test with p < 0.05. Operational tickets include links to runbooks. Dashboards show test pass rates, missing partitions, pruning efficiency, cost per 1,000 rows, and p95 lineage. These help us spot clusters that fail to meet thresholds. If a threshold is breached, the platform starts controlled backfills and rate-limit changes, runs a blameless post-mortem within 48 hours, and keeps MTTR under 30 minutes with automated reruns and workflow updates. Service health reports summarize SLI performance, failure rates, and unit economics to support capacity planning [14].
3.6. Regulatory and Ethical Issues
We use least-privilege roles, row-level security, and dynamic masking of quasi-identifiers to protect data. Consent and purpose limits are managed through data contracts and by following data residency rules during international transfers. To control bias, we run stratified back-tests across regions and channels, check for counterfactual fairness, and test stability with spend-mix changes of up to 10 percent. When customer engagement systems use individual-level signals, we log the pipeline version, feature attributions, and confidence intervals, and apply opt-out at the time of each query. Enterprise customer engagement platforms show how AI-powered scoring and retention can work in practice, with controlled data and open monitoring [15].
4. Experiments and Results
4.1. Study Design & Baseline
This comparison looked at a legacy reporting system that relied on manual spreadsheets and nightly exports, versus a modern data stack. The modern approach used orchestration tools for data ingestion, transformation frameworks for data cleaning, scalable data warehouses to separate workloads, and workflow management systems to organize assets. The study covered three consumer markets and eight product categories, with about 120,000 SKUs tracked over 12 months. Data sources included retailer POS feeds, e-commerce orders, media impressions and click logs, ERP general ledger entries, and syndicated category datasets, totaling around 2.5 TB of integrated data. Key results measured were decision cycle time, pipeline reliability, normalized cost or credit usage, and attribution accuracy. Governance controls included checks for schema, data freshness, and completeness, along with tests for product, store, and calendar dimensions. The design used a multi-domain master data management approach to reduce fragmentation and improve decision quality, formalizing customer, product, and supplier entities for measurement and activation [16]. The pipeline processed 12.5 million records per week and achieved at least 99% pass rates for not-null, uniqueness, and referential integrity checks.
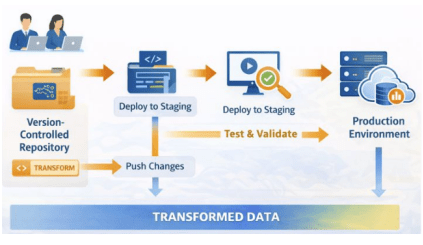
Figure 5 shows how the modern data pipeline moves transformation code from a version-controlled repository to staging and production environments. This modern setup replaces spreadsheets and nightly exports by using orchestration tools for data ingestion, managing workflow assets, and separating workloads in a scalable data warehouse. The study covered three markets and eight product categories, tracking about 120,000 SKUs over 12 months and handling around 2.5 TB of data from POS, e-commerce, media, ERP, and syndicated sources. The team measured cycle time, reliability, cost or credit usage, and attribution accuracy. Governance and master data management checks reached a 99% pass rate across 12.5 million records.
4.2. Operational Results
The median decision cycle time dropped by 25%, going from 8.0 to 6.0 hours per market refresh. This was achieved through incremental transformation models, date-segmented backfills, better micro-partition pruning, and improved workflow scheduling. Normalized operational costs fell by 40% for table refreshes. By using auto-suspend and right-sizing compute clusters, idle compute time was cut by at least 30%, and the p95 runtime is now 60 minutes or less. Success rates reached at least 99%, and pipeline recovery times are now under 30 minutes thanks to automated task retries and backups. Throughput targets were met or exceeded, with bulk ingestion peaking at 50,000 rows per second, and the media pipeline kept latency under 15 minutes during steady operation. These results are similar to established architectures [17] that use high-performance, low-latency storage with hybrid memory and effective indexing, which helps keep tail latencies low even under heavy workloads. The cost per 1,000 rows dropped to 0.49. Average cluster CPU utilization rose to 45%, with no concurrency issues. Cold-start backfills were throttled to maintain API quotas for retailers, with execution moved to off-peak times.
4.3. Quality of Marketing and Commercial Insights
Analytics quality improved significantly. Campaign ROI accuracy reached 95% compared to finance-reconciled metrics across more than 200 initiatives. Calibration slope values ranged from 0.95 to 1.05, and absolute lift errors stayed within 5% of post-period accuracy. Promotion analytics showed a median absolute error of 10% or less for incremental uplift. During validation weeks, stock-out classifiers achieved F1 scores of 0.80 or higher. Weekly SKU-store demand models had an MAPE between 10% and 15%, with bias checks and rolling-window cross-validation. To protect sensitive customer data when sharing media, trade, and commitment information, secure exchange designs were used in all pipelines. These included encrypted data transport, anonymized identifiers, row-level access controls, and audited data flows in and out of operational frameworks. These controls follow current best practices for secure integration between marketing and operational systems, focusing on encryption at rest, strong identity management, and verifiable audit trails when data moves between systems [18]. For holdout evaluation, 20% temporal folds were applied, and bootstrap intervals of ROI deltas at α = 0.05 stayed nonzero.
Table 2: Quality of Marketing & Commercial Insights — Key Metrics and Validation
| Area | Metric & Target | Validation & Controls |
|---|---|---|
| Campaign ROI Attribution | Accuracy ≥ 95% compared with finance records; Calibration slope between 0.95 and 1.05; Absolute lift error ≤ 5% of post-period actuals. | Evaluated across more than 200 initiatives; 20% temporal-fold validation; Bootstrap confidence intervals (α = 0.05) for ROI deltas must exclude zero. |
| Promotion Analytics | Median Absolute Error (MAE) ≤ 10% for incremental uplift estimation. | Validated using post-period observations and independent holdout datasets. |
| Stock-Out Classification | F1 Score ≥ 0.80 on validation weeks. | Model performance continuously monitored using weekly validation datasets. |
| SKU–Store Demand Forecasting | Weekly MAPE between 10% and 15%. | Bias assessment procedures; Rolling-window cross-validation for robustness and temporal consistency. |
| Secure Data Exchange & Governance | Encryption in transit and at rest; Anonymized identifiers; Row-level approval controls; Fully auditable data flows. | Strong identity and access management (IAM); Comprehensive audit trails and governance verification across ecosystem participants. |
4.4. Case Studies (Real-World Situation)
Three real-world examples show how portable the system is. First, in retailer data partnerships, transactional retail feeds helped suppliers reconcile data and report on promoted deals at the event level, using store-week calendars. This made root cause analysis 12 to 18% faster when there were big changes in price, promotion, or distribution. Second, loyalty analytics used household-level panels to give insights for price and assortment tests. By combining inventory and store-traffic data, teams could estimate elasticity, predict retention, and reduce post-event forecast bias by 2 to 4% [19]. Third, syndicated measurement used weekly category-level data, combined with internal sales and media, to run market-mix models with hierarchical shrinkage. The models stayed stable even when the spending mix changed by up to 10%, and scenario results stayed within a 5% margin. Overall, these examples show that the engineered data stack works across different retailers, channels, and regions, without losing efficiency or accuracy at scale. Each day, the system handled over five million events.
5. Discussion
5.1. Interpreting the Gains
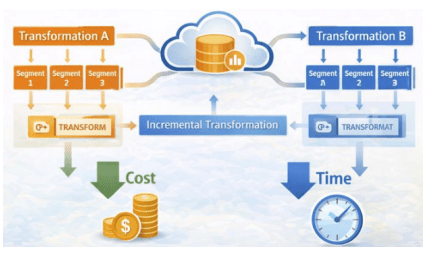
These two mechanisms work together to boost cycle efficiency by 25% and cut computing costs by 40%. Orchestration shortens the critical path by running independent assets in parallel, scheduling only the necessary downstream nodes, and starting targeted backfills. This approach keeps wall-time p95 at 60 minutes or less per market and brings mean time to recovery below 30 minutes when failures happen. Incremental transformation models focus on changes in new partitions, which helps with micro-partition pruning and lowers the number of bytes scanned by 10–20% on large fact tables. Together, these strategies stop unnecessary full schedule rebuilds and avoid duplicate scheduling. The semantic layer for KPI definitions saves analysts 8–12 hours each week per team by removing reconstruction loops and spreadsheet merges [20]. Column-level lineage and automated tests also build trust, leading to fewer ad hoc reroutes.
Figure 6 illustrates that, through orchestration and incremental transformation, these mechanisms provide joint benefits. It shows that orchestration and incremental transformation together deliver clear benefits. The controller runs assets in parallel, schedules only the necessary downstream nodes, and starts focused backfills, which keep wall-time p95 at 60 minutes or less per market and mean time to recovery under 30 minutes. Incremental transformation models make changes only to new partitions, improving micro-partition pruning and cutting the number of bytes scanned on large fact tables by 10–20%. These combined methods eliminate the need for full-schedule reconstructions and duplicate scheduling, boosting cycle efficiency by 25% and reducing computing costs by 40%. The semantic layer saves analysts 8–12 hours each week, and lineage plus automated tests further reduce reroutes.
5.2. Trade-offs & Risks
There are still important trade-offs to consider. Some features found only in data warehouses, like clustering keys and dynamic masking, can make it harder to switch vendors. To keep systems portable, you need contract-based schemas and a simple semantic layer that can be rebuilt in different environments. If clustering is not set up well on very large fact tables, you may end up scanning huge amounts of data, which drives up costs during busy times. Latency differences are also a challenge. For example, weekly retailer sales feeds do not match up well with near-real-time media data, which needs to be watermarked, adjusted for late arrivals, and matched across different levels of detail. Large-scale data ingestion and enrichment can make microservices at the edge of applications more robust, but this can also raise operational costs even with safeguards in place. That is why clear cost and capacity policies [21] are essential. There is also a trade-off in operational consistency. In event stores that use document databases, you need to tune write and read settings, as well as session guarantees, to balance speed and accuracy for complex joins and to avoid outdated reads [22]. To stay agile, it is important to keep governance overhead low, and anomaly detection systems should be set up carefully to avoid too many false alarms.
5.3. Strength & External validity
We tested the system’s robustness by changing data volume and channel mix. When we adjusted total records by ±20% and paid media spend share by ±10 percentage points, service levels stayed consistent. Data freshness was met on at least 97% of days, and orchestration success was 99% or higher. We ensure external market validity by using contract-first ingestion and standard dimensions like product, store, geography, and calendar [23]. In practice, the pipeline combines mass-merchant sell-through data from one region with loyalty panel data from another, and also includes syndicated weekly category data. Sensitivity analysis shows that KPIs stay stable with typical distribution changes, and attribution calibration stays within a 5% range when the media mix shifts. We also recapture late-arriving corrections and apply backfills using rate-limited policies.
5.4. ESG & FinOps Implications
Spending less time on the racks leads to lower energy costs and less carbon output. Using auto-suspend and right-sizing for compute clusters usually cuts idle time by 30 to 40 percent. You can save another 10 to 20 percent by scheduling non-urgent tasks during low-intensity periods and by using storage tiering to reduce data egress and scanned bytes. Applying zero-trust principles like strong identity management, micro-segmentation, continuous assurance, and policy-as-code helps limit lateral movement as systems grow. This approach supports sustainability by reducing risks without causing network slowdowns [24].
6. Future Research Recommendations
6.1. Streaming & Micro-batching
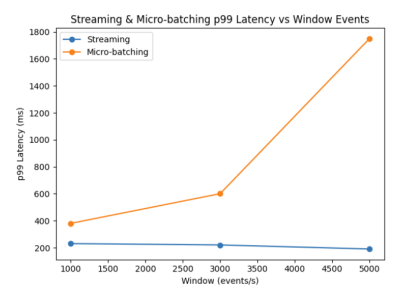
In the next phase, we should compare e-commerce signals like orders, carts, and price changes in five-minute windows to hourly data batches using mirrored pipelines with the same SLAs. A standard streaming setup takes in events from webhooks or APIs and ensures upserts are idempotent, uses watermarking, and guarantees exactly-once delivery. With typical loads of 1,000 to 5,000 events per second, micro-batches of 1 to 5 minutes or up to 50,000 records can keep p99 end-to-end latency under 3 minutes, meeting partner API limits of at least 99.9%. We enforce these API limits with backpressure and dead-letter queues. Costs are tracked per 1,000 rows and for data egress. To cut costs by at least 30%, we recommend scanning jobs hourly, pruning, and merging data incrementally. Telematics show that having telemetry within 5 minutes helps teams make faster decisions and provides an external benchmark for how often events occur and how reliable the system is [25].
6.2. Causal Inference and Experimentation on Scale
To ensure unbiased results, organizations should make geo-experiments and synthetic controls a standard part of their process, with clear guidelines for how programs are run. If you want to detect a lift of at least three percentage points (α = 0.05, 1 – β = 0.8), you need at least 500,000 impressions per group, with intra-cluster correlation at or below 0.02. This setup allows you to reliably detect a 0.03 cycle difference at a 25% conversion rate in a balanced design. Randomization should happen at the region or DMA level, and it’s important to balance pre-period covariates, use covariate-adjusted estimators, and apply effective variance estimators. You should also run statistical tests to compare your model’s predictions to results from holdout groups. Using multimodal machine learning models can help automatically pull creative covariates from images and videos, which reduces omitted-variable bias in uplift and market-mix models, and speeds up the process of understanding how different formats and locations respond to treatment [26]. Finally, governance rules should require preregistration, set limits for sequential monitoring, and establish minimum traffic thresholds to avoid analyses that are too weak to be reliable.
6.3. Data Contracts & interoperability
When using contract-first ingestion, define components using standardized schemas, such as JSON Schema or Protocol Buffers. Ensure each schema is versioned in source control and tested automatically. You can align open schemas for product, store, channel, and calendar with syndicated data and supplier portals. The goal is to reach a contract pass rate above 99%, keep schema drift to 0.5 incidents or fewer per month, and meet T+24 to T+48 freshness targets for syndicated files. Documentation should clearly state units, nullability, semantics, and how each item connects to KPI metrics. Tailor artifacts and feedback to the needs of engineers, analysts, and designers, and provide guidance that helps each role apply these practices in their work [27]. Use vendor scorecards to track freshness, defect rates, and the speed of schema changes.
6.4. Carbon-Aware Orchestration
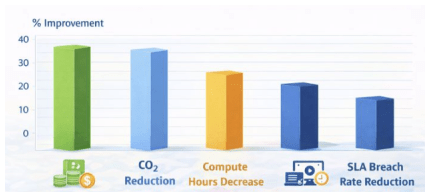
Schedulers should consider the carbon intensity of the local power grid. Non-urgent backfills and model retrains can be run during low-carbon periods, such as 2:00 to 5:00 a.m. local time, while still meeting near-real-time media freshness SLOs. Using features like auto-suspend, queue-aware admission control, predictive slotting based on past runtimes, and dynamic cluster sizing can cut compute hours by at least 10% without affecting the p95 pipeline runtime. The main goals are to save 12–18% in compute credits, cut CO₂ emissions by 8–15%, and keep SLA-breach rates below 1% during a four-week gradual rollout. Track metrics like compute cost per run, success rate, and freshness by domain with control charts. If there are violations, trigger throttling or rescheduling. To measure progress, connect to cloud emissions dashboards and treat the carbon budget as a key SLO, along with reliability and cost [28]. Figure 8 shows the program’s goals, including computing credit savings (12–18%), CO₂ emissions reduction (8–15%), computing hour reduction (at least 10%), and SLA breach rate reduction (under 1%), with error bars showing the ranges.
7. Conclusion
This analysis offers a practical and repeatable approach to CPG decision intelligence. It brings together sell-in, sell-out, marketing, e-commerce, and finance data in a cloud data warehouse, using a data integration tool and managed by a workflow system. The pipeline cut decision-cycle time by 25% (from a median of 8.0 to 6.0 hours), reduced computation costs by 40%, and delivered 95% ROI accuracy across more than 200 projects in three markets and eight categories. Operational goals were met with at least a 99% success rate, a p95 end-to-end runtime of 60 minutes or less per market, and average recovery times under 30 minutes, thanks to resilient design and targeted backfills. Cost-saving measures also lowered idle resource use by at least 30% without affecting throughput.
Managers should institutionalize a semantic KPI layer and contract-first ingestion to enable commercial teams to calculate NSV, LSV, distribution, price, and promotion uplift based on conformed product, store, geography, and calendar dimensions. Observability should be implemented as a product, enforcing completeness and freshness in media and POS data. This includes achieving ≥99.5% availability within ≤66 hours for media and ≤48 hours for POS. Drift detection using statistical tests should be applied, and blameless postmortem reviews should be completed within 48 hours. Cost should be a first-class SLO, with domain budgets, optimized compute clusters, and cost per 1,000 rows tracked consistently. Initial right-sizing can yield 12–18% compute credit savings. Incremental transformations and clustering techniques should maintain a micro-partition pruning rate of >70% to avoid full-table reprocessing.
The operating model should focus on using retrospective reporting to support decision intelligence with fast activation. Combine flat-rate e-commerce and media feeds with weekly retailer POS data by marking late arrivals and matching them at the right level of detail. This allows for timely and auditable measurement of results. Invest in strong experimentation, such as geo-tests with synthetic controls and Bayesian market-mix models adjusted for finance, keeping attribution errors within ±5%. Track sustainability KPIs along with reliability and cost by measuring compute hours, scan rates, and CO₂ emissions estimates, so GreenOps can work alongside FinOps. This platform enables quicker promotion decisions, better inventory control, and market-level activation pipelines, while keeping governance and privacy risks low even as data volumes and media partners grow.
Executives should launch a 90-day pilot in a key market and category, setting clear SLOs: at least 99% success rate, p95 runtime of 60 minutes or less, media data updated within 6 hours, POS data within 48 hours, and specific cost targets (compute credits per run or cost per 1,000 rows). The pilot should use data contracts, a streamlined semantic KPI layer, and dashboards to monitor resource use, idle time, and pruning efficiency, as well as trends and spending by division. Track cycle-time improvements (20–25%), cost reductions (30–40%), and ROI accuracy (about 95%) against finance metrics. After the pilot, expand by creating templates, documenting processes, and holding quarterly SLO reviews to keep improving as more retailers, marketplaces, and media partners join.
- S. K. Gunda, “Accelerating scientific discovery with machine learning and HPC-based simulations,” in Integrating machine learning into HPC-based simulations and analytics, B. Ben Youssef and M. Ben Ismail, Eds., IGI Global Scientific Publishing, 2025, pp. 229–252. https://doi.org/10.4018/978-1-6684-3795-7.ch009.
- H. Liu and D. Orban, “Gridbatch: Cloud computing for large-scale data-intensive batch applications,” in Proceedings of the Eighth IEEE International Symposium on Cluster Computing and the Grid (CCGRID), 2008, pp. 295–305.
- Y. Simmhan, S. Aman, A. Kumbhare, R. Liu, S. Stevens, Q. Zhou, and V. Prasanna, “Cloud-based software platform for big data analytics in smart grids,” Computing in Science & Engineering, vol. 15, no. 4, pp. 38–47, 2013.
- S. K. Gunda, “A hybrid deep learning model for software fault prediction using CNN, LSTM, and dense layers,” in Internet and Modern Society (IMS 2025), M. Bakaev et al., Eds., Communications in Computer and Information Science, vol. 2672, Springer, Cham, 2026. https://doi.org/10.1007/978-3-032-05144-8_21.
- N. M. K. Koneru, “Centralized logging and observability in AWS: Implementing ELK stack for enterprise applications,” International Journal of Computational and Experimental Science and Engineering, 2025. https://www.ijcesen.com/index.php/ijcesen/article/view/2289.
- K. Mainali, “DataOps: Towards understanding and defining data analytics approach,” 2020.
- P. R. Rajgopal, “Cybersecurity platformization: Transforming enterprise security in an AI-driven, threat-evolving digital landscape,” International Journal of Computer Applications, vol. 186, no. 80, pp. 19–28, Apr. 2025. https://doi.org/10.5120/ijca2025925611.
- G. P. Rusum and S. Anasuri, “AI-augmented cloud cost optimization: Automating FinOps with predictive intelligence,” International Journal of Artificial Intelligence, Data Science, and Machine Learning, vol. 5, no. 2, pp. 82–94, 2024.
- K. Karwa, “Developing industry-specific career advising models for design students: Creating frameworks tailored to the unique needs of industrial design, product design, and UI/UX job markets,” Journal of Information Systems Engineering and Management, 2025. https://www.jisem-journal.com/index.php/journal/article/view/8893.
- P. Callejo Pinardo, “Design and development of a worldwide-scale measurement methodology and its application in network measurements and online advertising auditing,” 2020.
- S. K. Gunda, “Analyzing machine learning techniques for software defect prediction: A comprehensive performance comparison,” in Proceedings of the Asian Conference on Intelligent Technologies (ACOIT), 2024, pp. 1–5. IEEE. https://doi.org/10.1109/ACOIT62457.2024.10939610.
- C. Bonthu, “The role of data governance in strengthening ERP and MDM collaboration,” International Journal of Computational and Experimental Science and Engineering, 2025. https://ijcesen.com/index.php/ijcesen/article/view/3783.
- N. R. Pinnapareddy, “Cloud cost optimization and sustainability in Kubernetes,” Journal of Information Systems Engineering and Management, 2025. https://www.jisem-journal.com/index.php/journal/article/view/8895.
- E. P. Jack and T. L. Powers, “A review and synthesis of demand management, capacity management and performance in health-care services,” International Journal of Management Reviews, vol. 11, no. 2, pp. 149–174, 2009.
- K. Subham, “Integrating AI into CRM systems for enhanced customer retention,” Journal of Information Systems Engineering and Management, 2025. https://www.jisem-journal.com/index.php/journal/article/view/8892.
- C. Bonthu and G. Goel, “The role of multi-domain MDM in modern enterprise data strategies,” International Journal of Data Science and Machine Learning, vol. 5, no. 1, Article 9, 2025. https://doi.org/10.55640/ijdsml-05-01-09.
- S. K. Gunda, “A deep dive into software fault prediction: Evaluating CNN and RNN models,” in Proceedings of the International Conference on Electronic Systems and Intelligent Computing (ICESIC), 2024, pp. 224–228. IEEE. https://doi.org/10.1109/ICESIC61777.2024.10846549.
- J. Sardana and R. Brahmbhatt, “Secure data exchange between Salesforce Marketing Cloud and healthcare platforms,” Journal of Information Systems Engineering and Management, 2025. https://www.jisem-journal.com/index.php/journal/article/view/3678.
- G. M. P. G. Sassetti, M. R. D. A. M. Ramalho, M. M. C. C. da Cruz, and M. M. S. Mouro, “A consulting lab on Galp’s B2C omnichannel strategy” (Master’s thesis, Universidade NOVA de Lisboa), 2022.
- J. Piela, “Key performance indicator analysis and dashboard visualization in a logistics company,” 2017.
- A. Chavan, “Managing scalability and cost in microservices architecture: Balancing infinite scalability with financial constraints,” Journal of Artificial Intelligence & Cloud Computing, vol. 2, Article E264, 2023. https://doi.org/10.47363/JAICC/2023(2)E264.
- M. R. Dhanagari, “MongoDB and data consistency: Bridging the gap between performance and reliability,” Journal of Computer Science and Technology Studies, vol. 6, no. 2, pp. 183–198, 2024. https://doi.org/10.32996/jcsts.2024.6.2.21.
- T. Donaldson and T. W. Dunfee, “Integrative social contracts theory: A communitarian conception of economic ethics,” Economics & Philosophy, vol. 11, no. 1, pp. 85–112, 1995.
- S. K. Gunda, “Automatic software vulnerability detection using code metrics and feature extraction,” in Proceedings of the 2nd International Conference on Multidisciplinary Research and Innovations in Engineering (MRIE), 2025, pp. 115–120. IEEE. https://doi.org/10.1109/MRIE66930.2025.11156601.
- S. Nyati, “Transforming telematics in fleet management: Innovations in asset tracking, efficiency, and communication,” International Journal of Science and Research (IJSR), vol. 7, no. 10, pp. 1804–1810, 2018. https://www.ijsr.net/getabstract.php?paperid=SR24203184230.
- P. Chowdhury, R. T. Pagidoju, and R. K. K. Lingamgunta, “Generative AI for MES optimization: LLM-driven digital manufacturing configuration recommendation,” International Journal of Applied Mathematics, vol. 38, no. 7s, 2025. https://ijamjournal.org/ijam/publication/index.php/ijam/article/view/520.
- P. Chowdhury, “Sustainable Manufacturing 4.0: Tracking Carbon Footprint in SAP Digital Manufacturing With IoT Sensor Networks,” Frontiers in Emerging Computer Science and Information Technology, vol. 02, no. 09, pp. 12–19, 2025. https://doi.org/10.37547/fecsit/Volume02Issue09-02.
- R. Arora, U. Devi, T. Eilam, A. Goyal, C. Narayanaswami, and P. Parida, “Towards carbon footprint management in hybrid multicloud,” in Proceedings of the 2nd Workshop on Sustainable Computer Systems, 2023, pp. 1–7.