
Beyond Written Surveys: Validating Voice-Based Implementations of the User Experience Questionnaire

(This article belongs to the Special Issue on Special Issue on Digital and Engineering Transformations in Science and Technology (SI-DETST-26) and the Section Information Systems – Computer Science (ISC))
Export Citations
Cite
Diaz-Oreiro, I. and Lopez, G. (2026). Beyond Written Surveys: Validating Voice-Based Implementations of the User Experience Questionnaire. Journal of Engineering Research and Sciences, 5(6), 15–26. https://doi.org/10.55708/js0506002
Ignacio Diaz-Oreiro and Gustavo Lopez. "Beyond Written Surveys: Validating Voice-Based Implementations of the User Experience Questionnaire." Journal of Engineering Research and Sciences 5, no. 6 (June 2026): 15–26. https://doi.org/10.55708/js0506002
I. Diaz-Oreiro and G. Lopez, "Beyond Written Surveys: Validating Voice-Based Implementations of the User Experience Questionnaire," Journal of Engineering Research and Sciences, vol. 5, no. 6, pp. 15–26, Jun. 2026, doi: 10.55708/js0506002.
User Experience (UX) evaluation is fundamental for digital product improvement, yet traditional written questionnaires face limitations in engagement, accessibility, and response consistency. To address this, we present the design, development, and validation of voice-based adaptations of the User Experience Questionnaire, or UEQ, using natural conversational interfaces. This research introduces two distinct implementations: direct scale mapping approach called Voice1-7, and a novel branched-dialog approach called Voice2Q, which uses sequential questions to capture attitude direction and intensity. Further,we propose Voice2Q+VC, a voice-first variant with minimal visual cues to enhance clarity while preserving voice interaction primacy. Multi-stage validation was conducted through multiple case studies involving 345 participants in the design and evaluation phases. These studies compared voice implementations against the standard written version of UEQ. Statistical analyses across diverse participant groups confirmed that both Voice2Q and Voice1-7 produced similar results to the written UEQ in core UX dimensions —Attractiveness, Perspicuity, Efficiency, Dependability, Stimulation, Novelty—establishing their measurement validity. A Usability, UX and cognitive workload comparison was conducted. Results revealed thatVoice2Q significantly reduced response inconsistencies and excelled in UX hedonic stimulation, while the written UEQ retained advantages in UX pragmatic efficiency. Voice2Q+VC mitigated workload challenges inherent in voice-only interactions, outperforming the written UEQ in Usability and UX hedonic dimensions while approaching its UX pragmatic performance levels. These results suggest that supplemental visuals can optimize voice-driven evaluation without sacrificing conversational engagement. This work confirms voice-based UEQ as a statistically valid, accessible alternative to written formats, with benefits in response reliability and user engagement. The Voice2Q+VC implementation presents a promising paradigm for balancing natural interaction with cognitive efficiency in UX evaluation.
1. Introduction
User Experience (UX) is critical for the success of digital products and services. To enhance UX and user satisfaction, it is essential to understand how users perceive and interact with products. One of the most common ways to evaluate UX are standardized questionnaires. However, filling out a written questionnaire can be tedious and prone to inconsistencies, affecting the quality and reliability of collected data [1].
Voice based interfaces could provide more natural and intuitive interaction, which could also take advantage of the widespread availability of smartphones and smart speakers. The voice approach offers several benefits and its positive effects have been already described, including increased accessibility for users with disabilities or low literacy, reduced inconsistencies for better response rates, and natural and conversational interactions, providing more accurate and meaningful feedback from users [2, 3].
This paper describes the development and implementation of a voice based version of the User Experience Questionnaire (UEQ) [4] to allow users to complete the questionnaire through voice based interfaces. UEQ is one of the most recognized User Experience evaluation questionnaires[5] and surpasses AttrakDiff [6], the other widely used questionnaire, in number of applications reported in academic studies [7].
This research also assesses the validity and reliability of the voice-based UEQ compared to the traditional written version and presents an evaluation of the voice based UEQ in terms of UX, Usability and workload.
The rest of the paper is structured as follows: Section 2 describes User Experience evaluation and conversational voice interfaces as background for this research. Section 3 describes the related work including the evaluation of voice interactions, how chatbots have been used in UX evaluation, the comparison of interaction modalities, and the use of semantic differential scales. Section 4 identifies the research gap and presents the motivation for this work. After that, Section 5 describes the process followed to implement our solution and Section 6 discusses the results of its evaluation. Finally, Section 7 presents our conclusions, limitations and future work.
2. Background
This work is based on two fundamental areas: UX evalu-ation using standardized questionnaires and conversational voice interfaces.
2.1. User Experience evaluation questionnaires
The term User Experience was first used by Norman in the 1990s [8] to broaden the overly narrow scope of Usability and cover all aspects of a person’s experience with a system [5].
There have been efforts to create a unified definition [9, 10, 11], but this is still an open topic with no consensus reached. The International Standards Organization (ISO) proposes a definition adopted in this work. According to ISO, UX encompasses a person’s perceptions and responses that result from the use and/or anticipated use of a product, system or service. This includes emotions, beliefs and responses, both physical and psychological, as well as the brand image, presentation, system performance, previous experiences, attitudes, skills and personality [12].
User Experience (UX) is a key element in determining the quality of a product or service [13, 14, 15]. The goal of evaluating the UX of a product or service is to improve the user interaction [16].
An important element to consider is which method or instrument to use in UX evaluation [13, 17]. One of the most commonly used are standardized questionnaires, which contain a known and fixed set of questions to collect the end user perception of a product or service, covering both the pragmatic aspects of the interaction (clarity, ease of use or learning, predictable flows, among others) and the hedonic aspects (related to feelings, identification and stimulation) [18].
These standardized questionnaires are inexpensive and easy to administer, their use is widespread and they are considered reliable and valid for measuring UX [16, 19].
The three most recognized standardized questionnaires for UX evaluation are AttrakDiff, UEQ (User Experience Questionnaire) and meCUE (modular evaluation of the Component model of User Experience) [5, 18, 20, 21, 22].
In this research we focus on UEQ, a questionnaire that evaluates six factors: Attractiveness, Perspicuity, Efficiency, Dependability, Stimulation and Novelty [4].
2.2. Conversational voice interfaces
The other fundamental pillar of this work is conversational voice interfaces, in which the UX is captured through natural language, made up of words and expressions [23]. These user interfaces are inspired by conversation between people [24], and they implement different levels of com-plexity [25].
In this work we focus on intelligent assistants, defined as software that allows automating tasks by organizing and maintaining information through oral interaction with the user [26, 27].
Now, although smart assistants have boosted the use and acceptance of voice interfaces, not all voice interactions can be considered as a conversation. A conversation is a distinctive form of natural language use that involves particular methods of taking turns and ordering them in sequences, the persistence of context across turns, and characteristic actions to manage the interaction itself [28]. A voice command that allow a person to search for information on the Internet, or set a reminder in the form of an alarm, could not be considered a conversation.
Natural language processing has provided intelligent assistants with powerful tools to analyze spoken and written fragments of human language. However, it has not provided designers with models for how those fragments of language should be sequenced to create an interaction-like conversation, defined as a complex system of speech exchange [28]. Creating a user interface that approximates this interaction requires modeling human conversation patterns as a reflection of the complexity of the world [29], and incorporating it into computational interfaces would allow people to interact with computers by speaking naturally [30].
Designing natural language voice interfaces requires knowledge of human conversation, with its turn-taking systems, sequence organization, and repair mechanisms. Therefore, researchers in [31] created a conversational framework (NCF for Natural Conversation Framework) that presents a set of patterns that include simplified forms of natural human conversation patterns. These concepts are based particularly on the area of sociology known as Conversation Analysis, developed by sociologists Sacks [32], providing formal patterns of how people naturally speak.
3. Related Work
Related work is classified into the following sections: voice interaction evaluation, chatbots in UX evaluation, interaction modality comparison, and semantic differential scales as branching questions.
3.1. Voice interaction evaluation
Research on the evaluation of conversational systems has adopted multiple methodological approaches. These studies highlight the importance of multidimensional evaluation methodologies and standardized instruments, while also noting the limited attention given to how different dialogue types affect user expectations [33, 34, 35].
Beyond traditional evaluations, conversational inter-faces have also been explored in specific application do-mains such as accessibility and healthcare. Prior work has shown that conversational user interfaces can improve accessibility for users with disabilities [36], while studies comparing voice and written responses report comparable results and support the feasibility of voice-based questionnaires and surveys [37, 38].
Additionally, approaches such as Kansei engineering have explored the measurement of emotional satisfaction in voice based intelligent systems through conversational design parameters, identifying their influence on dimensions such as pleasure and reliability [39].
3.2. Chatbots in UX evaluation
Regarding chatbots, prior research has explored their use in UX evaluation and survey administration. In [40], authors investigated the use of chatbots as assistants for UX evaluators through the Wizard of Oz technique, laying the groundwork for collaborative tools between humans and AI in UX evaluation Studies comparing conversational approaches with traditional web forms report mixed results. While some research found no significant advantages of chatbots over web forms in terms of enjoyment and usefulness [41]. Other studies reported higher response rates, better data quality, and lower straight-lining in chatbot-based surveys [42]. Additionally, conversational questionnaires have shown positive user perceptions in healthcare contexts, where participants preferred chatbot-based assessments despite longer completion times [43].
3.3. Interaction modality comparison
In [44], authors assessed the validity and reliability of data collected through a Google Assistant application using yes/no questions and Likert scales answered either by voice or through screen interaction. Results revealed comparable internal consistency and validity between both mechanisms.
Similarly, in [45], researchers developed a conversational survey tool using a chat-like web interface with traditional written controls such as buttons, sliders, and multiple choice questions. Researchers conclude that users appreciate the conversational form and prefer it over traditional approaches.
Regarding conversational voice interfaces, previous studies in healthcare contexts have explored the feasibility of administering questionnaires through voice interaction. In [37], authors evaluated multiple questionnaires using both voice and written modalities, finding that although oral versions were perceived as more difficult to answer, the results did not vary significantly between modalities. Likewise, [46] compared written questionnaires with voice interfaces using discrete and open responses, reporting higher correlations between written responses and voice interactions based on discrete numerical answers.
3.4. Semantic differential scales as branching questions
Finally, it is also worth mentioning related work to implementing semantic differential scales through two successive questions, also called branching questions, since this technique is part of the voice questionnaire that will be presented in Section 4.
Previous studies on telephone surveys explored present-ing attitude questions in two stages: first identifying the direction of the attitude and then classifying its intensity [47, 48]. This branching approach was proposed to address the difficulty of administering semantic differential scales without visual support. The term branching questions represents that the wording of the follow up question varies depending on the initial response provided.
Research on political preference surveys reported that breaking down the reporting process into two steps improves the speed, ease, reliability, and predictive validity of responses [1]. Similarly, studies comparing traditional one-stage semantic differential scales with two-stage branching formats found that branching questions generated a higher percentage of extreme position responses, suggesting lower central tendency bias [49].
More recently, branching questions have also been stud-ied in telephone surveys to analyze whether dividing a question into several stages reduces unanswered or undefined responses [50]. However, these studies were con-ducted through human-administered telephone interactions, which may affect participants’ responses compared to conversational systems or self reported voice-based questionnaires.
4. Research gap and motivation
UX is commonly evaluated through standardized questionnaires such as UEQ, AttrakDiff, SUS, and NASA-TLX, which are traditionally administered using written interfaces. At the same time, conversational systems and voice interfaces have gained relevance in multiple domains, moti-vating research on conversational questionnaires, chatbots, and voice-based surveys. Previous studies report promis-ing results regarding the feasibility, validity, reliability, and user acceptance of conversational and voice-based data collection mechanisms, particularly in healthcare and accessibility contexts. Additionally, branching questions have been explored as an alternative strategy for administering semantic differential scales without visual support.
However, despite these advances, limited research has focused on implementing standardized UX evaluation instruments through conversational voice interfaces. Existing studies mainly evaluate general surveys, health-related questionnaires, or conversational forms. Little attention has been given to the voice-based implementation of semantic differential UX questionnaires such as UEQ. Therefore, this work proposes and evaluates multiple conversational voice implementations of the User Experience Questionnaire (UEQ), exploring different interaction mechanisms for administering semantic differential scales through voice interfaces.
5. Development Process
This section describes the design and implementation process of the voice-based UEQ versions, including the conversational mechanisms and interaction patterns used.
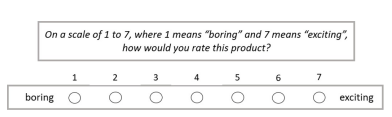
The first effort in mapping the UEQ questionnaire to a voice interface was to design an equivalent version (i.e., the questionnaire gives a 7-point scale, then the voice interfaces mapped this 7-point scale), as shown in figure 1. This implementation, called Voice1-7, is documented and described in [51].
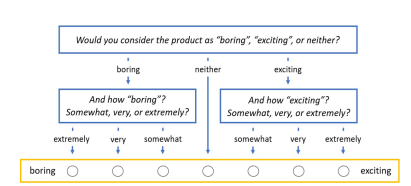
To create an alternative version of the semantic differential, each question was implemented as shown in figure 2.
As can be seen, each item is converted into an initial question in which the direction of the attitude is defined, and a second branching question is unfolded in which the participant specifies the intensity of the attitude. If the participant indicates “neither”, the second question is not asked. Additionally, the participant could respond to both branching questions at once in a single expression. For example, saying “I think this is extremely boring” transmits both direction (boring) and intensity (extremely), applying concepts from Conversation Analysis. We called this implementation Voice2Q.
Also, as part of the design of these two implementations, a Wizard of Oz exercise was conducted to compare user perceptions of both Voice2Q (branching questions) and Voice1-7 (direct 1 to 7 questions). This version only included 10 questions of the UEQ. Afterward, participants assessed the satisfaction and naturalness of both implementations and were then individually interviewed to explore their experience further. Results are discussed in Section 6. Additionally, to explore the UX of Voice2Q, an anticipated UX evaluation was performed using a video storyboard, showing a person’s interaction with the voice-implemented assessment questionnaire. The video also represented conversational elements (e.g., the ability to request a question to be repeated, correct the previous response, and request an explanation of the concepts).
Results are also discussed in Section 6.
Subsequently, and based on the results of the Wizard of Oz exercise and the video storyboard evaluation, complete implementations were developed for both versions, Voice1-7 and Voice2Q, using the items from the official Spanish version of the UEQ [52].
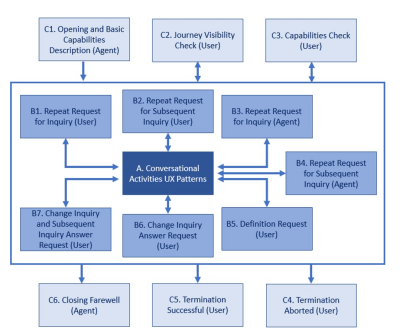
These voice questionnaires were implemented using the Voice Flow tool, and two case studies were conducted. The first case study, documented in [51], compared Voice1-7 with the written version of UEQ. The second case study evaluated the branched implementation (Voice2Q) and the results are shown in the Section 6. It is important to notice that Voice2Q is implemented through a set of conversational patterns shown in figure 3, based on the framework presented by [31].
As can be seen in figure 3, there are three levels in the conversational patterns. Level 1 (conversational activities) covers the implementation of the UEQ semantic differential item converted into the two questions and their variants. Level 2 (sequence management, marked B1 to B7) includes activities such as requesting the meaning of a concept or modifying a given answer. Finally, Level 3 (conversation management, marked C1 to C6) includes start and end-of-process interactions, asking the voice assistant what its skills are or where the participant is in the process of filling out the questionnaire. The full description of these patterns is presented in [53].
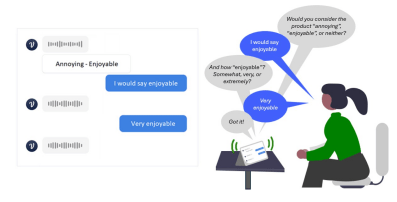
To explore whether visual cues could reduce workload of the voice only implementations of Voice2Q, a new variant was developed: Voice2Q+VC, where the letters “VC” stand for “visual cues”. This new version incorporates minimal visual cues only the concepts of the question, similar to the semantic differential while maintaining voice as the sole input method. As can be seen in figure 4, visual aids display the names of the concepts being evaluated and the participant’s responses, mutating from a voice-only to a voice-first implementation.
The evaluation of the voice implementations was conducted across two dimensions. First, the validity of Voice2Q was assessed by comparing its results with those of the written version of UEQ using a Wilcoxon rank test, and its reliability was measured through Cronbach’s Alpha coefficients. Second, the UX, Usability, and cognitive workload of Voice2Q and Voice2Q+VC were evaluated using three standardized instruments: In [6], the authors measure general UX, SUS [54] to assess Usability, and NASA-TLX [55] to quantify cognitive workload. Full results are presented in Section 6.
6. Evaluation and Discussion
This section presents the evaluation results across the different stages of the research, covering the Wizard of Oz exercise, the anticipated UX evaluation, and the formal validity and UX assessments of the voice implementations.
6.1. Wizard of Oz
As part of the design phase, a Wizard of Oz exercise was conducted with 12 participants (8 females and 4 males, mean age of 29.5 years) to compare Voice2Q and Voice1-7 using 10 items of the UEQ. Afterward, participants assessed the satisfaction and naturalness of both implementations and were individually interviewed. Figure 5 shows the evaluations of the two versions regarding general satisfaction, naturality, and ease of use.
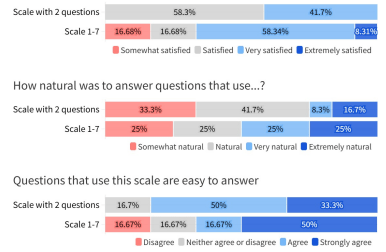
Both implementations received similar ratings, al-though Voice1-7 was identified as simpler and easier to respond to. However, the implementation with two questions stood out among participants who indicated in the follow-up interview that they could give their opinion
more expressively and felt part of a conversation. This trade off between simplicity and expressiveness motivated the continued development of Voice2Q as the primary implementation.
6.2. Anticipated UX Evaluation: Video storyboard
To explore the anticipated UX of Voice2Q, an evaluation was performed using a video storyboard showing a person interacting with the voice-implemented questionnaire. The video also represented conversational elements such as the ability to request a question to be repeated, correct a previous response, and request an explanation of concepts. The storyboard was evaluated by 197 participants using the written UEQ. However, 49 responses were considered invalid due to inconsistencies on three or more scales, leaving 148 valid responses.
Participants ranged in age from 18 to 76 years, with a median of 22 years. Of the 148 valid respondents, 71 (49.3%) identified as female, 73 (48.0%) as male, and 4 (2.7%) as other or preferred not to say. Regarding prior experience with voice technology, 47 participants reported using voice assistants or smart speakers often (31.8%), 64 sometimes (43.2%), and 37 never (25.0%).
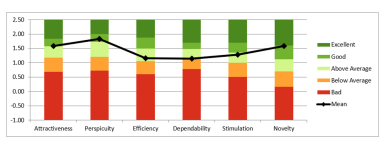
The 148 valid responses for the video storyboard were compared against the UEQ benchmark dataset, which aggregates data from 21,175 participants across 468 studies. As can be seen in figure 6, Voice2Q obtained “Good” ratings for the Attractiveness, Perspicuity, and Novelty, and “Above average” ratings for Efficiency, Dependability and Stimulation. These results provided early evidence supporting the viability of the Voice2Q approach.
In addition to the UEQ evaluation of the video storyboard, an open question was included for participants to freely express their opinion of the voice questionnaire. Of the 66 participants who provided comments, 48 were entirely positive (72.7%), 10 entirely negative (15.2%), and 8 combined both perspectives (12.2%). Positive feedback highlighted that the voice mechanism could benefit users who find reading difficult, that it allows completing a sur-vey while doing other activities, and that it makes surveys feel more engaging and innovative. Negative comments pointed to the interaction feeling tedious or confusing, and to the assistant’s voice in the video could be more humane and pleasant.
6.3. Validity evaluation
Following the Wizard of Oz and the Video storyboard activities, full implementations of Voice1-7 and Voice2Q were developed and evaluated in case studies.
A first case study, documented in [51], compared Voice1-7 with the written version of UEQ. The evaluation of 40 participants showed no significant difference between the two implementations, providing initial validity evidence for the direct scale mapping approach.
A second case study evaluated Voice2Q with 40 Computer Science students, ages ranging from 20 to 33, with a median of 21. Of all participants, 80% were male, 15% female, and 5% indicated other or undisclosed.
These participants evaluated two products, alternating the voice enabled version Voice2Q with the traditional writ-ten version, which we call UEQ-W. A Wilcoxon rank test for independent samples was conducted between UEQ-W and Voice2Q data, finding no significant differences in the responses of the six scales of UEQ. Since no p-value was significant, it was not considered necessary to apply a correction for multiple response variables. The information of the means and variances for each implementation scale can be seen in table 1, as well as the Wilcoxon test p-value, which shows that there is no significant difference between both implementations.
Table 1: Means, Variances, and Wilcoxon rank test for independent samples of UEQ-W and Voice2Q
| UEQ Scale | UEQ-W Mean (Var) | Voice2Q Mean (Var) | Wilcoxon p-value |
|---|---|---|---|
| Attractiveness | 1.38 (1.26) | 1.38 (0.60) | 0.7650 |
| Perspicuity | 1.31 (1.44) | 1.24 (0.69) | 0.5174 |
| Efficiency | 0.84 (1.12) | 0.61 (0.59) | 0.2174 |
| Dependability | 0.81 (1.20) | 0.66 (0.57) | 0.4959 |
| Stimulation | 1.32 (1.68) | 1.04 (0.70) | 0.1088 |
| Novelty | 1.71 (1.39) | 1.59 (0.77) | 0.3241 |
In order to assess the reliability of the Voice2Q instrument per voice, Cronbach’s Alpha coefficients of the six UEQ scales were calculated for Voice2Q, based on the correlations between the items of each scale. It is worth noting that the UEQ questionnaire has 26 questions: 6 questions for the Attractiveness scale, and 4 for the 5 scales: Perspicacity, Efficiency, Dependability, Stimulation, and Novelty. For each of these six scales, UEQ calculates Cronbach’s Alpha Coefficient as a measure of scale consistency.
Table 2: Comparison of the Cronbach’s Alpha coefficients for the Voice2Q version with the test cases presented in the founding paper of UEQ in Spanish
| UEQ Scale | Case 1 UEQ Spanish | Case 2 UEQ Spanish | Voice2Q |
|---|---|---|---|
| Attractiveness | 0.85 | 0.83 | 0.82 |
| Perspicuity | 0.59 | 0.71 | 0.73 |
| Efficiency | 0.74 | 0.72 | 0.63 |
| Dependability | 0.48 | 0.55 | 0.45 |
| Stimulation | 0.75 | 0.78 | 0.77 |
| Novelty | 0.64 | 0.71 | 0.87 |
The values of the Cronbach’s Alpha coefficients for Voice2Q are within the expected ranges, if compared with the coefficients presented by the article that describes the official version of UEQ in Spanish [52], as shown in table 2. In the cited article, two case studies are presented to validate the UEQ translation to Spanish:a first case in which 94 participants evaluated the UX of amazon.com, and a second case in which 95 participants evaluated the Skype Authors affirm that these coefficients are appropriate to demonstrate the reliability of the instrument, indicating that the scales are sufficiently consistent. As can be seen, the coefficients obtained with the Voice2Q instrument are similar.
6.4. UX, Usability, and Workload Evaluation
The Voice2Q instrument was evaluated with three different instruments: AttrakDiff questionnaire [6] to measure general UX, SUS [54] for Usability, and NASA-TLX [55] for the specific workload. This evaluation was carried out with 30 participants (different from the 40 participants of the validity evaluation), Computer Science students, aged between 20 and 34 years, with a mean of 22.23 years, 23 male (76.7%) and 7 female (23.3%). To measure general UX, these 30 participants compared the use of the written questionnaire UEQ-W and the voice questionnaire Voice2Q, using the standardized AttrakDiff questionnaire.
The AttrakDiff questionnaire evaluates four components. Pragmatic Quality (PQ) measures whether a product is predictable, confusing, complicated, among others, Hedonic Stimulation (HQ-S) evaluates feelings associated with the product, such as whether it is perceived as boring, interesting, novel or disappointing. Hedonic Identification (HQ-I) measures the ability of a product to connect us with other people instead of isolating them. And Attractiveness component (ATT) represents the overall value of the product based on the perception of pragmatic and hedonic qualities.
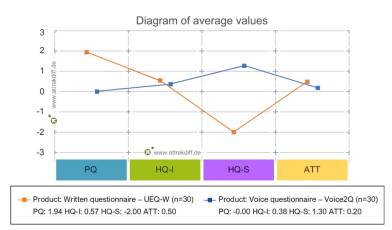
As can be seen in figure 7, UEQ-W showed an advantage in PQ, while Voice2Q received the highest rating in HQ-S. Values for HQ-I and ATT were similar across both implementations.
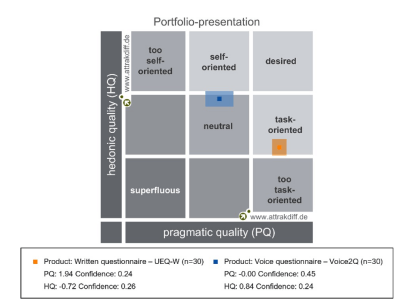
Additionally, AttrakDiff classifies the analyzed prod-ucts in a matrix whose vertical axis depicts the Hedonic quality (considering both Identification and Stimulation) while the horizontal axis represents the Pragmatic quality. Depending on the dimensional values, the product will be in one or more regions. Figure 8 shows that AttrakDiff classifies Voice2Q questionnaire as neutral with a tendency towards the self-oriented region, while the written UEQ-W questionnaire is task-oriented.
Regarding the specific mental workload, the 30 participants filled the NASA-TLX standardized questionnaire [55], composed of six questions presented as 21-point Likert scales, in which meaning is only shown at the two extremes. Based on these questions, NASA-TLX calculates a general value between 0 and 100, which is established as a bench-mark for the workload of the task. Low values correspond to low mental and physical demands, little frustration and success when performing the task.
The overall NASA-TLX score for Voice2Q is 29.7, calculated independently to enable comparisons with other systems that perform similar tasks. For comparison, an evaluation of the written UEQ-W was carried out, with 26 participants (Computer Science students, ages ranging from 19 to 28, with a median of 21 years, 85% male and 15% female) different from the participants of the two previous evaluations. NASA-TLX overall value was 25.3, lower than the 29.7 result for Voice2Q. Additionally, the average time required to complete Voice2Q was 9:44 minutes, while average time to complete UEQ-W was 2:21 minutes.
It is clear that it requires a considerably longer completion time when Voice2Q is used. However, this could be due to the learning curve of using such interfaces. Further-more, the improvement in accessibility and overall User Experience might balance the completion time, especially if it decreases over time.
As for the Usability evaluation, the System Usability Scale (SUS) was used. This questionnaire has ten items in the form of a five-point Likert scale, to which an arithmetic formula is applied to generate a value between 0 and 100
that represents the global value of system Usability. Participants respond by marking one of five values on a scale, in which only the extreme values of Strongly disagree and Strongly agree are presented. Five of these statements are written in positive terms and five in negative terms, to avoid straight-lining (the tendency to mark answers down on-line without reasoning each question individually), which could occur in some participants if all the questions were written with the same polarity.
A Usability evaluation of Voice2Q was carried out with the 30 participants, where the overall SUS result obtained is 69.7, which is in the lower part of the “Good” category, if compared with the interpretation guide for SUS values [54]. As a comparison, in an evaluation conducted with the 26 participants previously mentioned, the written questionnaire UEQ-W obtained an overall SUS rating of 77.2, which is also located in the “Good” category.
Regarding the validity and UX evaluation of Voice2Q, two interesting points to highlight are the inconsistencies that appear in Voice2Q compared to the written version UEQ-W, and the dispersion of UEQ scales mean responses. Inconsistencies are identified at scale level for each participant. The heuristic applied is as follows: responses to items within scale should not differ by more than three points between the highest value and the lowest value of the 7-point scale. If a participant presents inconsistencies in three or more UEQ scales, their answer is considered critical, and UEQ suggests removing it from the evaluation. It can be seen in table 3 that Voice2Q presents significantly fewer inconsistencies than the written version UEQ-W, both at the total level (responses in the six scales for the 40 participants represent 240 possible inconsistencies) and at the level of responses considered critical.
Table 3: Inconsistencies identified in UEQ-W and Voice2Q
| Format | Inconsistencies | Critical Answers |
|---|---|---|
| UEQ-W | 37/240 (15.4%) | 5/40 (12.5%) |
| Voice2Q | 17/240 (7.1%) | 0/40 (0.0%) |
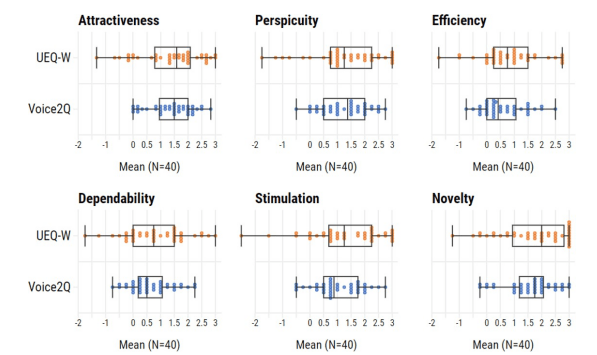
As for the mean responses of the UEQ scales, the Voice2Q means appear with a smaller dispersion than those presented in UEQ-W: the interquartile ranges are smaller and the minimum and maximum values of these averages are not as far apart, as shown in figure 9.
6.5. Evaluation of Voice2Q+VC
To address challenges identified in the voice-only implementation —particularly mental workload and extended completion time— a new variant was developed: Voice2Q+VC. This enhanced version incorporates mini-mal visual cues while maintaining voice as the sole input method, without compromising the voice-first interaction paradigm.
A study with 20 participants evaluated Voice2Q+VC across three dimensions: general UX using the AttrakDiff questionnaire, workload using NASA-TLX, and Usability using SUS.
As can be seen in table 4, workload assessments revealed a NASA-TLX score of 27.2 for Voice2Q+VC, lower than the 29.7 for Voice2Q and approaching the 25.3 score
of UEQ-W. This reduction in workload was particularly notable in mental demand and frustration. Usability, measured by SUS, rated Voice2Q+VC at 78.1, higher than 69.7 for Voice2Q and slightly surpassing UEQ-W’s score of 77.2. Additionally, the time required to complete Voice2Q+VC averaged 6:42 minutes, shorter than Voice2Q’s 9:44 minutes, though still longer than UEQ-W’s 2:21 minutes.
As for the UX evaluation, figure 10 presents the comparison for the four AttrakDiff scales. Results show that in general UX, Voice2Q+VC outperformed the traditional written UEQ-W in Hedonic quality metrics, particularly Hedonic stimulation, while showing slight disadvantage in the Pragmatic quality.
Table 4: Usability, Workload, and completion time for the three imple-mentations of UEQ: written, voice only and voice with visual cues
| Questionnaire Implementation | SUS Score | NASA-TLX Score | Average Completion Time |
|---|---|---|---|
| UEQ-W | 77.2 | 25.3 | 2.21 min |
| Voice-2Q | 69.7 | 29.7 | 9.44 min |
| Voice-2Q+VC | 78.1 | 27.2 | 6:42 min |
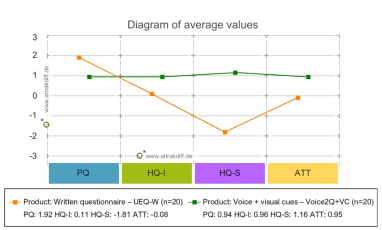
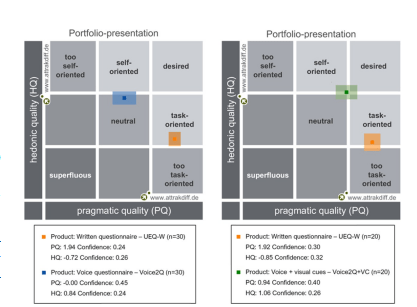
Additionally, figure 11 shows a comparison between the AttrakDiff Portfolio presentation between Voice2Q (in blue) and Voice2Q+VC (in green), where the implementation with visual cues moved closer to the “desired” quadrant, indicating an improvement in overall UX.
These findings suggest that the addition of visual cues in Voice2Q+VC effectively mitigates some challenges of voice-only interfaces while preserving the natural interaction advantages inherent to voice-first systems.
As a final note, table 5 shows the number of participants covered in this study, for design and evaluation phases. Table 5 includes the 40 participants who validated the direct Voice1-7 implementation, work described in detail in [51].
Table 5: Number of research participants, by phase and activity
| Phase | Activity/Implementation | Number of Participants |
|---|---|---|
| Design | Wizard of Oz/Voice2Q | 12 |
| VideoStoryboard/Voice2Q | 197 | |
| Evaluation | Validity/Voice1-7 | 40 |
| Validity/Voice2Q | 40 | |
| UX, Usability/Voice2Q | 30 | |
| UX, Usability/Voice2Q+VC | 26 | |
| Total | 345 | |
7. Conclusions
The results of this research show that a version of the UEQ questionnaire, whose capture mechanism is done by voice, provides results without significant differences from an evaluation of the same product using the traditional written UEQ. In addition, the results are appropriate in terms of the reliability of the questionnaire, comparing Cronbach’s Alpha coefficients with the coefficients presented in the founding paper of UEQ in Spanish [52].
In terms of overall UX, the traditional written UEQ-W outmatches Voice2Q in AttrakDiff Pragmatic quality, while Voice2Q performs significantly better in Stimulation quality. The qualities of identification and attractiveness would be equivalent. Therefore, UEQ-W would be more task-oriented, while Voice2Q would be more self-oriented, in terms of the theoretical model of UX presented in [56]. The version with visual cues (Voice2Q+VC) outperformed writ-ten UEQ-W in both Hedonic quality metrics, stimulation and identification, and also in Attractiveness, while slightly underperforming in the Pragmatic quality. Voice2Q+VC would also perform better in the portfolio-representation of the AttrakDiff evaluation, balancing the self-oriented and task-oriented classifications, almost reaching the desired quadrant.
Regarding the complementary evaluation of Usability using SUS scores, all three questionnaires correspond to the “Good” range of the general interpretation guide of SUS, Voice2Q+VC being the questionnaire with the highest score (78.1), followed by UEQ-W (77.2), and finally Voice2Q (69.7). In terms of specific workload, the traditional written UEQ-W outperforms both voice implementations, although Voice2Q+VC comes close to overall NASA-TLX score for UEQ-W (27.2 versus 25.3). A similar performance is seen in terms of average time to complete the questionnaire, with UEQ-W having the shortest time compared to the two voice implementations.
Although voice implementations require more time for the participant to complete, it is important to mention that the responses show significantly fewer inconsistencies than those obtained with the written UEQ-W questionnaire, and the means of the responses obtained with Voice2Q show smaller dispersion than those obtained with UEQ-W.
In summary, the results obtained with the Voice2Q implementation are promising, in the sense that voice could be used as an alternative method for capturing responses for UX evaluations, with results similar to those obtained with the written version of UEQ and, at the same time, with fewer inconsistencies in participants’ responses.
This research demonstrates that voice-based implementations of UX questionnaires, such as Voice2Q, are valid and reliable alternatives to traditional written formats. The inclusion of conversational patterns and branching questioning ensures accurate and engaging user interactions, reducing inconsistencies and reducing response dispersion. While Voice2Q offers significant advantages in Hedonic qualities like stimulation and identification, its limitations in Pragmatic efficiency highlight opportunities for enhancement.
The development of Voice2Q+VC, incorporating minimal visual cues, addresses some of the Voice2Q (voice-only) limitations by lowering mental workload and reducing the completion time, while maintaining the core benefits of voice implementation. Compared to Voice2Q, the Voice2Q+VC variant moves closer to the ideal balance of pragmatic and hedonic qualities, as evidenced by its improved scores in AttrakDiff, NASA-TLX, and SUS evaluations.
7.1. Limitations
It is important to mention that generalization is not the goal of this research. Due to the sampling of participants and experiments conducted, we acknowledge that this exploration provides initial empirical evidence supporting different ways to collect UX evaluation responses using voice interfaces.
Furthermore, this study did not aim to evaluate the effectiveness of voice interfaces in a broad sense. As such, we recognize that further evaluations considering the role of voice inputs and outputs (e.g., volume, pitch and clarity) could further be considered. While this limitation may affect the experimental experiences of the study, it does not compromise the internal validity or the integrity of our findings.
Finally, even though it could be considered a limitation, the number of people that participated in this study is consistent with the literature. The participation of sample sizes for standardized questionnaires is consistent according to [7] and for NASA TLX according to [57].
7.2. Future work
As future work, several lines of research are identified from this work. Firstly, it is possible to extend the research on voice implementations of UX evaluation questionnaires with the incorporation of other identifiable patterns. For example, variant described in [58] implements the semantic differential as branching questions. In this approach, when a participant selects the central or neutral option, a follow-up question is posed to determine whether there is any slight tendency of the attitude towards one side of the scale. The three central positions of the semantic differential would be represented by the central option and its adjacent positions. If the participant initially selects a di-rection, the follow-up question offers two intensity options, for example very much and extremely, corresponding to the two outer boxes on each side of the scale. This im-plementation, different from the one used in this research work, would emphasize identifying whether the branching questions are prone to a central tendency of the responses.
Another variant to consider is the voice implementation of the official short version of the UEQ [14], which has eight items compared to the usual 26-item questionnaire. These eight items are only presented in three scales: a Pragmatic scale averaging four of the items, a Hedonic scale, with the other four items, and a Global scale with the average of the eight items. The creators of UEQ recommend using this questionnaire only in situations where a full UEQ cannot be administered, mainly due to issues related to the time it takes to complete the questionnaire, since it does not allow for detailed measurement of the six subscales present in the original UEQ. The short version UEQ-S only allows for approximate measurement in higher-level meta-dimensions, which provides less detail than the information provided for the six subscales. This is consistent with what was stated in [59] on the ability of the traditional UEQ to measure the three most important aspects of the UX model proposed in [56]: Pragmatic quality, Hedonic quality, and General attractiveness.
In this same line of work, a version of the complete UEQ could be implemented, but as the user’s responses are collected, it would be calculated whether the values of the scale items are consistent for the scale (i.e., they do not generate inconsistencies). If after collecting, for example, three of the four items of a scale, the responses are strongly related, the fourth item of that scale could be omitted, dynamically reducing the length of the questionnaire.
Another evaluation that could be carried out is a study with participants using the voice implemented questionnaire more than once at different times, so that the impact of familiarity with the instrument, the time to fill out the questionnaire and the specific workload can then be measured. Until now, the evaluations have been cross-sectional, where participants are confronted with the voice questionnaire for the first time, compared to the written version of the questionnaire, which shares many formatting elements with other questionnaires that participants have used before and to which they are already accustomed.
Another line of research would be the identification of conversational patterns that convert to voice other ques-tion formats, for example Likert scales, which are present in standardized questionnaires such as the meCUE, the SUS questionnaire, and the NASA-TLX. A study of this type would help identify the challenges of this transformation and eventually also propose voice variants for these questionnaires.
Finally, it is considered pertinent to explore the adaptation of some of the elements used in the voice implementations of this research work to questionnaires with visual representation, for example through a Web page. For example, branching questions could be used instead of presenting the semantic differentials of the UEQ in their traditional form, so that the direction of the attitude is sep-arated from the intensity of the attitude. These branching questions would appear dynamically as the questionnaire is filled out. In addition, the pattern in which the concepts being asked are explained could also be implemented. The questionnaire could be designed so that, if the participant hovers the mouse pointer over the concepts being asked, a dialog box is displayed with the description of the concept in the context of the UX evaluation, thus helping reduce ambiguities and obtain higher quality responses.
- J. A. Krosnick and M. K. Berent, “Comparisons of party identification and policy preferences: The impact of survey question format,” American Journal of Political Science, pp. 941–964, 1993, doi: 10.2307/2111580.
- E. Cho, M. D. Molina, and J. Wang, “The effects of modality, device, and task differences on perceived human likeness of voice-activated virtual assistants,” Cyberpsychology, Behavior, and Social Networking, vol. 22, no. 8, pp. 515–520, 2019, doi: 10.1089/cyber.2018.0571.
- J. K. Höhne, K. Gavras, and J. Claassen, “Typing or speaking? Comparing text and voice answers to open questions on sensitive topics in smartphone surveys,” Social Science Computer Review, vol. 42, no. 4, pp. 1066–1085, 2024, doi: 10.1177/08944393231160961.
- B. Laugwitz, T. Held, and M. Schrepp, “Construction and evaluation of a user experience questionnaire,” in Symposium of the Austrian HCI and Usability Engineering Group, pp. 63–76, Springer, 2008, doi: 10.1007/978-3-540-89350-9_6.
- C. Lallemand and G. Gronier, Méthodes de Design UX: 30 Méthodes Fondamentales pour Concevoir et Évaluer les Systèmes Interactifs, Éditions Eyrolles, 2015.
- M. Hassenzahl, M. Burmester, and F. Koller, “AttrakDiff: Ein Fragebogen zur Messung Wahrgenommener Hedonischer und Pragmatischer Qualität,” in Mensch & Computer 2003: Interaktion in Bewegung, pp. 187–196, Springer, 2003, doi: 10.1007/978-3-322-80058-9_19.
- I. Díaz-Oreiro, G. López, L. Quesada, and L. A. Guerrero, “UX evaluation with standardized questionnaires in ubiquitous computing and ambient intelligence: A systematic literature review,” Advances in Human-Computer Interaction, vol. 2021, no. 1, p. 5518722, 2021, doi: 10.1155/2021/5518722.
- D. Norman, J. Miller, and A. Henderson, “What you see, some of what’s in the future, and how we go about doing it: HI at Apple Computer,” in Conference Companion on Human Factors in Computing Systems, p. 155, 1995, doi: 10.1145/223355.223477.
- E. Law, V. Roto, A. P. Vermeeren, J. Kort, and M. Hassenzahl, “Towards a shared definition of user experience,” in CHI ’08 Extended Abstracts on Human Factors in Computing Systems, CHI EA ’08, pp. 2395–2398, Association for Computing Machinery, New York, NY, USA, 2008, doi: 10.1145/1358628.1358693.
- V. Roto, E.-C. Law, A. Vermeeren, and J. Hoonhout, User Experience White Paper: Bringing Clarity to the Concept of User Experience, 2011.
- C. Lallemand, G. Gronier, and V. Koenig, “User experience: A concept without consensus? Exploring practitioners’ perspectives through an international survey,” Computers in Human Behavior, vol. 43, pp. 35–48, 2015, doi: 10.1016/j.chb.2014.10.048.
- ISO, “9241-210:2010. Ergonomics of Human-System Interaction—Part 210: Human-Centred Design for Interactive Systems,” International Organization for Standardization, Switzerland, vol. 2, 2009.
- A. P. Vermeeren, E. L.-C. Law, V. Roto, M. Obrist, J. Hoonhout, and K. Väänänen-Vainio-Mattila, “User experience evaluation methods: Current state and development needs,” in Proceedings of the 6th Nordic Conference on Human-Computer Interaction: Extending Boundaries, pp. 521–530, 2010, doi: 10.1145/1868914.1868973.
- A. Hinderks, “Design and evaluation of a short version of the user experience questionnaire (UEQ-S),” International Journal of Interactive Multimedia and Artificial Intelligence, 2017, doi: 10.9781/ijimai.2017.09.001.
- D. Wallach, J. Conrad, and T. Steimle, “The UX Metrics Table: A Missing Artifact,” in International Conference of Design, User Experience, and Usability, pp. 507–517, Springer, 2017, doi: 10.1007/978-3-319-58634-2_37.
- G. Gronier, C. Lallemand, and A. Chauvet, “Mesurer la Formation de la Première Impression d’une Interface à l’Aide du Test des 5 Secondes,” in Huitième Colloque de Psychologie Ergonomique (EPIQUE), 2015.
- V. Roto, M. Obrist, and K. Väänänen-Vainio-Mattila, “User experience evaluation methods in academic and industrial contexts,” in Proceedings of the Workshop UXEM, vol. 9, pp. 1–5, 2009.
- C. Lallemand and V. Koenig, “How could an intranet be like a friend to me? Why standardized UX scales don’t always fit,” in Proceedings of the European Conference on Cognitive Ergonomics, pp. 9–16, 2017, doi: 10.1145/3121283.3121288.
- C. L. B. Maia and E. S. Furtado, “A systematic review about user experience evaluation,” in International Conference of Design, User Experience, and Usability, pp. 445–455, Springer, 2016, doi: 10.1007/978-3-319-40409-7_42.
- Y. Forster, S. Hergeth, F. Naujoks, and J. F. Krems, “How usability can save the day—Methodological considerations for making automated driving a success story,” in Proceedings of the 10th International Conference on Automotive User Interfaces and Interactive Vehicular Applications, pp. 278–290, 2018, doi: 10.1145/3239060.3239076.
- J. Klammer and F. W. van den Anker, “A platform to connect Swiss consumers of fair trade products with producers in developing countries: Needs and motivations,” in International Conference of Design, User Experience, and Usability, pp. 664–681, Springer, 2018, doi: 10.1007/978-3-319-91806-8_52.
- J. Baumgartner, A. Sonderegger, and J. Sauer, “No need to read: Developing a pictorial single-item scale for measuring perceived usability,” International Journal of Human-Computer Studies, vol. 122, pp. 78–89, 2019, doi: 10.1016/j.ijhcs.2018.08.008.
- D. Wigdor and D. Wixon, Brave NUI World: Designing Natural User Interfaces for Touch and Gesture, Elsevier, 2011.
- T. Nishida, Conversational Informatics: An Engineering Approach, John Wiley & Sons, 2008.
- D. Frohlich and P. Luff, “Applying the technology of conversation to the technology for conversation,” in Computers and Conversation, pp. 187–220, Elsevier, 1990.
- V. K. Chaudhri, A. Cheyer, R. Guilii, W. Jarrold, K. L. Myers, and J. Niekarsz, “A case study in engineering a knowledge base for an intelligent personal assistant,” in SemDesk, pp. 25–32, 2006.
- D. M. Kaushik and R. Jain, “Natural user interfaces: Trend in virtual interaction,” arXiv preprint arXiv:1405.0101, 2014.
- E. A. Schegloff, Sequence Organization in Interaction: A Primer in Conversation Analysis I, vol. 1, Cambridge University Press, 2007, doi: 10.1017/CBO9780511791208.
- D. A. Norman, Living with Complexity, MIT Press, 2016.
- R. J. Moore and R. Arar, “Conversational UX Design: An Introduction,” in Studies in Conversational UX Design, pp. 1–16, Springer, 2018, doi: 10.1007/978-3-319-95579-7_1.
- R. J. Moore and R. Arar, Conversational UX Design: A Practitioner’s Guide to the Natural Conversation Framework, Morgan & Claypool, 2019, doi: 10.1145/3304087.
- H. Sacks, E. A. Schegloff, and G. Jefferson, “A simplest systematics for the organization of turn-taking for conversation,” Language, vol. 50, no. 4, pp. 696–735, 1974, doi: 10.1353/lan.1974.0010.
- A. B. Kocaballi, L. Laranjo, and E. Coiera, “Understanding and measuring user experience in conversational interfaces,” Interacting with Computers, vol. 31, no. 2, pp. 192–207, 2019, doi: 10.1093/iwc/iwz022.
- A. L. Iniguez-Carrillo, L. S. Gaytan-Lugo, M. A. Garcia-Ruiz, and R. Maciel-Arellano, “Usability questionnaires to evaluate voice user interfaces,” IEEE Latin America Transactions, vol. 19, no. 9, pp. 1468–1477, 2021, doi: 10.1109/TLA.2021.9477283.
- J. R. Lewis, “Standardized questionnaires for voice interaction design,” Voice Interaction Design, vol. 1, no. 1, pp. 1–16, 2016.
- F. Iniesto, T. Coughlan, and K. Lister, “Implementing an accessible conversational user interface: Applying feedback from university students and disability support advisors,” in Proceedings of the 18th International Web for All Conference, pp. 1–5, 2021, doi: 10.1145/3430263.3452436.
- J. Wei, W. Jiang, C. Wang, D. Yu, J. Goncalves, T. Dingler, and V. Kostakos, “Understanding how to administer voice surveys through smart speakers,” Proceedings of the ACM on Human-Computer Interaction, vol. 6, no. CSCW2, pp. 1–32, 2022, doi: 10.1145/3555767.
- A. Barbaric, C. Munteanu, H. Ross, and J. A. Cafazzo, “A voice app design for heart failure self-management: Proof-of-concept implementation study,” JMIR Formative Research, vol. 6, no. 12, p. e40021, 2022, doi: 10.2196/40021.
- J.-G. Shin, G.-Y. Choi, H.-J. Hwang, and S.-H. Kim, “Evaluation of emotional satisfaction using questionnaires in voice-based human–AI interaction,” Applied Sciences, vol. 11, no. 4, p. 1920, 2021, doi: 10.3390/app11041920.
- E. Kuang, E. Jahangirzadeh Soure, M. Fan, J. Zhao, and K. Shinohara, “Collaboration with conversational AI assistants for UX evaluation: Questions and how to ask them (voice vs. text),” in Proceedings of the 2023 CHI Conference on Human Factors in Computing Systems, pp. 1–15, 2023, doi: 10.1145/3544548.3581247.
- B. Zarouali, T. Araujo, J. Ohme, and C. De Vreese, “Comparing chatbots and online surveys for (longitudinal) data collection: An investigation of response characteristics, data quality, and user evaluation,” Communication Methods and Measures, vol. 18, no. 1, pp. 72–91, 2024, doi: 10.1080/19312458.2023.2210576.
- E. A. Beam, “Social media as a recruitment and data collection tool: Experimental evidence on the relative effectiveness of web surveys and chatbots,” Journal of Development Economics, vol. 162, p. 103069, 2023, doi: 10.1016/j.jdeveco.2023.103069.
- H. Soni et al., “Virtual conversational agents versus online forms: Patient experience and preferences for health data collection,” Frontiers in Digital Health, vol. 4, p. 954069, 2022, doi: 10.3389/fdgth.2022.954069.
- P. Sprengholz and C. Betsch, “Ok Google: Using virtual assistants for data collection in psychological and behavioral research,” Behavior Research Methods, vol. 54, no. 3, pp. 1227–1239, 2022, doi: 10.3758/s13428-021-01629-y.
- I. Celino and G. R. Calegari, “Submitting surveys via a conversational interface: An evaluation of user acceptance and approach effectiveness,” International Journal of Human-Computer Studies, vol. 139, p. 102410, 2020, doi: 10.1016/j.ijhcs.2020.102410.
- R. Maharjan, D. A. Rohani, P. Bækgaard, J. Bardram, and K. Doherty, “Can we talk? Design implications for the questionnaire-driven self-report of health and wellbeing via conversational agent,” in Proceedings of the 3rd Conference on Conversational User Interfaces, pp. 1–11, 2021, doi: 10.1145/3469595.3469600.
- P. V. Miller, “Alternative question forms for attitude scale questions in telephone interviews,” Public Opinion Quarterly, vol. 48, no. 4, pp. 766–778, 1984, doi: 10.1086/268879.
- L. R. Fabrigar and J. A. Krosnick, “Attitude measurement and questionnaire design,” in Blackwell Encyclopedia of Social Psychology, pp. 42–47, 1995.
- J. H. Yu, G. Albaum, and M. Swenson, “Is a central tendency error inherent in the use of semantic differential scales in different cultures?” International Journal of Market Research, vol. 45, no. 2, pp. 1–16, 2003, doi: 10.1177/147078530304500201.
- V. D. de Rada Igúzquiza, “¿Influye el diseño de las preguntas en las respuestas de los entrevistados?” Revista Española de Sociología, vol. 31, no. 1, p. a83, 2022, doi: 10.22325/fes/res.2022.83.
- J. C. Mata-Serrano, I. Díaz-Oreiro, G. López, and L. A. Guerrero, “Comparing written and voice captured responses of the User Experience Questionnaire (UEQ),” in International Conference on Information Technology & Systems, pp. 519–529, Springer, 2022, doi: 10.1007/978-3-030-96293-7_43.
- M. Rauschenberger, M. Schrepp, M. Pérez Cota, S. Olschner, and J. Thomaschewski, “Efficient measurement of the user experience of interactive products: How to use the User Experience Questionnaire (UEQ). Example: Spanish language version,” International Journal of Interactive Multimedia and Artificial Intelligence, vol. 2, no. 1, pp. 39–45, 2013, doi: 10.9781/ijimai.2013.215.
- I. Díaz-Oreiro, G. López, L. Quesada, and L. A. Guerrero, “Conversational design patterns for a UX evaluation instrument implemented by voice,” in International Conference on Information Technology & Systems, pp. 530–540, Springer, 2022, doi: 10.1007/978-3-030-96293-7_44.
- J. Brooke et al., “SUS—A Quick and Dirty Usability Scale,” in Usability Evaluation in Industry, vol. 189, no. 194, pp. 4–7, 1996, doi: 10.1201/9781498710411-35.
- S. G. Hart and L. E. Staveland, “Development of NASA-TLX (Task Load Index): Results of empirical and theoretical research,” in Advances in Psychology, vol. 52, pp. 139–183, Elsevier, 1988, doi: 10.1016/S0166-4115(08)62386-9.
- M. Hassenzahl, “The effect of perceived hedonic quality on product appealingness,” International Journal of Human-Computer Interaction, vol. 13, no. 4, pp. 481–499, 2001, doi: 10.1207/S15327590IJHC1304_07.
- S. G. Hart, “NASA-Task Load Index (NASA-TLX): 20 years later,” Proceedings of the Human Factors and Ergonomics Society Annual Meeting, vol. 50, pp. 904–908, 2006, doi: 10.1177/154193120605000909.
- R. Wang and J. A. Krosnick, “Middle alternatives and measurement validity: A recommendation for survey researchers,” International Journal of Social Research Methodology, vol. 23, no. 2, pp. 169–184, 2020, doi: 10.1080/13645579.2019.1645384.
- A. Schankin, M. Budde, T. Riedel, and M. Beigl, “Psychometric properties of the User Experience Questionnaire (UEQ),” in Proceedings of the 2022 CHI Conference on Human Factors in Computing Systems, pp. 1–11, 2022, doi: 10.1145/3491102.3502098.