
Graph Neural Networks for Fault Diagnostics in Cyber-Physical Systems: A Survey of Taxonomy, Deployment Architectures and Failure Modes

(This article belongs to the Section Interdisciplinary Applications – Computer Science (IAC))
Export Citations
Cite
Tiwari, V. , Suaifan, O. , Othman, R. and Gupta, A. (2026). Graph Neural Networks for Fault Diagnostics in Cyber-Physical Systems: A Survey of Taxonomy, Deployment Architectures and Failure Modes. Journal of Engineering Research and Sciences, 5(6), 67–96. https://doi.org/10.55708/js0506006
Vaibhavi Tiwari, Ola Suaifan, Ramy Othman and Anand Gupta. "Graph Neural Networks for Fault Diagnostics in Cyber-Physical Systems: A Survey of Taxonomy, Deployment Architectures and Failure Modes." Journal of Engineering Research and Sciences 5, no. 6 (June 2026): 67–96. https://doi.org/10.55708/js0506006
V. Tiwari, O. Suaifan, R. Othman and A. Gupta, "Graph Neural Networks for Fault Diagnostics in Cyber-Physical Systems: A Survey of Taxonomy, Deployment Architectures and Failure Modes," Journal of Engineering Research and Sciences, vol. 5, no. 6, pp. 67–96, Jun. 2026, doi: 10.55708/js0506006.
Graph Neural Networks (GNNs) have emerged as a promising approach for fault diagnosis in complex cyber-physical systems because they can model intercomponent relationships, fault propagation, and system-level anomalies across domains such as industrial automation, smart grids, transportation, and healthcare. This survey presents a multidimensional review of GNN-based fault diagnostics, organizing existing methods according to graph representation, learning paradigm, diagnostic objective, and deployment context. It examines commonly used benchmark datasets, evaluation protocols, and cloud, edge, hybrid, and federated deployment architectures, with particular attention to reproducibility and practical implementation. In addition to methodological limitations, the survey identifies operational failure modes, including cascading misdiagnosis, topology drift, noise amplification, open-set misclassification, adversarial vulnerability, and concept drift, and examines their implications for safety-critical systems. Emerging research directions, including physics-informed learning, multimodal fusion, dynamic graph modeling, and privacy-preserving federated GNNs, are discussed alongside their ethical and safety implications. Unlike reviews centered primarily on diagnostic tasks or application domains, this survey integrates methodological, architectural, and operational perspectives within a unified framework. The analysis indicates that although GNNs offer capabilities for dependency-aware fault diagnosis, their practical deployment remains constrained by inconsistent benchmarking, sensitivity to graph construction, computational requirements, limited interpretability, and insufficient validation under evolving operational conditions. Finally, practitioneroriented design guidelines are presented to support the development of reliable, robust, and deployable GNN-based diagnostic systems and to connect algorithmic advances with the operational reliability requirements of next-generation fault-tolerant infrastructures.
1. Introduction
Fault diagnostics plays a central role in maintaining the reliability, safety, and operational continuity of modern cyber-physical systems, including industrial automation, smart grids, transportation networks, and healthcare monitoring platforms. As these systems become increasingly complex and interconnected, failures may propagate across components rather than remain isolated, resulting in cascading effects and system-wide disruptions. Recent industry analyses indicate the scale of this problem: average downtime costs exceed $14,056 per minute, 55–61% of manufacturers experience unplanned downtime annually, and 66–80% of failures are attributed to human error. Globally, downtime losses are estimated to exceed $400 billion per year [1, 2], highlighting the economic and operational risks associated with inadequate fault tolerance. These trends indicate that improving system resilience is both a technical and operational priority.
Traditional fault diagnostic approaches have relied on physics-based models, signal processing techniques, and statistical methods. Although effective in well-understood environments, these approaches often struggle to scale to high-dimensional, sensor-rich systems characterized by nonlinear dependencies and dynamic interactions [3]. The development of machine learning, particularly deep learning methods such as convolutional neural networks (CNNs) and recurrent neural networks (RNNs), has improved diagnostic performance through automated feature extraction from time-series and vibration signals. However, these methods generally assume grid-like data structures and may not adequately capture relational dependencies among system components. As modern infrastructures evolve into highly interconnected systems, modeling techniques are required that can explicitly represent component inter-actions, failure propagation pathways, and system-wide dependencies.
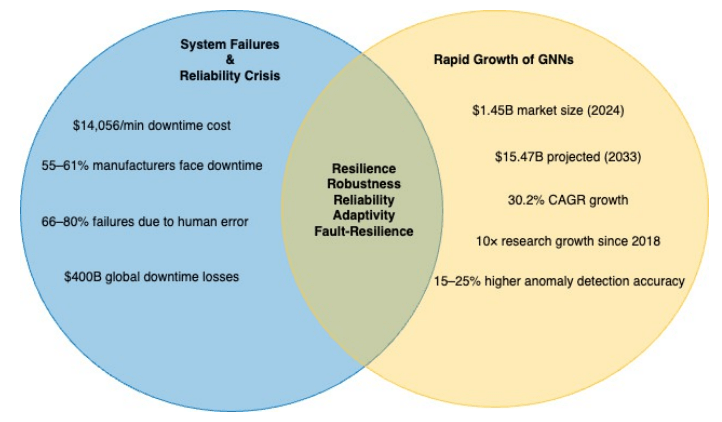
Graph-based modeling provides a natural represen-tation for complex systems, in which nodes correspond to sensors or components and edges represent physical connections, functional dependencies, or statistical correlations. Building on this representation, Graph Neural Networks (GNNs) have demonstrated the ability to learn from structured relational data through message-passing and neighborhood-aggregation mechanisms. By explicitly modeling intercomponent relationships, GNNs can support fault localization, improve robustness to noisy or incomplete sensor data, and represent cascading failure patterns. The growth of GNN adoption further reflects their relevance: the global GNN market was valued at $1.45 bil-lion in 2024 and is projected to reach $15.47 billion by 2033, corresponding to a 30.2% compound annual growth rate [4, 5]. Concurrently, GNN research output has increased more than tenfold since 2018 [6, 7], and several studies report improvements of 15–25% in anomaly detection ac-curacy for networked systems compared with traditional machine learning methods [8, 9, 10]. These findings position GNNs as a promising basis for dependency-aware and fault-tolerant diagnostic systems.
Figure 1 illustrates the relationship between reliability challenges in complex systems and the continued development of GNN-based methods. Rising downtime costs, recurring failures, and systemic vulnerabilities coincide with the scalability, relational modeling capability, and predictive potential of GNNs, motivating diagnostic approaches that integrate predictive fault detection, cascading failure modeling, and dependency-aware system design. In recent years, GNN-based fault diagnostics have been investigated across several domains, including spatiotemporal GNNs for rotating machinery monitoring, graph attention mechanisms for power-grid fault localization, dynamic graph learning for IoT anomaly detection, and causal intervention based GNNs for complex industrial processes [7, 8, 11, 12]. Despite these developments, several challenges remain, including reliable graph construction from raw sensor data, limited availability of labeled fault data, real-time deployment constraints on edge devices, and the need for interpretable and causally grounded diagnostic decisions.
This survey presents a structured, system-oriented syn-thesis of GNN-based fault diagnostics. Specifically, (i) categorizes existing approaches according to graph representation, learning paradigm, diagnostic objective, and deployment context; (ii) analyzes benchmark datasets and evaluation practices, with emphasis on reproducibility chal-lenges; (iii) examines cloud, edge, hybrid, and federated deployment architectures to assess practical feasibility; (iv) characterizes operational failure modes and distinguishes them from methodological limitations in safety-critical set-tings; and (v) presents practitioner-oriented design guide-lines and ethical considerations to support the development of reliable, resilient, and deployable diagnostic systems.
2. Methodology
This survey used a structured retrospective literature review methodology to synthesize research on Graph Neural Network (GNN)-based fault diagnostics. The review process was documented retrospectively because the initial literature collection was developed iteratively during manuscript preparation rather than through a prospectively registered review protocol. Accordingly, the methodology was informed by the transparency principles of the Preferred Reporting Items for Systematic Reviews and Meta-Analyses (PRISMA) 2020 framework [13], but the survey is not presented as a fully registered systematic review. The retrospective procedure focused on documenting the information sources, search concepts, eligibility criteria, treatment of duplicate and preprint records, study categorization, and evidence-synthesis process used to construct the final literature base.
2.1. Review Scope and Research Questions
The review examined GNN-based methods for fault detection, classification, localization, anomaly detection, prognostics, remaining useful life estimation, and operational deployment in industrial and cyber-physical systems. The principal publication period covered studies from 2018 to 2026, corresponding to the period in which GNN-based diagnostic research became increasingly established [6, 7, 14, 15]. Earlier studies were retained when they introduced foundational fault-diagnostic methods, graph-learning architectures, benchmark datasets, or evaluation practices required to explain the historical development of the field. The review addressed the following questions: which graph representations and GNN architectures are used for fault diagnostics; which learning paradigms and diagnostic objectives are considered; which datasets, metrics, and validation protocols are used; how GNN-based systems are deployed in cloud, edge, hybrid, federated, distributed, and digital-twin-supported environments; and which methodological limitations, operational failure modes, ethical concerns, and emerging research directions remain insufficiently addressed.
2.2. Information Sources and Search Concepts
Relevant studies were identified through multidisciplinary engineering and computing sources, including IEEE Xplore, Scopus, Web of Science, ScienceDirect, Springer-Link, ACM Digital Library, IOPscience, and Google Scholar. The literature collection was supplemented through backward reference searching of relevant reviews and primary studies and forward citation tracking of foundational and recent publications. Search concepts combined graph-learning terminology with fault-diagnostic, prognostic, application-domain, and deployment terms. Representa-tive graph-related terms included graph neural network, graph convolutional network, graph attention network, spatiotemporal graph neural network, hypergraph, dynamic graph, and heterogeneous graph. Diagnostic terms included fault diagnosis, fault detection, fault classification, fault localization, anomaly detection, prognostics, and remaining useful life. Additional searches incorporated terms related to explainability, physics-informed learning, federated learning, multimodal fusion, open-set recognition, uncertainty quantification, adversarial robustness, edge deployment, and digital twins.
2.3. Eligibility Criteria
Studies were considered eligible when they applied, evaluated, or systematically examined a graph-learning method relevant to fault diagnostics or condition monitoring. Eligible methods included graph convolutional networks, graph attention networks, spatiotemporal GNNs, dynamic graph models, heterogeneous graphs, hypergraph networks, Graph–Transformer architectures, and related graph based learning approaches [14, 15, 16]. Studies were required to address at least one diagnostic objective, such as fault detection, classification, localization, anomaly detection, prognostics, or remaining useful life estimation, and to model sensors, components, variables, subsystems, or physical relationships through a graph representation. The scope included industrial manufacturing, rotating machinery, power systems, transportation, aerospace, telecommunications, IIoT, cyber-physical infrastructure, energy systems, and biomedical monitoring. Peer-reviewed journal articles and conference papers were prioritized, while review papers were retained for historical synthesis, terminology, and citation tracking. Dataset papers and institutional repositories were included when they defined benchmarks used in the reviewed literature.
2.4. Exclusion Criteria
Studies were excluded when they used graphs only for visualization or conventional network analysis with-out a graph-learning model; addressed generic graph-classification tasks without relevance to fault diagnostics or condition monitoring; relied solely on conventional machine-learning or deep-learning methods without graph representation; lacked sufficient methodological or experimental detail; or fell outside the engineering, industrial, infrastructure, or biomedical-monitoring scope of the sur-vey. Abstract-only publications, posters, patents, theses, editorials, and nontechnical commentary were not treated as primary methodological evidence. Commercial market reports and industry webpages were used only to support contextual statistics in the Introduction and were excluded from the methodological synthesis.
2.5. Treatment of Duplicate Records and Preprints
The bibliography was reviewed retrospectively to identify duplicate records, repeated DOI entries, and preprint–publication pairs. When both a preprint and a peer-reviewed journal or conference version of the same study were available, the formally published version was retained. Citation metadata were checked for consistency in title, au-thor list, publication year, venue, volume, article number, page range, and DOI. Preprints were retained only when no corresponding peer-reviewed version was identified and when the study addressed a recent or underrepresented topic relevant to the survey. Such records were explic-itly identified as preprints in the bibliography and were interpreted more cautiously than peer-reviewed evidence.
2.6. Study Selection and Retrospective Verification
The final literature base was constructed through itera-tive identification, relevance screening, full-text assessment, citation checking, and bibliography verification. Titles and abstracts were first examined for relevance to GNN-based fault diagnostics, after which potentially eligible studies were assessed in full text. Studies were retained when they contributed methodological, experimental, deployment,

benchmark, robustness, explainability, or safety-related evidence relevant to the survey taxonomy. During revision, the retained bibliography was re-examined to remove duplicate entries, replace superseded preprints with published versions, verify recent 2025–2026 publications, and distinguish primary studies from reviews, dataset papers, standards, technical reports, and contextual sources. Because complete records of the original database-result counts and sequential exclusion decisions were not preserved, numerical PRISMA counts are not reported. Figure 2 presents the documented retrospective workflow used to identify, screen, verify, classify, and synthesize the retained literature.
2.7. Data Extraction and Categorization
For each retained study, information was extracted on publication year, publication type, application domain, diagnostic objective, graph-construction strategy, node and edge definitions, static or dynamic topology, GNN architecture, learning paradigm, data modality, benchmark dataset, preprocessing method, evaluation metrics, com-parison baselines, explainability mechanism, uncertainty-estimation approach, deployment context, computational requirements, robustness evaluation, and reported limitations. The studies were organized according to four principal dimensions: graph structure and representation, learning paradigm, diagnostic objective, and deployment context. Additional synthesis categories covered application domains, benchmark datasets, evaluation protocols, methodological limitations, operational failure modes, ethical and safety concerns, emerging research directions, and practitioner-oriented design considerations.
2.8. Quality and Relevance Assessment
The methodological relevance of the retained studies was evaluated using five criteria: clarity of graph construction and system representation; adequacy of the dataset and experimental design; transparency of preprocessing, training, and validation procedures; appropriateness of evaluation metrics and comparison baselines; and completeness of robustness, deployment, or limitations reporting. Each criterion was assessed qualitatively as fully reported, partially reported, or not reported. Studies were not excluded solely because one reporting category was incomplete when they contributed foundational, historical, benchmark, or emerging methodological information. However, claims derived from studies with incomplete validation or limited experimental transparency were interpreted cautiously.
2.9. Evidence Synthesis
A structured qualitative and taxonomy-based synthesis was conducted because the reviewed studies differed substantially in application domain, graph construction, datasets, operating conditions, fault definitions, model configurations, train test procedures, and evaluation metrics. These differences prevented a reliable statistical meta-analysis across the full evidence base. The synthesis there-fore compared recurring graph representations, learning paradigms, diagnostic objectives, benchmark practices, deployment architectures, robustness mechanisms, explain-ability approaches, and reported limitations. Quantitative findings were discussed only when the experimental set-ting and comparison conditions were sufficiently clear, and numerical results were not generalized across incompatible datasets or application domains.
3. Background
Fault diagnosis encompasses methodologies that aimcto detect, isolate, and identify abnormal conditions in engineering systems to ensure reliability, safety, and operational efficiency. The diagnostic process typically includes fault detection (determining whether a fault has occurred), fault classification (identifying the type of fault), fault localization (pinpointing the faulty component), and, in advanced settings, fault prognosis or remaining useful life estimation. In modern cyber-physical systems, faults may arise from component degradation, sensor malfunctions, communication failures, or external disturbances, often exhibiting complex propagation patterns due to interdependencies among subsystems. These characteristics necessitate diagnostic approaches capable of modeling nonlinear relationships, dynamic interactions, and system-wide dependencies.
Traditional diagnostic methods can be broadly categorized into model-based, signal-based, and data-driven approaches. Model-based techniques rely on first-principles physics or analytical redundancy to generate residuals for fault detection. Although highly interpretable, they require accurate system models and become impractical for large-scale or evolving systems. Signal-based methods leverage time-frequency analysis, spectral decomposition, and statistical feature extraction to identify anomalies in sensor data and have been widely applied in rotating machinery and structural health monitoring. Data-driven approaches, including classical machine learning models such as support vector machines and random forests, improve diagnostic performance by learning patterns from historical data but often depend heavily on handcrafted features and struggle to capture complex system interactions. Deep learning methods, including CNNs for spatial feature extraction and RNNs or LSTMs for temporal modeling, address feature engineering limitations; however, their reliance on Euclidean data representations restricts their ability to model relational dependencies among dis-tributed system components [6, 7]. Figure 3 provides a visual overview of the evolution of diagnostic approaches
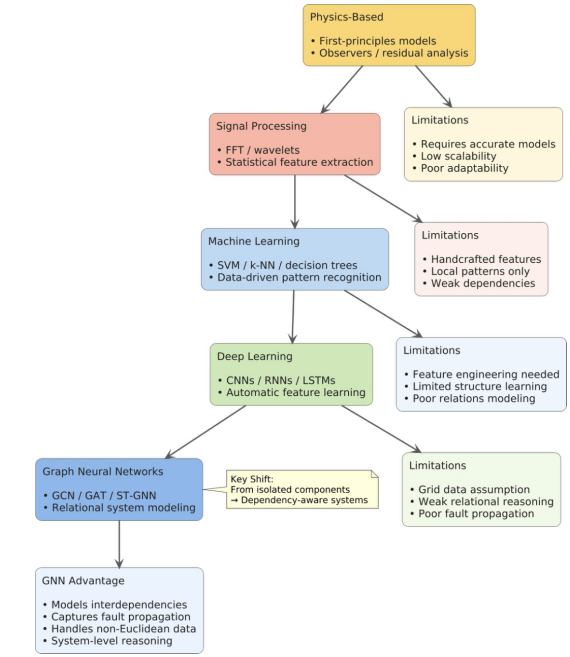
and the key limitations that motivate the shift to graph neural networks.
Graph-based system modeling provides a useful abstraction for representing complex engineered systems, where nodes denote sensors, components, or subsystems, and edges encode physical connections, functional dependencies, or statistical correlations. This representation enables explicit modeling of fault propagation pathways and intercomponent influences that are difficult to capture using traditional grid-based learning methods. Graph representations may be derived from physical topology, correlation analysis, or learned adaptively from data, allowing flexibility across diverse application domains. Within this paradigm, Graph Neural Networks (GNNs) extend deep learning to non-Euclidean domains through iterative message passing among neighboring nodes, thereby aggregating local and global structural information. Common architectures such as Graph Convolutional Networks (GCNs), Graph Attention Networks (GATs), and spatiotemporal GNNs model both structural dependencies and temporal dynamics, making them well suited for fault diagnostics in interconnected, sensor-rich environments [7, 8].
Recent developments have extended GNN-based fault diagnosis through explainable and causal reasoning, adaptive graph construction, spatiotemporal modeling, and hypergraph representations. These approaches seek to improve interpretability, reduce sensitivity to spurious relationships, accommodate changing system structures, and represent higher order dependencies in multivariate and multi sensor environments [6, 8, 17, 18, 19]. Collectively, they establish the methodological foundation for the task-specific, deployment-oriented, and reliability-focused developments examined in the subsequent sections.
4. Historical Evolution of Fault Diagnostics Toward GNNs
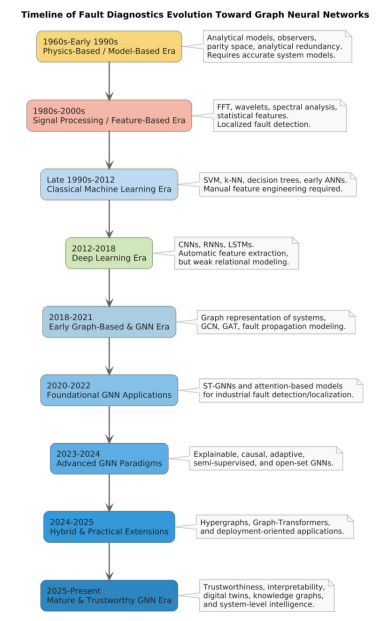
Fault diagnostics has evolved in response to advances in sensing technologies, computational capabilities, and data availability. Early diagnostic systems were predominantly physics-based, relying on analytical models and expert knowledge to identify deviations from expected behavior. Observer-based methods, parity-space techniques, and analytical redundancy provided high interpretability and reliability in well-characterized systems but became difficult to apply in large-scale, nonlinear, or dynamically changing environments. As industrial systems became increasingly sensor-rich, signal-processing methods gained prominence, using spectral analysis, wavelet transforms, and statistical features to identify anomalies in vibration, acoustic, and electrical signals. Although effective for localized diagnosis, these approaches provided limited representation of interdependencies among system components [14]. Figure 4 illustrates the historical progression from physics-based and signal-processing approaches to data-driven and graph-based methods.
The emergence of data driven methods marked a transition toward automated diagnostics. Classical machine learning techniques, including support vector machines, k-nearest neighbors, and decision trees, enabled pattern recognition from historical fault data but remained dependent on manual feature engineering and often struggled with high-dimensional, nonlinear relationships. Deep learning further reduced the need for handcrafted features by learning hierarchical representations directly from sensor data. Convolutional neural networks were applied to spatial and time-frequency patterns, while recurrent neural networks and long short-term memory models sup-ported temporal analysis. However, these architectures generally assume Euclidean data structures and provide limited representation of relational dependencies and fault-propagation pathways in interconnected systems [7, 14]. Table 1 summarizes the strengths and limitations associated with each stage of this evolution.
The transition toward graph-based diagnostics arose from these limitations and from the inherently networked structure of modern cyber-physical systems. Early graph-based methods used graphical models and network analysis to represent component interactions and potential failure-propagation paths. Graph Neural Networks extended this principle by learning directly from structured system representations through message passing and neighborhood aggregation [14]. Since the late 2010s, GNN-based methods have increasingly supported fault detection, classification, localization, and prognostics by combining local component information with system-level relational context.
Table 1: Evolution of fault diagnostic approaches
| Era | Representative Methods | Strengths | Limitations |
|---|---|---|---|
| Physics-based | Observers, parity-space methods, analytical redundancy | High interpretability; reliable in well-modeled systems | Requires accurate models; limited scalability in complex systems |
| Signal-based | FFT, wavelet transforms, statistical features | Effective for localized fault detection; established analytical methods | Limited ability to model system interactions |
| Classical machine learning | SVM, k-NN, decision trees | Data-driven pattern recognition; reduced dependence on physical models | Requires manual feature engineering; limited representation of nonlinear relationships |
| Deep learning | CNNs, RNNs, LSTMs | Automated feature extraction; temporal and spatial modeling | Assumes Euclidean data structures; limited relational modeling |
| Graph neural networks | GCN, GAT, ST-GNN | Models system dependencies; supports fault localization and graph-based analysis | Graph-construction sensitivity; computational overhead |
From 2020 onward, research expanded beyond foundational convolutional, attention-based, and spatiotemporal GNNs toward more adaptive, interpretable, and deployment oriented approaches. Recent developments include causal and explainable models, dynamic graph learning, semi-supervised and open-set methods, hypergraph representations, and hybrid Graph–Transformer architectures [6, 7, 8, 9, 17]. This progression reflects a broader shift from isolated component analysis toward system-level fault diagnosis under limited labels, evolving operating conditions, and practical deployment constraints.
5. Related Work
The application of Graph Neural Networks (GNNs) to fault diagnostics has expanded with the need to represent relational dependencies and fault-propagation dynamics in interconnected cyber-physical systems. Early studies adapted foundational architectures, including Graph Convolutional Networks (GCNs) and Graph Attention Net-works (GATs), to model sensor correlations and structural topologies, while subsequent work introduced spatiotemporal extensions for evolving fault patterns. More recent studies have examined explainability, causal inference, adaptive graph learning, and multimodal fusion across industrial processes, renewable-energy systems, and marine machinery [20, 21, 22]. The literature primarily addresses four diagnostic objectives: fault detection, classification, localization, and prognostics. Although these tasks share graph based modeling foundations, they differ in learning
paradigms, data modalities, and evaluation requirements. This section reviews representative contributions, summarizes cross-cutting gaps, and compares the present survey with previous reviews.
5.1. Fault Detection
Fault detection identifies anomalous system states with-out necessarily assigning them to predefined fault categories and is commonly formulated as a graph anomaly detection problem. Early graph-based studies used graph convolution to combine measurements, component relationships, and engineering knowledge. In [23], the authors incorporated measurement information and prior knowledge into a graph convolutional diagnostic model, while in [24] authors modeled relationships among dissolved-gas measurements for power-transformer diagnosis. Spatiotemporal GNNs subsequently incorporated temporal dependencies, and attention-enhanced variants improved the weighting of spatial and temporal relationships in noisy sensor environments [25].
Recent work has explored self-supervised and contrastive learning to reduce dependence on labeled fault data. Pretext tasks such as edge masking and node aug-mentation support representation learning for anomaly scoring, while hierarchical spatiotemporal models capture interactions across multiple subsystems and scales [21]. Nevertheless, real-time detection and open-set recognition remain challenging when unseen fault signatures emerge under changing operating conditions. Current methods increasingly emphasize label efficiency and robustness, but validation in dynamic deployment environments remains limited [25].
5.2. Fault Classification
Fault classification assigns detected anomalies to specific fault categories and frequently uses graph representations for multisensor fusion. Foundational GCN-based studies demonstrated that structured measurement relationships and engineering knowledge could support classification across interconnected variables [23, 24]. Sub-sequent multiview approaches integrated time-domain, frequency-domain, and wavelet representations to capture complementary fault characteristics in heterogeneous sensor environments [20].
Recent research has focused on classification under noisy, imbalanced, and changing operating conditions. Noise-robust aggregation, adaptive graph weighting, and multiscale representations have been used to improve sensitivity to weak or minority-class fault patterns, while semi-supervised propagation incorporates unlabeled observations when annotated samples are limited. Despite these developments, changes in operating regimes and sensor configurations continue to reduce cross-domain performance [20]. Transferability across machines, facilities, and operating conditions therefore remains unresolved.
5.3. Fault Localization
Fault localization identifies the source or affected com-ponents of a fault by exploiting the relational structure of the system graph. In [26], the authors proposed a two-stage physics-informed framework that embedded power-grid geometry into a GNN and used physical similarity among labeled and unlabeled samples to support localization under sparse observations and limited labels. This work demonstrated how physical topology and graph learning can jointly support component-level fault identification.
Subsequent methods have used node, edge, and sub graph importance to identify components associated with diagnostic outcomes. Adaptive spatiotemporal and hyper-graph models can additionally represent bidirectional and higher-order dependencies relevant to fault propagation. However, localization performance remains sensitive to graph quality and structural mismatch. Inaccurate or static graph priors may propagate attribution errors, indicating the need for reliable and adaptive graph construction [25].
5.4. Prognostics and Remaining Useful Life Estimation
Prognostics and remaining useful life (RUL) estimation aim to predict degradation trajectories and expected failure horizons. In [27], the authors introduced a hierarchical attention graph convolutional network that represented sensors as graph nodes, modeled spatial dependencies through hierarchical graph convolution, and captured temporal behavior using bidirectional long short-term memory modeling. This study provided an early demonstration of graph-based multi sensor prognostics.
Subsequent work incorporated gated graph convolution, temporal graph modeling, attention, and uncertainty-aware prediction. Spatiotemporal GNNs have been applied to uncertainty estimation, while Graph–Transformer hybrids have supported frequency-domain degradation analysis. Dynamic graph models can also represent changing inter-sensor relationships and previously unseen degradation modes. However, limited availability of long degradation sequences and weak generalization across operating conditions continue to restrict evaluation and deployment [22]. Current prognostic research therefore increasingly emphasizes adaptive and uncertainty-aware modeling, but still lacks sufficient long-horizon and cross-domain validation.
5.5. Cross-Cutting Challenges and Research Gaps
Across diagnostic tasks, recurring challenges include static graph assumptions, label scarcity, class imbalance, limited interpretability, and inconsistent evaluation prac-tices. Adaptive graph learning and semi-supervised meth-ods address some of these limitations, but their perfor-mance under real-time, resource-constrained, and chang-ing operating conditions remains insufficiently validated. Differences in graph construction, preprocessing, data parti-tioning, and metric selection further hinder reproducibility and direct comparison across studies [28].
Additional gaps concern the physical validity of learned relationships and explanations, robustness to structural and distributional changes, and the integration of privacy-preserving, multimodal, and adversarially robust learning. These issues are examined in greater detail in the later sections on methodological limitations, operational failure modes, deployment architectures, and emerging research directions. Collectively, they motivate a survey framework that connects graph-learning methodology with bench-marking, reliability, and deployment requirements rather than treating these concerns independently.
5.6. Comparison with Existing Surveys and Novelty of This Review
Several reviews have examined GNN-based fault di-agnosis, but most concentrate on a specific domain, di-agnostic task, or methodological issue. In [14], the authors provided an early general review of GNN-based fault diagnosis and summarized foundational graph-learning formulations and representative applications. In [22], the
Table 2: Comparison of representative surveys related to GNN-based fault diagnosis
Table 2: Comparison of representative surveys related to GNN-based fault diagnosis
| Survey | Primary Scope | Multi-domain Coverage | Unified Taxonomy | Benchmark Analysis | Deployment Analysis | Operational Failure Modes | Ethics and Safety | Practitioner Guidance | Principal Distinction |
|---|---|---|---|---|---|---|---|---|---|
| Study [14] | General GNN-based fault diagnosis | Partial | Partial | Limited | Not explicit | Not explicit | Not explicit | Not explicit | Early synthesis of graph-learning formulations and representative fault-diagnosis applications |
| Study [22] | GNN-based RUL prediction and prognostics | Partial | Task-specific | Primary | Limited | Not explicit | Limited | Not explicit | Focused analysis of GNN methodologies, evaluation practices, and future trends for RUL estimation |
| Study [15] | Process soft sensing, monitoring, and fault diagnosis | Domain-specific | Domain-specific | Limited | Limited | Not explicit | Limited | Not explicit | Industrial-process-centered review of spatiotemporal, attention-based, and hybrid GNN methods |
| Study [7] | Rolling-bearing fault diagnosis | Domain-specific | Domain-specific | Partial | Limited | Not explicit | Limited | Limited | Machinery-specific synthesis of graph construction and GNN methods for bearing diagnostics |
| Study [6] | Explainable GNNs for process fault diagnosis | Domain-specific | Explainability focused | Limited | Limited | Partial | Primary | Limited | Focused examination of explainability techniques and their role in process fault detection and diagnosis |
| Study [3] | Knowledge-graph-enhanced fault diagnosis and sensor management | Partial | Bibliometric | Not primary | Not explicit | Not explicit | Limited | Not explicit | Bibliometric analysis of publication growth, thematic trends, and knowledge-graph applications |
| Present survey | GNN-based fault diagnostics in cyber-physical systems | Primary | Primary | Primary | Primary | Primary | Primary | Primary | Integrated methodological, benchmark, deployment, operational, safety, and practitioner-oriented analysis |
authors focused on GNN methodologies for remaining useful life prediction, including prognostic architectures, evaluation practices, and future trends. In [15], the authors reviewed process soft sensing, monitoring, and fault diagnosis, with emphasis on industrial-process applications. In [7] authors concentrated on rolling-bearing diagnosis and graph-construction strategies. In [6], the author examined explainable neural networks and GNNs for process fault diagnosis, while in [3] authors presented a bibliometric analysis of knowledge-graph-enhanced fault diagnosis and sensor management.
Table 2 compares the thematic coverage of these reviews with the present survey. Existing studies provide valuable analyses of GNN architectures, prognostics, process monitoring, rotating-machinery diagnosis, explainability, and knowledge-graph applications. However, benchmark reproducibility, deployment architectures, operational failure modes, ethical and safety concerns, and practitioner-oriented requirements are generally outside their principal scope. The present survey addresses this gap by connecting methodological developments with the reliability and deployment requirements of cyber-physical systems.
The novelty of this survey lies in its multidimensional, deployment-aware, and system-oriented synthesis. First, it introduces a unified taxonomy that jointly organizes the literature according to graph representation, learning paradigm, diagnostic objective, and deployment context, thereby showing how graph design, learning strategy, diagnostic purpose, and implementation environment jointly influence system behavior.
Second, the survey analyzes benchmark datasets and evaluation practices while identifying reproducibility threats associated with inconsistent preprocessing, graph construction, data partitioning, and metric selection. Third, it examines cloud, edge, hybrid, federated, distributed, and digital-twin-supported architectures in relation to computational, communication, privacy, and latency constraints. Fourth, it distinguishes methodological limitations from operational failure modes, including cascading misdiagnosis, topology drift, noise amplification, open-set misclassification, adversarial vulnerability, over smoothing, and concept drift. Fifth, it connects emerging technical directions with ethical, safety, governance, and practitioner-oriented considerations. The present survey therefore extends prior reviews by relating advances in GNN-based fault diagnosis to the operational reliability requirements of real-world cyber-physical systems.
6. Application Domains
Graph Neural Networks (GNNs) have been applied to fault diagnostics across industrial and cyber-physical systems because they can represent relational dependencies and fault-propagation mechanisms in interconnected infrastructures. Although many methods originate from general graph-learning principles, domain-specific system structures, sensing modalities, operating conditions, and safety requirements influence graph construction, feature representation, diagnostic objectives, and evaluation practices. This section reviews the principal application domains and identifies the characteristics that shape GNN-based diagnostic design.
6.1. Industrial Manufacturing Systems
Industrial manufacturing is a widely studied domain for GNN based fault diagnostics, particularly for rotating machinery, rolling bearings, gearboxes, and robotic systems. Graphs are commonly constructed from multi-sensor vibration measurements, physical sensor layouts, component relationships, or correlation-based adjacency matrices. Early applications used graph convolutional networks to model inter-sensor dependencies and reported improvements in fault-classification performance over conventional neural networks under specific experimental conditions [29]. Spatiotemporal GNNs subsequently extended these approaches by representing interactions among components under varying loads and operating speeds.
Recent methods incorporate multiview features, adaptive graph weighting, and hybrid Graph–Transformer architectures to improve diagnosis under noisy and imbalanced conditions. Explainability mechanisms have also been used to support component-level fault attribution. Neverthe-less, cross-condition generalization, real-time inference on resource-constrained devices, and adaptation to evolving operating regimes remain important challenges [29].
6.2. Power Systems and Smart Grids
Power systems possess an inherent graph structure in which buses, transmission lines, substations, and distributed energy resources form interconnected networks. GNNs have therefore been applied to fault detection and localization in distribution grids, photovoltaic-integrated systems, and microgrids by using physical topology as a graph prior. Early studies frequently relied on static network representations and reported improved localization performance over rule-based or statistical baselines in specific evaluation settings [25].
Dynamic and spatiotemporal graph models have subsequently been used to represent changing loads, renewable-energy variability, and network reconfiguration. Attention mechanisms can emphasize weak fault signatures and propagation pathways, while uncertainty-aware methods support reliability assessment in large networks. Major challenges include scalability to large grids, adaptation to changing topology, adversarial robustness, and real-time operation [25].
6.3. Transportation Systems
In transportation infrastructures, including railways, aviation systems, and autonomous vehicles, GNN-based diagnostic methods model relationships among sensors, mechanical components, infrastructure elements, and control subsystems. Graph representations may encode physical connectivity, functional dependencies, or temporal degradation relationships in rail tracks, aircraft engines, and vehicular networks [30].
Hybrid Graph Transformer and heterogeneous graph architectures have been investigated to integrate frequency-domain features, multiple sensing modalities, and infrastructure data. Evolvable GNN frameworks additionally support incremental diagnosis as new fault categories emerge, reducing the need to train independent models for every condition [30]. However, heterogeneous sensing configurations, sparse failure records, safety-critical validation requirements, and the absence of standardized benchmarks continue to limit cross-system evaluation and generalization.
Related applications include aerospace structural-health monitoring, pipeline and equipment diagnosis in oil and gas infrastructure, and proactive monitoring of servers, communication networks, and cooling systems in data centers. In each case, graph representations are used to capture dependencies that cannot be adequately modeled through isolated component analysis.
6.4. Cyber-Physical and IIoT Systems
Industrial Internet of Things (IIoT) environments contain distributed sensors, actuators, controllers, and communication devices whose interactions naturally form graph structures. GNN-based methods support anomaly detec-tion by modeling cross-device dependencies, communication patterns, and subsystem interactions. Semi-supervised and open-set approaches are particularly relevant because labeled failures are limited and previously unseen fault types may arise during operation [21].
Federated and distributed GNNs have also been investigated for collaborative diagnosis across geographically separated facilities without centralizing raw data. Other approaches embed domain knowledge or temporal con-straints to improve generalization under distribution shifts. Practical adoption remains constrained by communica-tion overhead, computational limitations, nonstationary network conditions, and the need for timely inference in distributed environments [28, 21].
6.5. Healthcare and Biomedical Systems
Healthcare monitoring and biomedical diagnostics use GNNs to represent relationships among physiological signals, wearable sensors, anatomical structures, and clinical variables. Applications include anomaly detection in intensive-care monitoring, cardiac-signal analysis, and multi-sensor wearable systems. Graph-based models can integrate electronic health records, medical images, and sensor measurements while identifying physiological variables associated with abnormal conditions [31].
Multimodal and patient-specific graph architectures have also been applied to clinical decision support, chronic-disease management, drug-interaction analysis, and personalized monitoring. In this domain, diagnostic accuracy must be accompanied by interpretable outputs, privacy protection, regulatory compliance, and robustness across heterogeneous patient populations [31].
Table 3 summarizes the graph-construction strategies, diagnostic tasks, and principal challenges associated with these domains. Although graph structures range from physics-informed topologies to learned adjacency matrices, they share the objective of representing dependencies that influence fault occurrence and propagation. Domain-specific constraints related to scalability, sensing heterogeneity, privacy, interpretability, and data availability determine the suitability of particular GNN architectures and evaluation procedures.
Table 3: Representative application domains of GNN-based fault diagnostics
| Domain | Graph-Construction Basis | Typical Tasks | Key Challenges |
|---|---|---|---|
| Industrial manufacturing | Sensor correlations, physical layouts, learned adjacencies | Detection, classification, localization | Noise sensitivity, class imbalance, cross-condition generalization |
| Power systems | Physical grid topology, dynamic load graphs | Fault localization, cascading-failure detection | Scalability, renewable-energy variability, adversarial robustness |
| Transportation | Component interactions, temporal degradation graphs | Fault detection, RUL estimation | Heterogeneous sensors, sparse failure data |
| IIoT systems | Device-communication graphs, subsystem dependencies | Anomaly detection, open-set recognition | Label scarcity, distributed-deployment constraints |
| Healthcare | Physiological interaction graphs, wearable-sensor networks | Anomaly detection, interpretable diagnostics | Regulatory compliance, patient variability, explainability |
7. Unified Taxonomy of GNN-Based Fault Diagnostics
Existing literature frequently categorizes GNN-based fault diagnostics according to individual tasks, including detection, classification, localization, and prognostics. However, task-based categorization alone does not capture variation in graph representations, learning strategies, di-agnostic objectives, and deployment environments. This section introduces a unified taxonomy across four complementary dimensions: graph structure and representation, learning paradigm, diagnostic objective, and deployment context. Figure 5 illustrates how these dimensions jointly define the design space of current approaches. The taxonomy supports systematic comparison, reveals relationships among methodological choices, and identifies underex-plored combinations in the literature.
7.1. Graph Structure and Representation
A central source of variation in GNN-based fault diagnostics is how system interdependencies are encoded as graphs. Static graphs represent invariant physical or functional relationships through sensor layouts, correlation matrices, or prior engineering knowledge and are common in fixed-topology machinery and process systems [23]. Dynamic graphs represent temporal changes in relationships and are more suitable for varying loads, network recon-figuration, evolving degradation, and changing system topology [8, 26].
Heterogeneous graphs incorporate multiple node and edge types to represent interactions among sensors, actuators, components, physical flows, and information exchanges. Hypergraphs extend pairwise modeling by repre-senting higher-order relationships among groups of components. For example, multi-metric fusion hypergraph networks construct hyperedges from instance, distributional, and spatiotemporal relationships in rotating-machinery diagnosis [16]. Adaptive and multi-relational graph constructions have also been investigated to represent multiple forms of mechanical and sensor dependence [19]. The selected representation influences fault-pathway modeling, noise sensitivity, computational requirements, and generalization across operating conditions.
7.2. Learning Paradigms
Learning paradigms vary according to data availability, labeling constraints, and operational requirements. Super-vised learning remains common when sufficient labeled fault samples are available, particularly for classification and localization using graph convolutional and attention-based architectures [23]. Semi-supervised, self-supervised, and few-shot methods address label scarcity by learning from unlabeled or sparsely labeled graph data [21].
Open-set approaches extend conventional classification by identifying or rejecting fault categories absent during training. For example, a semi-supervised GCN-based framework uses labeled observations and pseudo-labeled samples to distinguish known and unknown faults in marine machinery [32]. Federated learning enables collaborative training across distributed facilities without centralizing raw operational data, while causal and physics-informed approaches incorporate domain knowledge or physical constraints to reduce dependence on spurious statistical relationships [26, 33]. Reinforcement learning represents an additional decision-oriented paradigm, al-though its application to GNN-based fault diagnosis re-mains comparatively limited.
7.3. Diagnostic Objectives
Diagnostic objectives define the functional scope of GNN-based systems. Fault detection identifies deviations from normal operation through anomaly scores, reconstruction losses, or temporal prediction errors. Fault classification assigns anomalies to predefined categories using relational feature aggregation and multi-sensor fusion [23]. Fault localization identifies affected components through
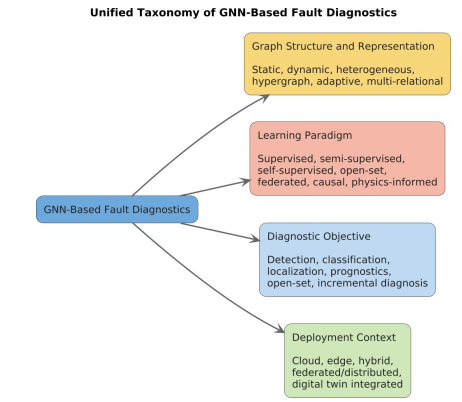
graph topology, message passing, node-level importance, or physics-informed relationships [26].
Prognostics and remaining useful life estimation model degradation trajectories by combining inter-sensor dependencies with temporal information [27]. Open-set and incremental approaches extend these tasks to unknown or evolving fault modes [32]. Hierarchical spatiotemporal net-works and adaptive graph aggregation have additionally been used for multiscale industrial-process diagnosis and weak-fault-feature detection [8, 21]. These objectives may be addressed independently or combined within integrated diagnostic and predictive-maintenance systems.
7.4. Deployment Context and System Architecture
Deployment context determines where graph construction, model training, inference, and updating are performed and therefore influences latency, computational demand, bandwidth use, and privacy. Cloud-centric architectures support computationally intensive training and large-scale graph processing but may introduce communication delay, bandwidth dependence, and exposure of operational data. Edge-oriented architectures perform inference near sensors or equipment, enabling rapid responses while requiring lightweight models, reduced memory use, efficient graph sampling, and optimized message passing.
Hybrid edge cloud architectures divide these responsibilities by performing time-sensitive detection locally and using cloud resources for model retraining, aggregation, or long term analysis. Federated and distributed architectures enable collaborative learning across facilities or network domains without transferring raw data to a central repository. Federated temporal GNNs, for example, have been evaluated for fault detection in operational telecommunication networks [33]. Such deployments nevertheless face communication overhead, non-independent and identically distributed data, heterogeneous computational resources, synchronization requirements, and changes in local graph topology. These operational trade-offs are examined in greater detail in the dedicated deployment-architecture section.
The multidimensional taxonomy clarifies relationships among graph representation, learning paradigm, diagnostic objective, and deployment context. It also reveals underexplored combinations, such as federated dynamic heterogeneous GNNs for open-set prognostics, physics-informed hypergraphs for causal fault localization, and explainable semi-supervised models for edge-deployed renewable-energy systems. These combinations represent prospective directions rather than established methodological categories. Overall, the taxonomy provides a basis for comparative evaluation and standardized reporting while emphasizing that graph design, learning efficiency, diagnostic granularity, and deployment feasibility must be considered jointly when developing reliable GNN-based fault-diagnostic systems.
8. Benchmark Datasets and Evaluation Protocols
The lack of standardized benchmarks and consistent evaluation protocols continues to limit reproducibility and direct comparison in Graph Neural Network (GNN)-based fault diagnostics. Existing studies frequently use domain-specific datasets that differ in fault scenarios, sensor con-figurations, sampling frequencies, operating conditions, preprocessing procedures, and graph-construction strategies. These differences complicate methodological com-parison and the assessment of generalization across systems. Shared benchmark suites, consistent preprocessing pipelines, and transparent reporting practices are therefore needed to support comparable evaluation and industrial validation [34, 35]. Benchmark design should also reflect the diversity of graph representations, learning paradigms, diagnostic objectives, and deployment settings identified in the unified taxonomy.
8.1. Widely Used and Emerging Benchmark Datasets
Several publicly available datasets are commonly used as benchmarks across fault-diagnostic domains, although differences in data structure and experimental protocols limit cross-study comparison. In rotating-machinery diagnostics, the Case Western Reserve University (CWRU) bear-ing dataset is widely used for evaluating fault-classification methods. It contains vibration measurements for inner-race, outer-race, and ball faults under different motor loads and operating speeds. Drive-end bearing measurements are available at sampling rates of 12 kHz and 48 kHz, while fan-end measurements are provided at 12 kHz [36]. Table 4 compares representative benchmark datasets used in GNN-based fault diagnostics according to their application domain, diagnostic objective, data characteristics, typical graph-construction strategy, commonly reported evaluation metrics, and principal limitations. The graph-construction column describes representative strategies adopted in the reviewed GNN literature rather than graph structures inherently supplied by every dataset. This distinction is important because most conventional fault-diagnostic datasets provide multivariate signals but do not prescribe a unique graph representation; consequently, differences in node definition, edge construction, preprocessing, and train–test partitioning can substantially affect the reported performance.
Other bearing datasets include the Paderborn University benchmark, which provides synchronously measured vibration and motor-current signals for healthy and dam-aged bearings under several operating conditions [37]. The Intelligent Maintenance Systems (IMS) bearing dataset contains run-to-failure bearing experiments and is commonly used for degradation analysis and prognostics [38, 39]. The XJTUSY dataset similarly provides complete run-to-failure vibration data from accelerated life tests involving multiple rolling-element bearings and operating conditions [40, 41]. These datasets support investigations of fault classification, domain adaptation, degradation modeling, and remaining useful life estimation.
Beyond vibration-based diagnosis, the MIMII dataset provides normal and anomalous sound recordings from industrial machines, including valves, pumps, fans, and slide rails, and supports acoustic anomaly-detection research [42]. The MIMII DUE extension introduces operational and environmental domain shifts for evaluating robustness under changing conditions [43]. For aircraft-engine prognostics, the NASA Commercial Modular Aero-Propulsion System Simulation (CMAPSS) dataset provides multiple run-to-failure time series generated under different operating conditions and fault modes [44, 45].
For industrial process monitoring, the Tennessee East-man Process (TEP) is a widely used simulated chemical process benchmark. The original process model defines 41 measured variables, 11 manipulated variables, and 21 pre-defined disturbance or fault conditions, supporting fault detection, classification, localization, and process-control studies [46]. Because modified and extended versions of the TEP dataset are also available, studies should identify the specific simulator version, selected variables, and fault configuration used.
In power system research, standard IEEE bus and feeder test systems provide predefined network topologies for power-flow analysis, fault localization, cascading-failure analysis, and renewable-integration studies. Power Graph extends this benchmark setting by providing GNN-oriented datasets for power flow, optimal power flow, and cascading-failure analysis. It supports both node-level and graph-level tasks and includes reference explanations for cascading-failure scenarios [35]. Safe Power Graph further introduces safety-oriented evaluation under conditions such as energy-price changes and transmission-line outages [47].
Additional resources include naval-propulsion simulation data, lithium-ion battery degradation datasets, and multimodal industrial datasets containing combinations of vibration, acoustic, thermal, electrical, and visual measure-ments. Despite the availability of these resources, repro-ducibility remains limited by inconsistent dataset versions, preprocessing choices, train–test splits, graph-construction procedures, and fault-severity definitions. Studies should therefore report sufficient information to reconstruct both the input signals and the graph representation supplied to the model.
8.2. Evaluation Metrics and Protocols
Evaluation metrics should be selected according to the diagnostic objective. Fault-classification studies commonly report accuracy, precision, recall, macro- and micro-averaged F1-scores, and confusion matrices. For imbal-anced fault distributions, balanced accuracy, macro-F1, area under the receiver operating characteristic curve (AUC–ROC), and area under the precision–recall curve provide more informative evaluation than accuracy alone.
Fault-detection studies may report false-alarm rate, missed-detection rate, detection delay, early-detection latency, and reconstruction or prediction error. Fault-localization performance can be evaluated using top-𝑘 accuracy, mean localization error, node-level precision and recall, mean reciprocal rank, or graph distance between predicted and actual fault locations. Prognostic studies typically use root mean squared error (RMSE), mean ab-solute error (MAE), prognostic-horizon measures, and task-specific scoring functions for remaining useful life estimation.
Evaluation under a single random train–test split provides
Table 4: Comparison of representative benchmark datasets used in GNN based fault diagnostics
| Dataset | Domain | Typical Diagnostic Task | Data Characteristics | Typical Graph Construction | Common Evaluation Metrics | Principal Limitations |
|---|---|---|---|---|---|---|
| CWRU [36] | Rotating machinery and bearing diagnosis | Fault detection and multiclass fault classification | Vibration signals representing healthy bearings and inner-race, outer-race, and ball faults under multiple motor loads and speeds; drive-end measurements at 12 and 48 kHz and fan-end measurements at 12 kHz | Nodes represent sensors, signal segments, frequency bands, or extracted features; edges are commonly defined using physical proximity, correlation, similarity, or learned adjacency | Accuracy, precision, recall, macro-F1, confusion matrix, AUC–ROC | Laboratory-induced faults; limited operating variability; possible data leakage from overlapping windows; results are highly sensitive to preprocessing and train–test splitting |
| Paderborn [37] | Rotating machinery and bearing diagnosis | Fault classification, domain adaptation, and condition-transfer evaluation | Synchronous vibration and motor-current measurements from healthy and damaged bearings under several operating conditions; includes artificial and naturally damaged bearings | Multimodal sensor or feature nodes connected through physical relationships, statistical dependence, feature similarity, or learned cross-modal edges | Accuracy, macro-F1, balanced accuracy, precision, recall, confusion matrix | Variation in experimental subsets and fault groupings; heterogeneous operating conditions complicate direct comparison; preprocessing and split protocols are not standardized |
| IMS [38, 39] | Bearing degradation and prognostics | Anomaly detection, degradation-stage identification, and remaining useful life estimation | Run-to-failure vibration measurements collected from bearings operated until failure | Nodes represent bearings, sensors, temporal windows, or degradation states; edges encode sensor relationships, temporal continuity, or similarity between operating states | RMSE, MAE, prognostic score, detection delay, early-warning time | Small number of run-to-failure trajectories; limited diversity of operating conditions; uncertain failure-onset labeling; restricted support for cross-domain generalization |
| XJTU-SY [40, 41] | Bearing degradation and accelerated-life testing | Health-state assessment, degradation modeling, and remaining useful life prediction | Complete run-to-failure vibration signals from multiple rolling-element bearings under several operating conditions | Sensor or temporal-window nodes connected using temporal adjacency, feature similarity, correlation, or dynamically learned degradation relationships | RMSE, MAE, MAPE, prognostic score, monotonicity, trendability | Accelerated laboratory degradation may not fully represent field failures; relatively limited operating regimes; model performance depends strongly on health-index construction and failure-threshold definition |
| MIMII / MIMII DUE [42, 43] | Industrial acoustic monitoring | Unsupervised or semi-supervised acoustic anomaly detection and domain-shift evaluation | Normal and anomalous recordings from valves, pumps, fans, and slide rails; MIMII DUE introduces changes in operating and environmental conditions | Nodes represent machines, microphones, time–frequency patches, or acoustic embeddings; edges are based on spatial relationships, spectral similarity, temporal association, or learned adjacency | AUC–ROC, partial AUC, F1-score, precision, recall, false-positive rate | Anomalies are collected under controlled conditions; strong sensitivity to background noise and domain shift; graph definitions vary substantially across studies |
| NASA C-MAPSS [44, 45] | Aircraft-engine prognostics | Degradation modeling and remaining useful life estimation | Multivariate run-to-failure time series generated for turbofan engines under different operating conditions and fault modes | Nodes represent sensors, engine subsystems, temporal segments, or operating variables; edges are derived from physical knowledge, correlation, mutual information, attention, or learned adjacency | RMSE, MAE, NASA scoring function, MAPE, prediction-horizon error | Simulation-based data; sensor and subsystem relationships are not explicitly provided; operating-condition normalization and RUL-label construction differ across studies |
| TEP [46] | Chemical-process monitoring | Fault detection, classification, localization, and process anomaly diagnosis | Simulated chemical process with 41 measured variables, 11 manipulated variables, and 21 predefined disturbances or fault conditions | Nodes correspond to process variables, sensors, control loops, or units; edges are constructed from process topology, causal relations, correlation, mutual information, or learned dependency matrices | Accuracy, macro-F1, detection rate, false-alarm rate, detection delay, localization accuracy | Multiple simulator versions and modified fault sets are used; some faults are difficult to distinguish; controlled simulation does not fully capture industrial uncertainty and maintenance effects |
| PowerGraph [35] | Power-system graph learning | Power flow, optimal power flow, cascading-failure analysis, node-level and graph-level prediction, and explanation evaluation | GNN-oriented power-system benchmark containing graph-structured tasks and reference explanations for cascading-failure scenarios | Native electrical topology is used directly; nodes represent buses or power-system components and edges represent electrical connections with associated attributes | MAE, RMSE, classification accuracy, F1-score, explanation fidelity, sparsity, and localization agreement | Primarily simulation-based; performance may depend on network size and operating scenarios; limited evidence of transfer to real utility data and evolving topologies |
| Safe PowerGraph [47] | Safety-oriented power-system analysis | Robustness, safety assessment, and fault or disturbance prediction under operational changes | Graph-structured power-system scenarios incorporating disturbances such as energy-price variation and transmission-line outages | Physical grid topology with node and edge attributes reflecting system states, operational conditions, and disturbance scenarios | Accuracy, F1-score, MAE, RMSE, calibration error, robustness degradation, and safety-violation rate | Emerging benchmark with limited adoption; scenario coverage may not represent all cyber-physical threats; comparability with conventional fault-diagnosis datasets remains limited |
limited evidence of operational reliability. Bench-marking studies therefore recommend consistent data splits, multiple random seeds, common baseline implementations, and comparable model-training procedures [34]. Robustness protocols should additionally examine signal noise, missing sensors, topology perturbations, operating-condition changes, low-sample settings, class imbalance, and open-set faults. Cross-condition, cross-machine, and cross-domain evaluations can provide further evidence of generalization.
Open-set studies should report known-class performance together with unknown-fault rejection accuracy, false-unknown rate, and threshold-dependent novelty-detection metrics. For graph models intended for dynamic environments, evaluation should also quantify per-formance degradation under node removal, edge perturbation, topology reconfiguration, and temporal distribution shift. Safety-oriented power-system benchmarks similarly indicate the importance of testing GNNs under line outages and changing operating conditions rather than relying only on nominal test cases [47].
Uncertainty and explainability evaluations are also relevant for safety-critical applications. Uncertainty assessment may include expected calibration error, negative log-likelihood, Brier score, prediction intervals, or selective-risk analysis. Explainability assessment may consider fidelity, sparsity, stability, localization agreement, prototype consistency, and agreement with physical or causal knowledge. However, explanation compactness or stability alone does not establish physical validity, and explanations should therefore be evaluated against domain knowledge or known fault-propagation structures where possible.
8.3. Challenges in Benchmark Standardization
Benchmark standardization is constrained by several factors. Proprietary industrial datasets often cannot be released because of confidentiality, security, or commercial restrictions. Public datasets frequently contain controlled or artificially induced fault conditions that do not fully represent gradual degradation, simultaneous faults, maintenance interventions, sensor replacement, or changing operational regimes.
Preprocessing also varies substantially across studies. Differences in normalization, filtering, segmentation, window length, overlap, feature extraction, augmentation, and graph generation can affect reported performance. In addition, splitting overlapping windows from the same operating sequence across training and test sets can introduce information leakage and produce overly optimistic results. Graph-specific design choices introduce further variation. Adjacency matrices may be derived from physical topology, correlation, distance, mutual information, learned relationships, or combinations of these sources. Studies also differ in their treatment of edge direction, edge weights, temporal updates, missing nodes, and topology changes. Without consistent reporting, it is difficult to determine whether an observed improvement results from the GNN architecture, graph construction, preprocessing, or the selected data split.
Dynamic topologies, temporal dependencies, multi-modal inputs, open-set faults, uncertainty, and adversarial robustness remain insufficiently represented in many current benchmarks. PowerGraph and SafePowerGraph illustrate recent efforts to extend benchmark design beyond conventional prediction accuracy toward graph-level tasks, explanations, operational disturbances, and safety-oriented evaluation [35, 47].
8.4. Toward Standardized Evaluation Frameworks
Future benchmark development should emphasize shared repositories, documented preprocessing pipelines, reference graph-construction strategies, reproducible base-line implementations, and predefined evaluation splits. General GNN benchmarking work has shown the value of common experimental protocols, standardized model implementations, and repeated evaluation across datasets [34]. Domain-specific resources such as Power Graph simi-larly demonstrate how multiple power-system tasks and explainability analyses can be supported within a common graph-learning framework [35].
Standardized fault-diagnostic benchmarks should include static and dynamic graph variants, multiple operating conditions, class-imbalance scenarios, missing-sensor experiments, open-set evaluation, and cross-domain transfer. Robustness tests should cover signal noise, adversarial perturbations, sensor failures, topology changes, and communication constraints. Benchmark suites should also report computational measures, including training time, inference latency, memory consumption, parameter count, communication cost, and energy consumption where de-ployment efficiency is relevant.
Transparent reporting should specify dataset versions, sensor channels, sampling rates, windowing procedures, graph definitions, train–validation–test splits, random seeds, hyperparameter-selection procedures, and hard-ware configurations. Shared codebases and reproducible experiment configurations would support more reliable comparisons and provide clearer evidence regarding the suitability of GNN-based diagnostic methods for operational deployment.
9. Deployment Architectures for GNN-Based Fault Diagnostics
Although research has improved the predictive performance and interpretability of Graph Neural Network (GNN)-based fault-diagnostic models, their deployment in cyber-physical and industrial systems requires consider-ation of latency, privacy, scalability, communication over-head, computational resources, and integration with existing monitoring infrastructure. This section examines five deployment paradigms: cloud-centric, edge-oriented, hybrid edge–cloud, federated or distributed, and digital-twin-integrated architectures. These deployment contexts complement the unified taxonomy by showing how sys-tem architecture influences graph construction, learning strategy, inference location, and diagnostic response.
9.1. Cloud-Centric Deployment
Cloud-centric architectures are suitable for computationally intensive activities such as initial model training, large-scale graph processing, historical-data analysis, peri-odic model updating, and aggregation of data from multi-ple facilities. Centralized platforms provide the computing and storage capacity required for complex graph models and may also support simulation-based validation and digital-twin services. However, cloud-based inference re-quires operational data or intermediate representations to be transmitted over communication networks, which may introduce latency, bandwidth demands, dependence on network availability, and privacy concerns. Consequently, cloud deployment is generally more appropriate for offline analysis, global model management, and long-term optimization than for time-critical local fault response in safety-critical environments.
9.2. Edge Deployment for Real-Time Diagnostics
Edge-oriented deployment performs GNN inference close to the monitored equipment through embedded processors, industrial gateways, local servers, or other edge devices, thereby reducing communication dependence and supporting faster diagnostic responses. The memory, computational, and energy requirements of GNN inference re-main important constraints on resource-limited hardware, motivating methods such as graph sampling, model pruning, quantization, knowledge distillation, workload partitioning, and hardware-aware architecture search. GNN-specific quantization techniques have been developed to reduce inference complexity and memory consumption while limiting accuracy loss [48], while device–edge co inference frameworks consider latency, memory limits, and communication cost during model design and deployment [49]. Physics informed GNNs provide an additional mechanism for incorporating operational constraints into graph learning, as illustrated by GraPhyR, which integrates net-work connectivity and physical constraints for dynamic power-system reconfiguration [50]. Despite these developments, edge-deployed models must still address changing graph structures, sensor failures, model drift, distribution shifts, and potential accuracy degradation caused by compression.
9.3. Hybrid Edge–Cloud Architectures
Hybrid edge cloud architectures divide diagnostic processing between local and centralized resources by allowing edge nodes to perform data filtering, graph construction, anomaly detection, or preliminary fault classification, while cloud services handle model retraining, global aggregation, long-term analysis, and computationally intensive verification. Instead of transmitting complete sensor streams, edge devices may send compressed features, graph embeddings, anomaly scores, or selected subgraphs to reduce communication volume while retaining access to centralized computing resources. Research on device–edge GNN co-inference indicates that workload partitioning must jointly consider graph structure, device capacity, and communication cost because conventional layer-based partitioning may not be efficient for graph operations [49]. Hybrid deployment therefore offers a trade-off between local responsiveness and centralized analytical capacity, but its effectiveness depends on workload allocation, synchronization, communication reliability, fault tolerance, and the frequency and security of model updates.
9.4. Federated and Distributed Deployment
Federated learning enables multiple sites to train local GNN models without transferring raw operational data to a central repository, with a coordinating server aggregating model parameters or updates instead. This approach can support privacy, data-sovereignty, and regulatory requirements when industrial facilities or network operators cannot share complete sensor records. Bourgerie and Zanouda proposed a bi-level federated temporal GNN for anomaly detection and diagnosis in telecommunication networks, representing both interactions among radio-access-network nodes and software-execution relationships within individual nodes while reducing raw-data sharing and communication costs [33]. Nevertheless, federated GNN deployment remains affected by non-independent and identically distributed data, graph heterogeneity, communication overhead, partial client participation, convergence instability, and vulnerability to unreliable or malicious participants. These limitations motivate further research on communication-efficient training, update validation, secure aggregation, and robust learning across heterogeneous graph structures.
9.5. Integration with Digital Twins and Real-Time Monitoring Pipelines
Digital twins provide virtual representations of physical systems that are continuously or periodically updated using operational data and can support simulation, synthetic-data generation, scenario analysis, predictive maintenance, and comparison between predicted and observed behavior. GNNs are well suited to digital-twin environments because physical, communication, and functional relationships can be represented as graph structures. Isah integrated graph Fourier transformation with a message-passing neural network for failure classification in real and simulated network-digital-twin environments, illustrating how graph learning can represent dependencies among network components and support failure analysis [51]. However, digital-twin-supported diagnosis requires reliable synchronization between physical and virtual systems, and its effectiveness may be reduced by delayed sensor updates, simulation-to-reality differences, model drift, in-complete physical models, and unreported uncertainty. Digital-twin pipelines should therefore document synchro-nization frequency, graph-update procedures, uncertainty propagation, and validation against physical-system obser-vations.
9.6. Deployment Trade-Offs and Future Directions
Each deployment architecture involves distinct trade-offs. Cloud-centric systems provide substantial computational capacity but depend on network connectivity and centralized data management; edge systems support local inference but operate under tighter memory, energy, and processing constraints; hybrid architectures distribute these responsibilities but require synchronization and workload orchestration; and federated systems reduce centralized raw-data collection but introduce communication, opti-mization, and security challenges. Future research should evaluate deployment architectures using both predictive and operational measures, including inference latency, communication volume, memory consumption, model size, energy use, update frequency, fault-response time, and performance under topology or distribution shifts. Deployment-aware research should also examine physics-informed lightweight GNNs, communication-efficient federated learning, uncertainty-aware inference, adaptive edge processing, and reproducible edge–cloud pipelines to support the transition from experimental models to operational fault-diagnostic systems.
10. Limitations
Despite progress in Graph Neural Networks (GNNs) for fault diagnostics, several methodological and operational limitations continue to affect generalization, scalability, interpretability, and deployment in cyber-physical and industrial systems. Current research identifies recurring concerns related to graph-construction uncertainty, limited and imbalanced fault data, computational requirements, explanation validity, and robustness under domain shifts. Addressing these limitations is necessary for translating GNN-based diagnostic methods from controlled experimental settings to operational applications.
10.1. Graph Construction and Topology Uncertainty
Graph construction remains a central limitation because many approaches depend on predefined physical topologies, correlation-derived edges, or learned graph structures that may be incomplete, noisy, or subject to change because of system reconfiguration, sensor failures, maintenance actions, or the integration of distributed energy resources. Inaccurate or outdated graph representations can reduce diagnostic performance by misrepresenting intercomponent dependencies and fault-propagation pathways. Although adaptive graph learning can account for changing relationships, it may introduce additional computational cost and training instability. Photovoltaic-integrated distribution networks present further difficulties because variable renewable generation, sparse measurements, changing fault impedance, and low observation rates can produce weak fault signatures and uncertain graph relationships [25]. Similarly, rolling-bearing diagnosis under nonstationary operating conditions requires spatiotemporal graph representations that can account for changes in speed, load, and sensor relationships [29].
10.2. Data Scarcity, Class Imbalance, and Label Limitations
Industrial fault datasets are often limited, highly imbalanced, and dominated by samples representing normal operation, while rare, compound, or previously unseen faults remain underrepresented. Semi-supervised, self-supervised, few-shot, and open-set GNN approaches partially address limited labeling, but their effectiveness varies across datasets and application domains. Synthetic fault generation may increase sample availability, although simulated data may not reproduce realistic degradation processes, component interactions, or fault-propagation patterns [52]. Severe class imbalance can also bias decision boundaries toward normal or majority fault categories and reduce node- or graph-level performance for rare events. Mechanical systems and power networks continue to face limitations associated with small training sets and imbalanced labels, while process-industry applications often depend on high-quality labeled data and sufficient domain knowledge for model development and validation [21].
10.3. Scalability and Computational Efficiency
Message passing over large or densely connected graphs can require substantial memory, computation, and communication, particularly in large power grids, distributed Industrial Internet of Things environments, and applications involving high-dimensional multisource sensor streams [21]. Increasing the number of nodes, edges, temporal windows, or graph layers can also increase inference latency and make deployment on resource-constrained devices more difficult. Lightweight architectures, neighborhood sampling, graph sparsification, pruning, quantization, and distributed processing can reduce computational requirements, but they may also remove diagnostically relevant relationships or reduce predictive accuracy. Evaluations in distribution-grid settings further show that topology changes can reduce model performance, indicating that computational efficiency alone does not ensure robust-ness to structural variation [11]. Consequently, scalability should be assessed together with latency, memory use, communication cost, graph size, and performance under topology changes.
10.4. Interpretability, Trustworthiness, and Causal Validity
Explainable GNN methods, including attribution techniques, prototype-based reasoning, and subgraph explanations, can provide information about the nodes, edges, or features associated with a diagnostic decision. However, many explanations are generated after prediction and may not reflect causal mechanisms or physically meaningful fault pathways. In safety-critical systems, visually plausible but causally invalid explanations can reduce confidence in diagnostic outputs and may reinforce spurious correlations or predictive shortcuts. Reviews of explainable graph learning note that different post-hoc methods can produce multiple plausible explanations for the same prediction, even when some explanations conflict with domain knowledge [6]. Causal intervention based GNNs seek to reduce reliance on confounding relationships, but they introduce challenges involving causal-graph specification, variable coupling, training stability, and computational complexity [17]. Self-interpretable models may improve transparency, although restricting the model to interpretable structures can reduce representational flexibility in complex process-fault scenarios.
10.5. Generalization, Domain Shift, and Robustness
GNN-based diagnostic models may not generalize reliably across changes in operating conditions, system topology, sensor configuration, noise level, or fault characteristics. Models trained on one machine, facility, or network configuration may experience performance degradation when ap-plied to another domain because both feature distributions and graph structures can change. Domain adaptation and transfer learning for graph-based fault diagnosis remain less developed than conventional supervised approaches, particularly for evolving power grids and systems containing distributed energy resources. Attention-based variants such as RGATv2 have reported lower F1-score degradation under selected topology changes than the evaluated baselines; however, such results remain dependent on the dataset, perturbation protocol, and comparison models and should not be interpreted as evidence of general robustness [52]. Previously unseen topologies, noisy observations, out-of-distribution faults, and simultaneous distribution shifts therefore remain open concerns, motivating further research on causal representation learning, uncertainty estimation, domain adaptation, and evaluation across multiple operational settings [22].
Improving robustness may introduce trade-offs with predictive performance and deployment efficiency. Robust aggregation, adversarial training, uncertainty estimation, and dynamic graph adaptation can increase resilience to noisy observations, topology changes, and distribution shifts, but may reduce performance under clean or familiar operating conditions when regularization suppresses informative task-specific patterns. These mechanisms can also increase model complexity, training time, inference latency, and memory consumption, thereby limiting their suitability for real-time or edge-constrained diagnostic systems [22]. Attention-based and Graph–Transformer architectures can improve long-range dependency modeling and adaptation to graph variation, but their computational cost generally increases with graph size. Similarly, federated and privacy-preserving approaches reduce raw-data exposure while introducing communication overhead, convergence instability, and possible performance degradation under heterogeneous local data [53]. Robustness should therefore be evaluated jointly with clean-condition accuracy, calibration, latency, computational requirements, and resource consumption rather than treated as an isolated objective.
Collectively, these limitations indicate the need for diagnostic frameworks that combine physics informed graph construction, causal reasoning, computationally efficient architectures, uncertainty estimation, and evaluation under realistic operating constraints. Future work should place greater emphasis on graph-quality assessment, cross-domain validation, rare-fault evaluation, computational reporting, and physically meaningful explanations to support reliable deployment of GNN-based fault-diagnostic systems.
11. Failure Modes of GNN-Based Fault Diagnostics
Although Graph Neural Network (GNN)-based fault-diagnostic systems often report strong performance on controlled benchmarks, their operation in cyber-physical and industrial environments may be affected by failure modes that are distinct from the methodological limitations discussed in Section 10. These failures can appear as incorrect diagnoses, delayed responses, inappropriate fault isolation, or unsafe downstream control decisions. Studies of dynamic topologies, noisy measurements, open-set conditions, adversarial manipulation, and changing operating environments indicate that benchmark performance alone does not establish operational reliability. Understanding these failure mechanisms is therefore important for designing GNN-based diagnostic systems for industrial, power, and transportation applications.
11.1. Cascading Misdiagnosis and Error Propagation
Message passing enables GNNs to aggregate information across related system components, but it can also propagate errors originating from sensor noise, calibration drift, missing measurements, or biased predictions. A local error may influence neighboring node representations across multiple message-passing layers and lead to incorrect estimates of fault location, severity, or root cause [11, 54]. In power distribution networks, an erroneous node classification may affect downstream fault-isolation decisions, potentially causing unnecessary feeder disconnection or delayed restoration. Similar propagation effects in industrial processes may produce incorrect root-cause attribution and inefficient maintenance actions. These risks motivate robust aggregation, uncertainty-aware message passing, confidence-based propagation control, and mechanisms for containing unreliable node information [10, 54, 55].
11.2. Topology Drift and Graph Mismatch
Many GNN-based diagnostic models are developed using fixed or slowly changing graph structures, whereas operational systems may undergo topology changes because of maintenance, component outages, line switching, distributed-energy-resource integration, equipment replacement, or changing IIoT connectivity. When the assumed graph differs from the actual system structure, message passing may occur across missing, outdated, or spurious edges, reducing fault-detection and localization performance. Evaluations on distribution-network topologies indicate that conventional GCN models can experience substantial performance degradation under structural perturbations, while relation-aware attention models may be more resistant under selected experimental conditions [11]. However, the degree of robustness depends on the perturbation type, dataset, and graph-construction procedure. Persistent graph mismatch is particularly relevant in renewable-integrated grids and reconfigurable manufac-turing systems, where adaptive graph reconstruction and online topology estimation may be required to maintain diagnostic accuracy [11].
11.3. Noise Amplification and Sensor-Fault Propagation
Graph aggregation may spread localized measurement noise or corrupted sensor values to neighboring node embeddings when robust filtering, reliability weighting, or outlier rejection is absent [10, 20, 56]. Repeated propagation can increase false alarms, distort fault localization, or suppress weak fault signatures, particularly around highly connected nodes and in densely linked multisensor graphs. The effect depends on graph density, message-passing depth, aggregation strategy, and the location of the corrupted sensor. Physics-informed constraints, adaptive edge weighting, denoising modules, and sensor-confidence estimates can reduce the influence of unreliable measure-ments, although these techniques do not eliminate the risk under severe or coordinated corruption [56, 57].
11.4. Open-Set Fault Misclassification and Novelty-Rejection Failure
Closed set GNN classifiers assign each input to one of the fault categories observed during training, which may cause previously unseen or out-of-distribution faults to be mapped to known classes with high confidence [57, 58]. In marine machinery, wind-energy systems, and industrial processes, novel degradation patterns, compound faults, or rare operating conditions may therefore produce incorrect diagnoses and inappropriate maintenance responses. Semi-supervised open-set GNNs, distance-based rejection, uncertainty thresholds, and novelty-detection mechanisms can improve unknown-fault identification. However, threshold selection remains sensitive to class imbalance, calibration quality, and overlap between weak known faults and unknown conditions. A threshold that is too permissive may accept novel faults as known, whereas an overly restrictive threshold may reject difficult but valid known-class samples.
11.5. Over smoothing, Overs quashing, and Dilution of Fault Signatures
Increasing message passing depth can cause node representations to become progressively similar, a phenomenon commonly described as over smoothing. This loss of representational distinction may obscure weak or incipient fault signatures that depend on subtle differences among neighboring components [59, 60]. The problem is particularly relevant to large graphs and prognostic settings in which early-stage defects, such as minor bearing damage or gradual insulation degradation, generate only small deviations from normal operating behavior. A related limitation is oversquashing, which occurs when information from a rapidly expanding number of distant nodes must be com-pressed into fixed-dimensional node representations [61]. In cyber-physical systems with long-range dependencies or bottlenecked graph structures, this compression may prevent weak but operationally important fault information from propagating effectively across multiple graph hops. Consequently, faults originating in one subsystem may exert insufficient influence on distant but functionally connected components, reducing the model’s ability to identify cascading failures, distributed anomalies, and long-range fault-propagation patterns.
Potential mitigation strategies include residual and skip connections, jumping-knowledge mechanisms, attention normalization, graph rewiring, positional or structural encodings, hierarchical pooling, and multiscale architectures. Residual connections and jumping-knowledge mechanisms preserve information from earlier layers, while graph rewiring and positional encodings improve com-munication between structurally distant nodes. Hierarchi-cal pooling and multiscale representations support information aggregation across subsystem and system levels. Graph–Transformer architectures may further alleviate oversquashing by enabling direct interactions between distant nodes, although their computational and memory requirements can restrict their suitability for large-scale or edge-constrained deployments. The effectiveness of these strategies depends on graph topology, message-passing depth, representation dimensionality, and the spatial dis-tribution of fault-related features. Therefore, GNN-based fault-diagnostic systems must balance receptive-field expan-sion with the preservation of local distinctions, long-range information flow, and computational feasibility.
11.6. Adversarial Attacks and Data-Poisoning Vulnerabilities
Networked GNN-based diagnostic systems may be ex-posed to adversarial manipulation of node features, sensor measurements, graph edges, or training data. Structure poisoning, targeted feature perturbation, and backdoor attacks can produce false negatives that conceal faults or false positives that trigger unnecessary interventions [62, 63]. Such
risks are particularly relevant in power, transportation, and industrial control systems because diagnostic outputs may influence automated control or maintenance decisions [64]. Proposed defenses include adversarial training, certified robustness, causal representation learning, anomaly filtering, uncertainty-based rejection, and validation of graph updates. However, practical defenses remain limited by computational cost, incomplete threat models, adaptive attackers, and the difficulty of distinguishing malicious manipulation from genuine changes in system behavior.
11.7. Concept Drift and Long-Term Model Obsolescence
Equipment aging, seasonal load variation, component replacement, maintenance activities, changing production regimes, and gradual wear can alter the relationship between input measurements and fault labels over time. A GNN trained on historical data may therefore experience reduced accuracy, increased false-alarm rates, and weaker calibration as operating conditions change. Static models are especially vulnerable when feature distributions and graph relationships evolve simultaneously. Continual learning, domain adaptation, drift detection, periodic recalibration, and federated model updating have been proposed to support long-term adaptation [10, 65]. These approaches must nevertheless control catastrophic forget-ting, prevent erroneous updates from contaminating the model, and distinguish persistent concept drift from short-term disturbances.
These failure modes show that performance on static benchmarks does not by itself establish operational dependability. Error propagation, graph mismatch, noise amplification, open-set misclassification, oversmoothing, adversarial manipulation, and concept drift require complementary mitigation strategies, including adaptive graph learning, uncertainty estimation, robust aggregation, continual adaptation, open-set evaluation, and security testing. Addressing these risks requires coordination among graph learning, control engineering, cybersecurity, reliability analysis, and human oversight when GNN-based diagnostic models are incorporated into safety-critical cyber-physical systems.
12. Research Trends and Statistical Analysis
Research on GNN based fault diagnosis has expanded rapidly in publication volume, application scope, and architectural diversity [3, 7, 22]. Since 2020, increasing attention has been directed toward spatiotemporal, attention-based, adaptive, causal, and hybrid models designed for interconnected and dynamically changing systems [6, 17]. However, quantitative synthesis remains constrained by differences in datasets, graph construction, preprocessing, fault definitions, operating conditions, and evaluation protocols. This section therefore examines publication trends, representative performance evidence, architecture-level trade-offs, and the limitations affecting cross-study statistical comparison.
12.1. Publication Trends and Bibliometric Insights
A bibliometric analysis of 1,495 Web of Science publications from 1998 to 2024 reported an annual growth rate of approximately 13.58% in AI-supported fault-diagnosis
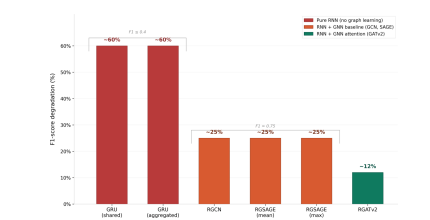
research, with China and the United States accounting for 35.34% and 18.27% of the analyzed output, respectively [3]. The acceleration observed after 2020 coincides with the expansion of Industrial Internet of Things infrastructures, predictive-maintenance applications, renewable-energy systems, and sensor-rich cyber-physical environments. Research themes have progressively shifted from conventional bearing and gearbox diagnosis toward distributed monitoring, dynamic graph modeling, knowledge-enhanced diagnosis, and system-level predictive maintenance.
12.2. Methodological Evolution and Performance Advances
Earlier studies primarily employed graph convolutional networks for static graph structures and vibration-based fault classification, whereas recent research increasingly emphasizes spatiotemporal, attention-based, adaptive, causal, and hybrid architectures [14, 22]. Representative evidence indicates that graph-based relational modeling can improve robustness under structural variation, although reported benefits remain dependent on the experimental setting, graph-construction strategy, and comparison baselines.
On the IEEE 123-node distribution network, a recur-rent GRU model exhibited F1-score degradation approaching 60% when evaluated under a substantially altered PMU configuration. RNN+GNN pipelines using GCN and GraphSAGE reduced this degradation to approximately 25%, while the attention-based RGATv2 architecture lim-ited it to approximately 12% [11]. Figure 6 illustrates this comparison and indicates the potential value of topology-aware attention under the evaluated conditions. These results should not, however, be interpreted as evidence of universal robustness because they are specific to the IEEE 123-node network, the selected PMU configurations, and the applied perturbation protocol.
Other reported advances include causal and knowledge enhanced GNNs for reducing sensitivity to spurious relationships, few-shot and adaptive methods for diagnosis under limited labels, and multiscale architectures for weak fault signatures. For example, a few-shot graph-learning framework reported an accuracy of 94.32% for wind-turbine current-signal diagnosis under its specified experimental
conditions [30]. Such findings indicate progress in robustness, data efficiency, and adaptive diagnosis, but they should not be generalized across incompatible datasets, operating regimes, or evaluation protocols.
12.3. Comparative Analysis of Representative GNN-Based Methods
Table 5 compares representative GNN-based fault-diagnostic studies across architectures, application domains, datasets, graph-construction strategies, diagnostic objectives, reported results, computational information, strengths, and limitations. The reported values correspond to the original experimental settings and are not directly comparable because the studies differ in preprocessing, fault classes, graph definitions, operating conditions, train–test procedures, and evaluation metrics. Computational information is included when explicitly reported; other-wise, it is marked as not reported (NR). This distinction is important because high predictive performance does not necessarily imply suitability for real-time, large-scale, or resource-constrained deployment.
The comparison indicates that architecture selection involves trade-offs rather than a universally superior model. Conventional GCNs provide relatively efficient neighbor-hood aggregation and are suitable when graph structure is stable and well defined, but they remain sensitive to graph-construction errors and may dilute weak local dis-tinctions as depth increases. Graph Attention Networks can assign different importance to neighboring nodes and may improve robustness when relationships vary in relevance; however, attention computation introduces additional parameters, memory demand, and inference cost.
Spatiotemporal GNNs combine structural and temporal modeling and are therefore appropriate for sensor streams, evolving degradation, and time-dependent fault propagation. Their computational requirements increase with graph size, sequence length, temporal-window size, and message-passing depth, which can restrict real-time deployment. Hypergraph GNNs represent higher-order relationships among groups of components and may capture interactions that pairwise graphs cannot express, but hyperedge
Table 5: Comparative analysis of representative GNN-based fault diagnostic methods. Results correspond to the original experimental settings and should not be interpreted as directly comparable across heterogeneous datasets and protocols
| Study | Architecture | Domain | Dataset / System | Graph Construction | Task | Metrics and Reported Result | Strengths | Limitations |
|---|---|---|---|---|---|---|---|---|
| Study [23] | GCN | Industrial process diagnosis | Study-specific measurement dataset | Prior engineering knowledge and measurement relationships | Classification | Reported improved diagnostic performance over conventional baselines | Integrates relational measurements with engineering knowledge | Sensitive to graph-prior quality; limited cross-domain validation |
| Study [24] | Graph-based multivariate model | Power-transformer diagnosis | Dissolved-gas-analysis data | Relationships among dissolved-gas variables | Classification | Reported stronger performance than selected conventional and machine-learning baselines | Models dependencies among multiple dissolved-gas measurements | Study-specific evaluation; limited scalability and deployment reporting |
| Study [26] | Physics-informed GNN | Power distribution systems | IEEE 123-node and 37-node feeders | Physical grid topology and similarity among labeled and unlabeled samples | Localization | Reported improved localization under limited labels, load variation, and topology changes; the two-stage approach improved accuracy by up to approximately 6% over supervised training | Supports sparse observations, limited labels, and structural variation through physical priors | Depends on grid-model accuracy and simulated operating assumptions |
| Study [27] | Hierarchical attention GCN with BiLSTM | Aero-engine prognostics | Multisensor degradation dataset | Sensor-dependency graph with hierarchical attention | RUL estimation | Reported lower prediction error than selected comparison models under the original protocol | Combines intersensor dependencies with temporal degradation modeling | Graph construction and performance may be sensitive to operating-condition changes |
| Study [11] | GRU+GCN, GraphSAGE, and RGATv2 | Power distribution systems | IEEE 123-node network; 11-PMU training and 25-PMU testing | Power-network topology with message passing and relational attention | Diagnosis under topology change | GRU degradation approached 60%; GCN and GraphSAGE pipelines degraded by approximately 25%; RGATv2 degradation was approximately 12% | Provides explicit evaluation under substantial topology and sensor variation | Results are specific to one network, PMU configuration, and perturbation protocol |
| Few-shot graph framework [30] | Few-shot adaptive GNN | Wind-turbine diagnosis | Current-signal dataset | Graph relationships among signal-derived features | Classification with limited labels | Reported accuracy of 94.32% under the specified experimental setting | Addresses limited labeled data and supports adaptive diagnosis | Dataset- and protocol-specific result; latency and scalability not established |
| DACDFE-GNN [8] | Dynamic multiscale GNN | Photovoltaic-integrated power systems | Study-specific photovoltaic fault dataset | Adaptive edge weighting with physical and topological representations | Weak-fault diagnosis | Reported stronger weak-fault recognition than selected baselines under noise and low-sampling conditions | Captures weak fault signatures and changing graph relationships | Dynamic updating may increase complexity and sensitivity to transient noise |
| Multi-metric fusion hypergraph network [16] | Hypergraph GNN | Rotating machinery | Study-specific multisource machinery dataset | Hyperedges based on instance, distributional, and spatiotemporal relationships | Classification | Reported improved classification over selected graph and deep-learning baselines | Represents higher-order relationships beyond pairwise connections | Hyperedge construction and scalability remain dataset-dependent |
construction is often application-specific and can increase memory use and propagation complexity. Graph–Transformer and hybrid architectures improve long-range dependency modeling and reduce reliance on local message passing, although their scalability depends on attention sparsification, graph size, model depth, and available computational resources. Architecture comparisons should therefore jointly consider predictive accuracy, robustness, latency, memory consumption, graph-construction cost, interpretability, and suitability for the intended deployment environment [14, 22].
12.4. Performance and Computational Comparison
Performance-based comparison across GNN-based fault-diagnostic studies is complicated by differences in datasets, graph-construction strategies, diagnostic objectives, train–test partitions, hardware platforms, and evaluation metrics. Consequently, reported values should not be interpreted as a direct ranking of architectures. Neverthe-less, the available evidence permits a structured compar-ison of predictive performance, computational efficiency, latency, scalability, and resource requirements across major GNN categories. Table 6 summarizes these characteristics using representative results reported in the reviewed literature. Values that were not provided by the original studies are marked as not reported (NR).
The comparison shows that predictive measures are reported more consistently than operational and computational measures. Accuracy, F1-score, localization accuracy, and regression error are commonly provided, whereas inference latency, parameter count, floating-point operations, memory consumption, training time, and energy use are frequently omitted. Scalability is therefore often demonstrated indirectly through evaluation on larger graph sizes, multiple systems, changing sensor configurations, topology variation, cross-domain transfer, or robustness under limited labels and noise.
Conventional GCNs generally offer the lowest computational burden but remain sensitive to graph construction and depth-related degradation. Attention-based and dynamic models provide stronger adaptability and robustness, although their memory and runtime requirements increase with graph density and attention complexity. Spatiotemporal models improve dynamic fault representation but introduce additional temporal-processing cost. Hyper-graph and Graph–Transformer architectures provide richer higher-order and long-range dependency modeling, but their computational requirements may restrict deployment on edge devices. Physics-informed models improve structural consistency and label efficiency, whereas federated models reduce data-centralization requirements at the cost of communication overhead and slower convergence. These
Table 6: Performance and computational comparison of representative GNN architecture categories used for fault diagnostics. NR denotes information not reported in the underlying studies. Results are not directly comparable because they were obtained using different datasets, tasks, graph structures, and experimental protocols
| Architecture Category | Reported Predictive Performance | Efficiency and Latency | Computational Cost | Scalability and Robustness Evidence | Principal Trade-off |
|---|---|---|---|---|---|
| Conventional GCN | Representative studies report improved classification and localization over conventional machine-learning and deep-learning baselines; in topology-change experiments, GCN-based pipelines showed approximately 25% degradation compared with approximately 60% for recurrent-only baselines [11, 23]. | Sparse neighborhood aggregation is generally efficient, but exact inference latency is frequently NR. | Computational cost grows with the number of graph edges and message-passing layers; parameter count, FLOPs, and memory are often NR. | Evaluated on industrial-process data and distribution networks with more than 100 nodes; performance remains sensitive to topology mismatch and graph-prior quality. | Relatively simple and efficient, but vulnerable to oversmoothing, inaccurate graph construction, and limited adaptation to structural change. |
| Graph attention networks | Attention-based variants report stronger robustness than recurrent and conventional graph baselines under topology and sensor changes; relational GAT variants showed approximately 12% performance degradation in one cross-topology evaluation [11]. | Attention improves selective aggregation but increases inference and memory overhead; exact latency is commonly NR. | Cost increases with edge count, number of attention heads, and neighborhood size; detailed FLOPs and memory reporting remain limited. | Demonstrated robustness under changing sensor configurations and previously unseen measurement locations. | Improved neighbor weighting and robustness are obtained at the cost of greater memory use and computational complexity. |
| Spatiotemporal GNN | Reported improvements include gains of up to approximately 11 percentage points in F1-score over recurrent baselines under partial-observability conditions [11]. | Reduced measured-node graph configurations have achieved approximately sixfold lower training time; exact inference latency remains NR. | Cost depends jointly on graph size, temporal-window length, recurrent or convolutional temporal modules, and message-passing depth. | Evaluated under partial observability, changing operating conditions, noise, and dynamic system behavior. | Strong temporal and relational modeling, but increased training cost and weaker suitability for low-resource deployment. |
| Physics-informed and dynamic GNN | Representative power-system studies report fault-detection accuracy up to 100%, exact localization around 94.73%, one-hop localization around 99.67%, and classification around 97.48% under the reported settings [26]. | Physical priors can reduce the search space, but dynamic graph updating and adaptive attention increase runtime; exact latency is NR. | Three-layer backbones and long training schedules have been reported; computational overhead increases with graph size and dynamic attention groups. | Evaluated across 123-node and 34-node feeders, low-label settings, 30–40 dB noise, topology changes, and cross-system transfer. | High diagnostic accuracy and physical consistency, but dependence on reliable system models and increased adaptation cost. |
| Hypergraph GNN | Representative models report classification accuracy of approximately 0.9965 ± 0.0025 using only 5% labeled data [16]. | High label efficiency is demonstrated, but inference latency and runtime efficiency are generally NR. | Additional cost arises from hyperedge construction and higher-order message passing; FLOPs, parameters, and memory are often NR. | Evaluated across multiple rotating-machinery datasets and under noisy and limited-label conditions; large-graph scalability remains insufficiently studied. | Captures higher-order dependencies effectively, but hypergraph construction is application dependent and computationally demanding. |
| Graph–Transformer hybrids | Representative studies report reduced prediction or classification error relative to selected graph and temporal baselines under study-specific protocols [7]. | Long-range attention can improve representation quality but generally introduces higher latency than local message passing; precise latency is frequently NR. | Self-attention may scale quadratically with the number of tokens or nodes unless sparse or hierarchical attention is used. | Applied to long temporal sequences and multisensor degradation modeling, but evidence from very large graphs and real-time edge deployment remains limited. | Strong long-range dependency modeling, but high memory consumption and limited suitability for resource-constrained systems. |
| Federated and distributed GNN | Predictive performance is generally reported as close to centralized baselines under selected non-IID and multi-client settings [66]. | Local inference can be efficient, but training latency depends strongly on communication rounds, synchronization, and client availability. | Cost includes local computation, repeated parameter exchange, communication bandwidth, and aggregation overhead. | Supports multi-site learning without centralizing raw data; scalability is affected by client heterogeneity, communication bottlenecks, and changing local graph structures. | Improved privacy and collaborative learning are accompanied by communication cost and convergence challenges. |
observations indicate that future studies should report predictive accuracy jointly with latency, training time, model size, memory consumption, hardware configuration, and performance as graph size increases.
12.5. Challenges in Statistical Evaluation and Future Directions
Direct statistical comparison across studies remains difficult because experimental protocols vary in dataset size, fault composition, graph-construction strategy, pre-processing, class balance, train–test partitioning, topology perturbation, and metric selection [18, 22]. Accuracy, F1-score, and AUC are commonly reported, but these measures alone may not adequately characterize open-set recognition, rare-fault performance, uncertainty calibration, computational efficiency, or robustness under changing operating conditions.
Another limitation is the inconsistent reporting of computational characteristics. Many studies provide predictive metrics without reporting parameter count, training du-ration, inference latency, memory use, communication overhead, or energy consumption. This omission prevents reliable assessment of whether a model is suitable for large graphs, edge devices, real-time monitoring, or distributed deployment. Computational claims should therefore be supported by measurements obtained under clearly specified hardware, batch size, graph size, and implementation conditions.
Future evaluations should report dataset characteristics, graph definitions, preprocessing procedures, partitioning strategies, model complexity, parameter count, training cost, inference latency, memory requirements, and robustness under noise, topology variation, unknown faults, and distribution shift. Where federated or distributed architectures are used, communication volume, synchronization frequency, client participation, and convergence behavior should also be documented. Standardized public repositories and consistent reporting protocols would enable more reliable comparison among GNN architectures and support statistically meaningful assessment across application domains. The benchmark and reproducibility issues underlying these requirements are examined further in Section 8.
13. Emerging Research Directions
Emerging research on Graph Neural Networks (GNNs) for fault diagnosis increasingly focuses on deployment oriented limitations involving privacy, physical consistency, multimodal heterogeneity, structural adaptation, and robustness. Rather than increasing architectural complexity alone, future work must determine whether these methods remain reliable under realistic operating constraints, limited labels, evolving topologies, and distributed data environments.
13.1. Federated and Privacy-Preserving GNNs
Federated GNNs enable collaborative model development across distributed industrial sites without centralizing raw sensor data and have been investigated for graph-structured industrial data, non-independent and identically distributed client datasets, heterogeneous local topologies, and communication-constrained settings [53, 66]. Ap-plications include rotor-system diagnosis, anomaly detection in time-varying networks, and causal federated graph learning. Future research should move beyond demonstrating distributed-training feasibility and establish communication-efficient, privacy-verifiable, and topology-aware aggregation under heterogeneous client conditions. Comparative studies should report communication vol-ume, client participation, local graph variation, privacy assumptions, aggregation strategy, and convergence behav-ior alongside diagnostic performance.
13.2. Physics-Informed and Knowledge-Guided Graph Learning
Physics-informed and knowledge-guided GNNs incorporate physical laws, engineering constraints, causal structure, or expert knowledge into graph construction and mes-sage passing [67]. Such integration may reduce reliance on large labeled datasets and discourage physically inconsistent predictions, and recent work has combined physical topology, electrical measurements, adaptive edges, and dual-field representations in power-system and industrial diagnostic applications. However, performance depends on the validity and completeness of the incorporated knowledge, and incorrect or oversimplified assumptions may bias graph construction and restrict generalization under un-seen operating conditions. Future research should evaluate sensitivity to misspecified constraints, quantify the contribution of physical priors, and distinguish improvements arising from domain knowledge from those produced by increased model complexity.
13.3. Multimodal and Cross-Domain Fusion
Multimodal graph learning combines heterogeneous sources such as vibration, acoustic, thermal, visual, electrical, and operational data to construct broader representations of system condition [68]. This direction may improve diagnosis when fault evidence is distributed across modalities and may support transfer across related systems. Key challenges include temporal misalignment, missing or corrupted modalities, unequal sampling rates, feature incompatibility, and increased computational demand. Future work should examine modality reliability, incomplete-input behavior, cross-domain transfer, and failure cases in which an unreliable modality degrades the fused prediction, while also distinguishing gains from complementary information from those caused by larger model capacity.
13.4. Dynamic and Self-Evolving Graphs
Dynamic and self-evolving graph methods update graph structure as operating conditions, components, and system configurations change [8]. These approaches are relevant to network reconfiguration, component replacement, renewable-energy integration, transient operation, and evolving degradation patterns. The principal challenge is distinguishing persistent structural change from temporary measurement noise, because frequent graph updates may increase computational cost, create unstable repre-sentations, or introduce spurious edges. Future studies should therefore investigate change-detection criteria, up-date frequency, stability guarantees, continual adaptation, and the computational feasibility of online graph revision in real-time systems.
13.5. Robust and Adversarially Resilient Diagnostics
GNN-based diagnostic systems remain vulnerable to sensor spoofing, feature perturbation, graph manipulation, training-data contamination, and distribution shift [17]. Proposed defenses include adversarial training, causal interventions, invariant representations, uncertainty estimation, and rejection mechanisms, but existing results are often specific to a dataset, attack model, perturbation mag-nitude, or topology-change protocol. Future evaluations should consider combined feature and structural attacks, adaptive adversaries, unknown fault conditions, and trade-offs between clean-condition performance and robustness. Robustness reporting should include calibration, degradation under perturbation, computational overhead, and failure-detection capability rather than predictive accuracy alone.
Collectively, these directions shift attention from isolated performance improvements toward reliable operation under distributed data, incomplete knowledge, heterogeneous modalities, evolving structures, and adversarial conditions. Progress will require reproducible experiments, realistic deployment settings, transparent computational reporting, and evaluation protocols that assess both predic-tive performance and operational resilience.
14. Design Guidelines for Practitioners
Deploying Graph Neural Network (GNN)-based fault diagnostic systems in operational cyber-physical environments requires consideration of data quality, graph construction, model architecture, computational constraints, security, and safety requirements. Drawing on recent research and the limitations, failure modes, and ethical considerations discussed in this survey, this section presents practical guidelines for designing reliable, interpretable, and deployable GNN-based diagnostic systems [69].
14.1. Graph Construction and Validation
Graph construction should reflect the physical and functional relationships of the monitored system. Practitioners should incorporate available information about physical topology, control logic, component interactions, and causal relationships rather than relying exclusively on statistical correlations [70]. Hybrid strategies that com-bine physics-based priors with data-driven edge learning may support adaptation when system relationships are uncertain or change over time. Graph structures should also be reassessed after equipment replacement, maintenance, sensor failure, or network reconfiguration. Online topology estimation, consistency checks, and digital-twin simulations may help identify graph mismatch and reduce diagnostic errors caused by outdated connectivity assumptions.
14.2. Data Quality, Preprocessing, and Noise Mitigation
Sensor-data quality should be assessed before model training and during deployment because noise, calibration drift, missing values, and synchronization errors can affect both node features and learned graph relationships. Preprocessing pipelines should include appropriate filtering, outlier detection, sensor-calibration checks, missing-data handling, and temporal alignment [70]. Adaptive edge weighting or sensor-reliability scores can reduce the influence of unreliable measurements during message passing, although these mechanisms should be validated under realistic sensor-failure conditions. Recording sensor-health in-dicators, preprocessing transformations, data provenance, and imputation procedures can also improve traceability and support investigation of incorrect diagnostic outputs.
14.3. Model Architecture and Robustness Design
Model architecture should balance representational capacity, robustness, interpretability, and computational cost. Residual connections, attention mechanisms, graph rewiring, and multiscale aggregation may reduce over-smoothing and preserve local fault information in deeper GNNs [69]. Physics informed constraints and causal regularization can be incorporated when reliable domain knowledge is available, but inaccurate constraints may introduce additional bias. Uncertainty estimation through ensembles, probabilistic outputs, Bayesian approximations, or calibrated confidence scores can help identify predictions that require further review. Architecture selection should therefore be based not only on benchmark accuracy but also on calibration, robustness to graph perturbations, computational requirements, and performance under changing operating conditions.
14.4. Handling Open-Set and Evolving Fault Conditions
Operational systems may encounter fault categories and degradation patterns that were absent from the training data. Open-set recognition, novelty detection, and uncertainty-based rejection mechanisms can reduce the risk of assigning unknown faults to inappropriate known categories [69]. Rejection thresholds should be calibrated using validation data that include weak known faults, rare events, and representative unknown conditions because poorly selected thresholds can either accept novel faults or reject difficult known samples. Continual learning, domain adaptation, periodic retraining, and drift detection may support adaptation to changes in equipment condition and operating regimes. Synthetic data and digital-twin simulations can supplement rare-fault examples, but simulated scenarios should be validated to ensure that they represent plausible fault behavior and propagation patterns.
14.5. Deployment Strategy and Resource Awareness
Deployment architecture should be selected according to response-time requirements, privacy constraints, network availability, graph size, and available computing resources. Edge deployment may be appropriate for time-sensitive local inference, while cloud-based or hybrid edge–cloud architectures can support model training, historical analysis, and aggregation across facilities [71]. Pruning, quantization, knowledge distillation, graph sampling, and workload partitioning can reduce memory and computation requirements, although their effect on diagnostic accuracy and calibration should be measured. Federated learning may support collaboration among sites without centralizing raw data, but it introduces communication, convergence, graph-heterogeneity, and security concerns. Deployment studies should therefore report inference la-tency, memory use, communication volume, model size, update frequency, and performance under network disruption.
14.6. Security, Privacy, and Adversarial Resilience
Security controls should address manipulation of sensor values, graph structures, training data, model updates, and communication channels [72]. Relevant measures include authenticated communication, access control, input validation, monitoring for abnormal graph changes, secure model updates, and audit logging. Adversarial training, graph-sanitization procedures, and uncertainty-based rejection may reduce sensitivity to selected attacks, but their effec-tiveness depends on the assumed threat model. Differential privacy, secure aggregation, and encrypted communication may be considered when operational or personal data are sensitive, although these protections can introduce compu-tational cost or reduce model utility. Security evaluation should include feature perturbation, edge manipulation, poisoning, backdoor behavior, and compromised federated participants where these threats are relevant.
14.7. Human-in-the-Loop and Operational Integration
GNN-based diagnostics should support human decision-making rather than automatically replace operator judgment, particularly in safety-critical settings. Human-in-the-loop procedures can allow operators to review diagnostic outputs, provide corrective feedback, request additional evidence, and override automated recommendations when necessary [73]. Integration with supervisory control and data acquisition systems, digital twins, maintenance platforms, and existing alarm-management workflows should preserve established operational responsibilities and escalation procedures. Diagnostic interfaces should present the predicted fault, affected components, uncertainty or confidence information, relevant sensor evidence, and the basis of any recommended action. Operator feedback should also be recorded so that recurring model errors and interface limitations can be identified.
14.8. Validation, Benchmarking, and Continuous Monitoring
Validation should cover the operating conditions and failure scenarios expected during deployment. Models should be evaluated under sensor noise, missing measurements, graph changes, class imbalance, unknown faults, and distribution shifts using standardized datasets and protocols where available [69, 73]. Cross-condition and cross-system testing can provide additional evidence of generalization, while calibration and selective-prediction metrics can indicate whether confidence estimates remain reliable. After deployment, continuous monitoring should track diagnostic accuracy, false-alarm rates, calibration, latency, resource use, graph changes, and data drift. Model updates should follow documented approval, validation, rollback, and audit procedures so that changes do not introduce unobserved performance degradation.
These guidelines emphasize that predictive performance alone is insufficient for operational deployment. Graph quality, data integrity, uncertainty, computational efficiency, security, human oversight, and continuous validation should be considered jointly when developing GNN-based fault-diagnostic systems. Applying these practices can support the transition from experimental models to operational tools while maintaining traceability, reliability, and alignment with system-specific safety requirements.
15. Ethical and Safety Considerations in GNN-Based Fault Diagnostics
As Graph Neural Network (GNN)-based fault-diagnostic systems move toward deployment in safety-critical cyber-physical environments, including smart grids, industrial automation, transportation, healthcare monitoring, and energy infrastructure, their design must account for safety, transparency, accountability, privacy, fairness, robustness, and harm prevention. These systems may in-fluence operational continuity, human well-being, environ-mental protection, and access to essential services. Recent work on trustworthy GNNs identifies privacy preservation, adversarial robustness, fairness, and explainability as cen-tral requirements for responsible graph-learning systems [74]. This section reviews the ethical and safety concerns that arise when GNN-based diagnostics are integrated into operational decision-making.
15.1. Safety-Critical Decision Making and Risk of Harm
GNN-based diagnostic systems may support decisions such as fault isolation in power grids, shutdown recommendations in manufacturing, rerouting in transportation, and alerts in biomedical monitoring. Incorrect outputs caused by cascading misdiagnosis, topology drift, noisy measurements, model uncertainty, or adversarial inputs may lead to equipment damage, service interruption, delayed intervention, or inappropriate control actions. In healthcare settings, false negatives may delay necessary treatment, while false positives may lead to unnecessary follow-up procedures. Uncertainty estimation can help operators identify predictions that require further review, but uncertainty scores must be calibrated and interpreted within the operational context. Safety-by-design practices, including conservative thresholds, redundant validation, fail-safe behavior, human-in-the-loop escalation, and con-trolled fallback procedures, can reduce the likelihood that an uncertain prediction directly triggers a harmful action [75].
15.2. Transparency, Explainability, and Operator Trust
The internal reasoning of deep GNN architectures is often difficult to inspect, which can limit operator under-standing, regulatory review, and post-incident analysis. Engineers and operators may need to determine which nodes, edges, sensor values, or graph relationships con-tributed to a diagnostic outcome before acting on it. Explainable GNN methods include instance-level techniques, such as gradient attribution, perturbation masks, and rel-evance propagation, as well as model-level approaches based on prototypes, recurring subgraphs, or symbolic rules [76]. Domain-oriented explanations may also com-pare learned relationships with physical topology, control logic, or known fault-propagation paths. However, a visually coherent explanation is not necessarily causal or physically valid. Explanations should therefore be assessed for fidelity, stability, domain consistency, and usefulness to the intended operator rather than treated as sufficient evidence of model correctness.
15.3. Data Privacy, Ownership, and Regulatory Compliance
GNN-based diagnostics may process proprietary operational data, infrastructure records, or personally identifiable information collected from distributed sensors and monitoring systems. Cross-facility data sharing can expose industrial processes, maintenance practices, or intellectual prop-erty, while healthcare and transportation applications may involve personal data subject to legal and sector-specific protections. Federated GNN training, differential privacy, secure aggregation, and secure multiparty computation can reduce the need to centralize raw data [77]. These methods nevertheless involve trade-offs among privacy protection, communication cost, computational complexity, and diagnostic performance. Privacy governance should specify data ownership, permitted uses, retention periods, access controls, and procedures for handling model updates or inferred information that may reveal sensitive operational patterns.
15.4. Bias, Fairness, and Unequal Risk Distribution
Bias may arise when training data underrepresent particular operating conditions, equipment types, geographic regions, sensor configurations, or user populations. A model trained primarily on modern, well-instrumented systems may perform less reliably on aging infrastructure, lower-cost equipment, or facilities with sparse sensing. In healthcare and public infrastructure, uneven performance may create unequal exposure to false alarms, delayed de-tection, or service disruption. Fairness-aware GNN methods, bias auditing, stratified evaluation, and representative dataset design can help identify performance differences across relevant groups or operating contexts [78]. Fairness assessment should be tailored to the application because equal aggregate accuracy does not necessarily imply equal safety risk, and the relevant comparison groups may involve equipment classes, geographic regions, facilities, or demographic populations.
15.5. Robustness Against Adversarial Manipulation and Security Threats
GNN-based diagnostic systems connected to operational networks may be exposed to data poisoning, evasion attacks, graph-structure manipulation, compromised sen-sors, or backdoor insertion. Such attacks can conceal faults, create false alarms, alter fault localization, or influence au-tomated responses. Proposed defenses include adversarial training, graph denoising, certified robustness, anomaly filtering, causal interventions, and validation of graph updates [79]. However, robustness results are often dependent on a specific attack model, dataset, and perturbation bud-get. Security assessment should therefore consider feature manipulation, edge insertion or deletion, poisoned training data, compromised federated participants, and attacks that combine several channels. Diagnostic systems should also include authenticated communication, access control, audit logging, and procedures for isolating suspicious inputs or model updates.
15.6. Accountability, Liability, and Governance Frameworks
When a GNN-based diagnostic recommendation contributes to an operational failure or harmful decision, responsibility may be distributed among model developers, equipment vendors, system integrators, operators, data providers, and organizational decision-makers. This makes accountability difficult, particularly when model behavior cannot be reconstructed after an event. Human-in-the-loop procedures, version-controlled models, decision logs, data-provenance records, and documented override mechanisms can support incident investigation and traceability. Gov-ernance frameworks should define who approves model deployment, who monitors performance, who may override automated recommendations, and how errors are reported and corrected [75]. Liability and certification requirements will vary across sectors and jurisdictions, so technical controls should be aligned with the applicable safety standards, regulatory obligations, and organizational responsibilities.
15.7. Ethical Design Principles and Pathways to Trustworthy Deployment
Responsible deployment requires ethical and safety considerations to be incorporated throughout the system life-cycle rather than added after model development. Relevant practices include safety-by-design architectures, calibrated uncertainty thresholds, physically grounded explanations, privacy-by-default data handling, fairness audits, adversarial testing, human oversight, and continuous validation under changing operating conditions [74]. Interdisciplinary review involving engineers, domain specialists, safety professionals, legal experts, and affected stakeholders can help identify risks that are not captured by predictive metrics alone. GNN-based diagnostic systems should therefore be evaluated not only for accuracy but also for calibration, failure containment, traceability, privacy, robustness, and consistency with application specific safety requirements.
16. Conclusion
Graph Neural Networks have expanded the capabilities of fault-diagnostic systems by supporting relational and system-level modeling of interconnected components in complex cyber-physical environments. This survey synthesized developments in GNN-based fault diagnostics through a unified taxonomy, a review of benchmark datasets and evaluation practices, and an analysis of deployment architectures involving trade-offs among latency, scalability, privacy, and computational resources. The distinc-tion between methodological limitations and operational failure modes—including cascading misdiagnosis, topol-ogy drift, noise amplification, open-set failures, adversarial vulnerabilities, and concept drift—highlights the impor-tance of robustness, uncertainty awareness, and failure containment in real-world deployments. Emerging directions, including physics-informed modeling, federated learning, multimodal fusion, and adaptive graph evolution, indicate a continuing shift toward diagnostic frameworks that ac-count for deployment constraints, data heterogeneity, and changing system conditions. Ethical considerations and practitioner-oriented design guidelines further show that predictive performance alone is insufficient for operational use. Future work should prioritize standardized benchmarks, transparent reporting, uncertainty-aware inference, cross-domain validation, computational efficiency, and in-terdisciplinary evaluation to support the development of reliable and safety-conscious GNN-based fault-diagnostic systems.
- Siemens AG, “The true cost of downtime 2024: How much do leading manufacturers lose through inefficient maintenance?”, Tech. rep., Siemens Digital Industries, 2024.
- ABB, “Industrial downtime costs up to $500,000 per hour and can happen every week”, https://new.abb.com/news/detail/130589/industrial-downtime-costs-up-to-500000-per-hour-and-can-happen-every-week, 2025, accessed: 2026-06-21.
- Q. Li, Z. Wu, “Knowledge graph-enhanced fault diagnosis: A bibliometric review of AI applications in sensor management (1998–2024)”, Discover Artificial Intelligence, vol. 5, p. 417, 2025, doi: 10.1007/s44163-025-00688-w.
- DataIntelo, “Graph neural networks market research report 2033”, https://dataintelo.com/report/graph-neural-networks-market, 2025, reports global GNN market size of USD 1.45 billion in 2024 and projected USD 15.47 billion by 2033 at 30.2% CAGR; accessed: 2026-06-21.
- Precedence Research, “Neural network market size, share, and trends 2025 to 2034”, https://www.precedenceresearch.com/neural-network-market, 2025, accessed: 2026-06-21.
- Y. Liu, B. Shen, D. S.-H. Wong, M. Jia, Y. Yao, “Explainable neural network meets graph neural network: Recent advances in process fault detection and diagnosis”, Computers & Chemical Engineering, vol. 206, p. 109528, 2026, doi: 10.1016/j.compchemeng.2025.109528.
- S. Yang, R. Liu, “A review of graph neural networks for rolling bearing fault diagnosis”, Measurement Science and Technology, 2026, doi: 10.1088/1361-6501/ae2e29.
- J. Liu, Y. Huang, K. Chen, G. Liu, J. Yan, S. Chen, Y. Xie, Y. Yu, T. Huang, “Graph neural networks for fault diagnosis in photovoltaic-integrated distribution networks with weak features”, Sensors, vol. 25, no. 18, p. 5691, 2025, doi: 10.3390/s25185691.
- W. Ouyang, Y. Jin, “Fault diagnosis of process systems based on graph neural network”, in Proceedings of the 1st International Conference on Data Mining, E-Learning, and Information Systems (DMEIS 2024), pp. 37–45, SCITEPRESS, 2024, doi: 10.5220/0012876300004536.
- M. Aurangzeb, Y. Wang, S. Iqbal, M. Shafiullah, S. A. Mohammed, Z. M. S. Elbarbary, A. Rehman, “Robust fault detection and uncertainty quantification in smart grids using graph neural networks”, Energy Reports, vol. 15, p. 108920, 2026, doi: 10.1016/j.egyr.2025.12.057.
- B. Karabulut, C. Manna, C. Develder, “Generalization of graph neural network models for distribution grid fault detection”, in 2025 IEEE International Conference on Communications, Control, and Computing Technologies for Smart Grids (SmartGridComm), pp. 1–7, IEEE, 2025, doi: 10.1109/SmartGridComm65349.2025.11204594.
- X. Wang, H. Wang, M. Peng, “Interpretability study of a typical fault diagnosis model for nuclear power plant primary circuit based on a graph neural network”, Reliability Engineering & System Safety, vol. 261, p. 111151, 2025, doi: 10.1016/j.ress.2025.111151.
- M. J. Page, J. E. McKenzie, P. M. Bossuyt, I. Boutron, T. C. Hoffmann, C. D. Mulrow, L. Shamseer, J. M. Tetzlaff, E. A. Akl, S. E. Brennan, R. Chou, J. Glanville, J. Grimshaw, A. Hróbjartsson, M. M. Lalu, T. Li, E. W. Loder, E. Mayo-Wilson, S. McDonald, L. A. McGuinness, L. A. Stewart, J. Thomas, A. C. Tricco, V. A. Welch, P. Whiting, D. Moher, “The PRISMA 2020 statement: An updated guideline for reporting systematic reviews”, BMJ, vol. 372, p. n71, 2021, doi: 10.1136/bmj.n71.
- Z. Chen, J. Xu, C. Alippi, S. X. Ding, Y. A. W. Shardt, T. Peng, C. Yang, “Graph neural network-based fault diagnosis: A review”, arXiv preprint arXiv:2111.08185, 2021, doi: 10.48550/arXiv.2111.08185.
- M. Jia, Y. Yao, Y. Liu, “Review on graph neural networks for process soft sensor development, fault diagnosis, and process monitoring”, Industrial & Engineering Chemistry Research, vol. 64, no. 17, pp. 8543–8564, 2025, doi: 10.1021/acs.iecr.5c00283.
- J. Zhu, J. Hu, B. Sheng, “Multi-metric fusion hypergraph neural network for rotating machinery fault diagnosis”, Actuators, vol. 14, no. 5, p. 242, 2025, doi: 10.3390/act14050242.
- R. Liu, Q. Zhang, D. Lin, W. Zhang, S. X. Ding, “Causal intervention graph neural network for fault diagnosis of complex industrial processes”, Reliability Engineering & System Safety, vol. 251, p. 110328, 2024, doi: 10.1016/j.ress.2024.110328.
- W. Xiao, Y. Wan, Z. Wang, C. Chen, “Spatio-temporal graph neural network for fault diagnosis modeling of industrial robot”, in Proceedings of the 31st International Conference on Engineering, Technology, and Innovation (ICE/ITMC), pp. 1–9, IEEE, 2025, doi: 10.1109/ICE/ITMC65658.2025.11106644.
- B. Wang, M. Wang, Y. Xu, L. Wang, S. Chen, X. Chen, “A diagnosis method based on graph neural networks embedded with multirelationships of intrinsic mode functions for multiple mechanical faults”, Defence Technology, vol. 50, pp. 364–373, 2025, doi: 10.1016/j.dt.2025.04.014.
- C. Li, L. Mo, C. K. Kwoh, X. Li, Z. Chen, M. Wu, R. Yan, “Noise-robust multi-view graph neural network for fault diagnosis of rotating machinery”, Mechanical Systems and Signal Processing, vol. 224, p. 112025, 2025, doi: 10.1016/j.ymssp.2024.112025.
- G. Jiang, K. Shen, X. Liu, X. Cheng, P. Xie, “Hierarchical spatio-temporal graph network for fault diagnosis of industrial processes”, IEEE Internet of Things Journal, vol. 12, no. 3, pp. 3043–3054, 2025, doi: 10.1109/JIOT.2024.3476287.
- Y. Wang, M. Wu, X. Li, L. Xie, Z. Chen, “A survey on graph neural networks for remaining useful life prediction: Methodologies, evaluation and future trends”, arXiv preprint arXiv:2409.19629, 2024, doi: 10.48550/arXiv.2409.19629.
- Z. Chen, J. Xu, T. Peng, C. Yang, “Graph convolutional network-based method for fault diagnosis using a hybrid of measurement and prior knowledge”, IEEE Transactions on Cybernetics, vol. 52, no. 9, pp. 9157–9169, 2022, doi: 10.1109/TCYB.2021.3059002.
- W. Liao, D. Yang, Y. Wang, X. Ren, “Fault diagnosis of power transformers using graph convolutional network”, CSEE Journal of Power and Energy Systems, vol. 7, no. 2, pp. 241–249, 2021, doi: 10.17775/CSEEJPES.2020.04120.
- Q.-H. Ngo, B. L. H. Nguyen, J. Zhang, K. Schoder, H. Ginn, T. Vu, “Deep graph neural network for fault detection and identification in distribution systems”, Electric Power Systems Research, vol. 247, p. 111721, 2025, doi: 10.1016/j.epsr.2025.111721.
- W. Li, D. Deka, “Physics-informed graph neural networks for robust fault location in power grids”, ICML 2021 Workshop on Tackling Climate Change with Machine Learning, 2021.
- T. Li, Z. Zhao, C. Sun, R. Yan, X. Chen, “Hierarchical attention graph convolutional network to fuse multi-sensor signals for remaining useful life prediction”, Reliability Engineering & System Safety, vol. 215, p. 107878, 2021, doi: 10.1016/j.ress.2021.107878.
- Q. Wang, B. Han, “Temporal transaction network anomaly detection for industrial internet of things with federated graph neural networks”, Computers & Industrial Engineering, vol. 205, p. 111122, 2025, doi: 10.1016/j.cie.2025.111122.
- Z. He, Y. Zeng, H. Shao, B. Yang, “Noise-robust rotating machinery fault diagnosis method based on enhanced graph isomorphism network with multi-sensor signals”, Measurement Science and Technology, 2025, doi: 10.1088/1361-6501/adf45d.
- Y. Wang, J. Zhao, D. Tang, W. Zhao, S. Huang, “Intelligent fault prediction and diagnosis for wind-powered heating systems using graph neural networks”, Scientific Reports, vol. 15, p. 39068, 2025, doi: 10.1038/s41598-025-25884-7.
- M. Vaida, Z. Huang, “Multimodal graph neural networks in healthcare: A review of fusion strategies across biomedical domains”, Frontiers in Artificial Intelligence, vol. 8, p. 1716706, 2026, doi: 10.3389/frai.2025.1716706.
- C. Lou, M. A. Atoui, X. Zhang, D. Xu, H. Zhong, “Semi-supervised graph neural networks for fault diagnosis in marine machinery”, Engineering Applications of Artificial Intelligence, vol. 177, no. 2, p. 114951, 2026, doi: 10.1016/j.engappai.2026.114951.
- R. Bourgerie, T. Zanouda, “Fault detection in telecom networks using bi-level federated graph neural networks”, in 2023 IEEE International Conference on Data Mining Workshops (ICDMW), pp. 1608–1617, IEEE, 2023, doi: 10.1109/ICDMW60847.2023.10449399.
- V. P. Dwivedi, C. K. Joshi, A. T. Luu, T. Laurent, Y. Bengio, X. Bresson, “Benchmarking graph neural networks”, Journal of Machine Learning Research, vol. 24, no. 43, pp. 1–48, 2023.
- A. Varbella, K. Amara, B. Gjorgiev, M. El-Assady, G. Sansavini, “PowerGraph: A power grid benchmark dataset for graph neural networks”, Advances in Neural Information Processing Systems, vol. 37, pp. 110784–110804, 2024, doi: 10.52202/079017-3517.
- Case Western Reserve University Bearing Data Center, “Bearing Data Center”, https://engineering.case.edu/bearingdatacenter, accessed: 2026-06-13.
- C. Lessmeier, J. K. Kimotho, D. Zimmer, W. Sextro, “Condition monitoring of bearing damage in electromechanical drive systems by using motor current signals of electric motors: A benchmark data set for data-driven classification”, Proceedings of the European Conference of the Prognostics and Health Management Society, vol. 3, 2016, doi: 10.36001/phme.2016.v3i1.1577.
- J. Lee, H. Qiu, G. Yu, J. Lin, R. T. Services, “IMS, University of Cincinnati Bearing Data Set”, NASA Prognostics Data Repository, NASA Ames Research Center, 2007.
- H. Qiu, J. Lee, J. Lin, G. Yu, “Wavelet filter-based weak signature detection method and its application on rolling element bearing prognostics”, Journal of Sound and Vibration, vol. 289, no. 4–5, pp. 1066–1090, 2006, doi: 10.1016/j.jsv.2005.03.007.
- Y. Lei, T. Han, B. Wang, N. Li, T. Yan, J. Yang, “XJTU-SY rolling element bearing accelerated life test datasets: A tutorial”, Journal of Mechanical Engineering, vol. 55, no. 16, pp. 1–6, 2019, doi: 10.3901/JME.2019.16.001.
- B. Wang, Y. Lei, N. Li, N. Li, “A hybrid prognostics approach for estimating remaining useful life of rolling element bearings”, IEEE Transactions on Reliability, vol. 69, no. 1, pp. 401–412, 2020, doi: 10.1109/TR.2018.2882682.
- H. Purohit, R. Tanabe, K. Ichige, T. Endo, Y. Nikaido, K. Suefusa, Y. Kawaguchi, “MIMII dataset: Sound dataset for malfunctioning industrial machine investigation and inspection”, Proceedings of the Detection and Classification of Acoustic Scenes and Events Workshop, pp. 209–213, 2019, doi: 10.33682/m76f-d618.
- R. Tanabe, H. Purohit, K. Dohi, T. Endo, Y. Nikaido, T. Nakamura, Y. Kawaguchi, “MIMII DUE: Sound dataset for malfunctioning industrial machine investigation and inspection with domain shifts due to changes in operational and environmental conditions”, in 2021 IEEE Workshop on Applications of Signal Processing to Audio and Acoustics (WASPAA), pp. 21–25, 2021, doi: 10.1109/WASPAA52581.2021.9632774, also available as arXiv:2105.02702.
- A. Saxena, K. Goebel, “Turbofan engine degradation simulation data set”, NASA Prognostics Data Repository, NASA Ames Research Center, 2008.
- A. Saxena, K. Goebel, D. Simon, N. Eklund, “Damage propagation modeling for aircraft engine run-to-failure simulation”, in 2008 International Conference on Prognostics and Health Management, pp. 1–9, 2008, doi: 10.1109/PHM.2008.4711414.
- J. J. Downs, E. F. Vogel, “A plant-wide industrial process control problem”, Computers & Chemical Engineering, vol. 17, no. 3, pp. 245–255, 1993, doi: 10.1016/0098-1354(93)80018-I.
- S. Ghamizi, A. Bojchevski, A. Ma, J. Cao, “SafePowerGraph: Safety-aware evaluation of graph neural networks for transmission power grids”, arXiv preprint arXiv:2407.12421, 2024, doi: 10.48550/arXiv.2407.12421.
- Z. Zhu, F. Li, Z. Mo, Q. Hu, G. Li, Z. Liu, X. Liang, J. Cheng, “A²Q: Aggregation-aware quantization for graph neural networks”, in International Conference on Learning Representations, 2023.
- A. Zhou, J. Yang, T. Qiao, Y. Qi, Z. Yang, W. Zhao, C. Hu, “Graph neural networks automated design and deployment on device-edge co-inference systems”, in Proceedings of the 61st ACM/IEEE Design Automation Conference, DAC ’24, Association for Computing Machinery, New York, NY, USA, 2024, doi: 10.1145/3649329.3655938.
- J. Qin, R. Yang, N. Yu, “Physics-informed graph neural networks for collaborative dynamic reconfiguration and voltage regulation in unbalanced distribution systems”, IEEE Transactions on Industry Applications, vol. 61, no. 2, pp. 2538–2548, 2025, doi: 10.1109/TIA.2025.3529799.
- A. Isah, H. Shin, I. Aliyu, R. M. Sulaiman, J. Kim, “Graph neural network for digital twin network: A conceptual framework”, in 2024 International Conference on Artificial Intelligence in Information and Communication (ICAIIC), pp. 1–5, IEEE, 2024, doi: 10.1109/ICAIIC60209.2024.10463455.
- S. Sheka, A. Saraswathi, “Improving mechanical fault diagnosis using graph neural networks with dynamic and multiscale features”, Engineering, Technology & Applied Science Research, vol. 15, no. 4, pp. 25382–25387, 2025, doi: 10.48084/etasr.11612.
- Y. Wang, “FedGNN-SFD: A lightweight federated graph neural network for multi-sensor bearing fault diagnosis in industrial IoT systems”, Preprints.org, 2026, doi: 10.20944/preprints202603.2130.v1, preprint.
- B. Chen, G. Lu, Y. Zhu, C. Liu, B. Qin, J. Li, “GCFR: Graph contrastive fault representation for diagnosis in power communication networks”, Scientific Reports, vol. 15, p. 39838, 2025, doi: 10.1038/s41598-025-23457-2.
- F. Wang, Y. Liu, K. Liu, Y. Wang, S. Medya, P. S. Yu, “Uncertainty in graph neural networks: A survey”, Transactions on Machine Learning Research, 2025, doi: 10.48550/arXiv.2403.07185.
- Q. Zhou, L. Xue, J. He, S. Jia, Y. Li, “A rotating machinery fault diagnosis method based on dynamic graph convolution network and hard threshold denoising”, Sensors, vol. 24, no. 15, p. 4887, 2024, doi: 10.3390/s24154887.
- S. Zhang, S. Shan, Z. Hu, Y. Shen, C. Li, K. Zhang, H. Wei, “Out-of-distribution fault detection in multi-sensor systems using spatio-temporal dynamic graph neural networks”, Mechanical Systems and Signal Processing, vol. 241, p. 113524, 2025, doi: 10.1016/j.ymssp.2025.113524.
- J. Xu, Y. Wang, R. Xu, H. Wang, X. Zhou, “Research on open-set recognition methods for rolling bearing fault diagnosis”, Sensors, vol. 25, no. 10, p. 3019, 2025, doi: 10.3390/s25103019.
- Y. Jin, X. Zhu, “Oversmoothing alleviation in graph neural networks: A survey and unified view”, Knowledge and Information Systems, vol. 67, pp. 11259–11285, 2025, doi: 10.1007/s10115-025-02548-6.
- D. Kelesis, D. Fotakis, G. Paliouras, “Analyzing the effect of residual connections to oversmoothing in graph neural networks”, Machine Learning, vol. 114, p. 184, 2025, doi: 10.1007/s10994-025-06822-0.
- U. Alon, E. Yahav, “On the bottleneck of graph neural networks and its practical implications”, in International Conference on Learning Representations, 2021.
- A. Vassilev, A. Oprea, A. Fordyce, H. Anderson, X. Davies, M. Hamin, “Adversarial machine learning: A taxonomy and terminology of attacks and mitigations”, Tech. Rep. NIST AI 100-2e2025, National Institute of Standards and Technology, 2025, doi: 10.6028/NIST.AI.100-2e2025.
- L. Gosch, M. Sabanayagam, D. Ghoshdastidar, S. Günnemann, “Provable robustness of (graph) neural networks against data poisoning and backdoor attacks”, Transactions on Machine Learning Research, 2025.
- V. Toğan, F. Mostofi, O. B. Tokdemir, “Evaluating the resilience of graph neural network architectures to adversarial and noisy data in high-stakes construction project management”, Journal of Construction Engineering and Management, vol. 152, no. 4, p. 04026029, 2026, doi: 10.1061/JCEMD4.COENG-17244.
- Z. He, C. Shen, B. Chen, J. Shi, W. Huang, Z. Zhu, D. Wang, “A new feature boosting based continual learning method for bearing fault diagnosis with incremental fault types”, Advanced Engineering Informatics, vol. 61, p. 102469, 2024, doi: 10.1016/j.aei.2024.102469.
- G. Mao, H. Li, L. Xue, Y. Li, Z. Cai, K. Noman, “FedPM-SGN: A federated graph network for aviation equipment fault diagnosis by multi-sensor fusion in decentralized and heterogeneous setting”, Information Fusion, vol. 117, p. 102876, 2025, doi: 10.1016/j.inffus.2024.102876.
- Z. Ma, C. Liu, F. He, G. Yang, “A physics-informed graph convolutional network for bearing fault diagnosis via dynamic constraint-guided feature learning”, Engineering Research Express, vol. 8, p. 065524, 2026, doi: 10.1088/2631-8695/ae5166.
- S. Yu, X. Li, Y. Lei, B. Yang, N. Li, K. Feng, “Multimodal data-enabled large model for machine fault diagnosis towards intelligent operation and maintenance”, Journal of Industrial Information Integration, vol. 50, p. 101061, 2026, doi: 10.1016/j.jii.2026.101061.
- T. Li, Z. Zhou, S. Li, C. Sun, R. Yan, X. Chen, “The emerging graph neural networks for intelligent fault diagnostics and prognostics: A guideline and a benchmark study”, Mechanical Systems and Signal Processing, vol. 168, p. 108653, 2022, doi: 10.1016/j.ymssp.2021.108653.
- M. MansourLakouraj, M. Gautam, R. Hossain, H. Livani, M. Benidris, S. Commuri, “Event classification in active distribution grids using physics-informed graph neural network and PMU measurements”, in 2022 IEEE Industry Applications Society Annual Meeting (IAS), pp. 1–6, IEEE, 2022, doi: 10.1109/IAS54023.2022.9939922.
- C. He, K. Balasubramanian, E. Ceyani, C. Yang, H. Xie, L. Sun, L. He, L. Yang, P. S. Yu, Y. Rong, P. Zhao, J. Huang, M. Annavaram, S. Avestimehr, “FedGraphNN: A federated learning system and benchmark for graph neural networks”, 2021, doi: 10.48550/arXiv.2104.07145.
- D. Zügner, O. Borchert, A. Akbarnejad, S. Günnemann, “Adversarial attacks on graph neural networks: Perturbations and their patterns”, ACM Transactions on Knowledge Discovery from Data, vol. 14, no. 5, pp. 57:1–57:31, 2020, doi: 10.1145/3394520.
- D. Paolini, P. Dini, A. Elhanashi, S. Saponara, “Advanced fault detection and diagnosis exploiting machine learning and artificial intelligence for engineering applications”, Electronics, vol. 15, no. 2, p. 476, 2026, doi: 10.3390/electronics15020476.
- H. Zhang, B. Wu, X. Yuan, S. Pan, H. Tong, J. Pei, “Trustworthy graph neural networks: Aspects, methods, and trends”, Proceedings of the IEEE, vol. 112, no. 2, pp. 97–139, 2024, doi: 10.1109/JPROC.2024.3369017.
- E. Tabassi, “Artificial intelligence risk management framework (AI RMF 1.0)”, Tech. Rep. NIST AI 100-1, National Institute of Standards and Technology, 2023, doi: 10.6028/NIST.AI.100-1.
- H. Yuan, H. Yu, S. Gui, S. Ji, “Explainability in graph neural networks: A taxonomic survey”, IEEE Transactions on Pattern Analysis and Machine Intelligence, vol. 45, no. 5, pp. 5782–5799, 2023, doi: 10.1109/TPAMI.2022.3204236.
- C. Wu, F. Wu, L. Lyu, T. Qi, Y. Huang, X. Xie, “A federated graph neural network framework for privacy-preserving personalization”, Nature Communications, vol. 13, no. 1, p. 3091, 2022, doi: 10.1038/s41467-022-30714-9.
- A. Chen, R. A. Rossi, N. Park, P. Trivedi, Y. Wang, T. Yu, S. Kim, F. Dernoncourt, N. K. Ahmed, “Fairness-aware graph neural networks: A survey”, 2023, doi: 10.48550/arXiv.2307.03929.
- W. Jin, Y. Li, H. Xu, Y. Wang, S. Ji, C. Aggarwal, J. Tang, “Adversarial attacks and defenses on graphs: A review, a tool and empirical studies”, 2020, doi: 10.48550/arXiv.2003.00653.