
From Prediction to Practice: Interpretable Machine Learning for Proactive Student Retention Within Student Information Systems


(This article belongs to the Section Information Systems – Computer Science (ISC))
Export Citations
Cite
Bhogaraju, S. B. K. (2026). From Prediction to Practice: Interpretable Machine Learning for Proactive Student Retention Within Student Information Systems. Journal of Engineering Research and Sciences, 5(11), 38–53. https://doi.org/10.55708/js0511003
Subrahmanya Bala Kiran Bhogaraju. "From Prediction to Practice: Interpretable Machine Learning for Proactive Student Retention Within Student Information Systems." Journal of Engineering Research and Sciences 5, no. 11 (November 2026): 38–53. https://doi.org/10.55708/js0511003
S.B.K. Bhogaraju, "From Prediction to Practice: Interpretable Machine Learning for Proactive Student Retention Within Student Information Systems," Journal of Engineering Research and Sciences, vol. 5, no. 11, pp. 38–53, Nov. 2026, doi: 10.55708/js0511003.
Although several machine learning models are reported in the literature for student dropout prediction, only a few of them have been used in institutional Student Information Systems (SIS), in part because they need data or tools that are not available in the SIS. The purpose of this research is to put forward a deployment-oriented approach, mediated by only SIS-native data elements. The dataset is University of California, Irvine (UCI) Predict Students' Dropout and Academic Success which contains the academic performance of students from the first and second semesters of their university studies, and the prediction of the students' dropout is formulated as a binary classification problem; two models (Logistic Regression (LR) and Random Forest (RF)) are trained using the same data and tested with an 80/20 split. The accuracy for both models was 0.82, at-risk F1-score 0.71, and recall of 0.63, with receiver operating characteristic area under the curve (ROC-AUC) of 0.86 (LR) and 0.85 (RF). Results of the ablation study indicate that the F1-score can be improved to 0.79 when using all 36 of the dataset attributes while the evaluation of the age-group indicates that the false positive rate for students of age 25 or above is higher. The study also outlines a four-layer SIS integration architecture—data ingestion, risk prediction, advisor notification, and outcome tracking—which allows the LR model to both generate the risk score and give an explanation to the advisor, as well as a governance model for who is the owner, who has access to the predictions, how students are notified, and how long the risk scores and explanations are retained. The architecture is not in production yet and a staged evaluation plan is specified.
1. Introduction
Dropout of students continues to be one of the greatest challenges for higher education institutions. Its effects are not only felt by the student but by the institution in terms of performance, funding, and reputation as well. The magnitude of the problem is significant in higher-education settings; for instance, according to [1], Finnish universities of applied sciences had an annual average dropout rate of 9.0% from 2001 to 2007, translating into about 9,622 students annually dropping out of their programs. Such levels of dropout mean losses for institutions using funding formulas tied to graduation due to the large amount of investment that had already been made in the students before they withdraw from the institution. As institutions have to deal with growing numbers of diverse students, there is a need to find ways of identifying such at-risk students in time to assist them, thus making it both necessary and strategic. Decision support systems provide a useful way of addressing this challenge through the integration of the process into institutional workflows.
1.1. Related Work
In the last decade, machine learning (ML) techniques have been widely used to address this challenge. The application of classification models, such as Logistic Regression, decision tree models, Random Forest and more recently, boosting algorithms, shows a certain degree of accuracy in the prediction of student dropout based on academic and demographic information [2-3]. At the same time, despite the significant number of studies, machine learning models for student dropout prediction are still quite rare in practice. A recently conducted systematic review of 61 publications covering 2018-2025 revealed greater emphasis on the predictive performance of these models rather than on implementation of predictions in institutional decisions. Only a few studies have assessed aspects of their implementation in the end-to-end sense including setting decision thresholds, explanation of models to stakeholders, planning of interventions, and monitoring [4]. It means that the gap between the predictive performance reported in the publications and practical implementation of predictions in educational institutions is rather big [4-5]. Bridging this gap demands rethinking the problem of student dropout prediction as a decision support task when predictions have to lead to action of advisors within the frameworks of institutional systems.
Research in learning analytics [6] has further broadened the evidence base for data-driven approaches in higher education. Prior research has identified socioeconomic conditions and early academic integration as key factors in student dropout [7], with subsequent work demonstrating that academic performance data collected across successive semesters can be used to identify at-risk students early [8]. Early warning systems (EWS) have been proposed as a practical institutional response [9-10].
Among these, LADA (Learning Analytics Dashboard for Academic Advising) was designed specifically to support comparative and predictive analysis for academic advisers, and was evaluated with advisers at two higher education institutions [11]. The evaluation found that LADA enabled advisers to consider a wider range of scenarios than traditional advising tools, while also noting that transparency in how predictions were generated was necessary to build adviser confidence in the tool.
More recent work has extended this focus from dashboard usability to responsible institutional deployment. In [12], the authors developed and piloted a predictive modelling dashboard for study advisors using data from an institutional student information system. Their study highlights that operational adoption depends not only on predictive performance, but also on stakeholder involvement, data literacy, privacy and security considerations, and the integration of predictive information into advising practice. While this work demonstrates that predictive analytics can be operationalized in an institutional setting, the predictions are delivered through a dedicated advisor dashboard. The present study addresses a complementary architectural question: how predictive functionality can be incorporated directly into existing Student Information System (SIS) workflows without requiring a separate end-user analytics application.
Another approach to explainability focuses on explaining a model after the fact. Specifically, Ribeiro et al. [13] introduced Local Interpretable Model-agnostic Explanations (LIME), the first widely used approach for explaining individual predictions by locally approximating a black-box classifier with a simpler, more comprehensible model, whereas Lundberg and Lee [14] formalized the SHapley Additive exPlanations (SHAP) approach, which explains feature attributions through concepts from cooperative game theory and has properties LIME’s heuristic parameters cannot guarantee. These approaches have grown in prevalence as tools for dropout prediction in education, even in recent papers using explainable artificial intelligence (XAI) for intervention purposes [15] and papers employing SHAP on the same dataset [16]. The disadvantage of such an approach is that an extra level of computation and operational complexity is required beyond the main model, which itself must be continuously updated at each model training iteration and properly understood by advisors, who are typically not machine learning specialists. This study circumvents the need to develop an explanation model as a separate layer and chooses Logistic Regression as its main model due to the clear interpretation of its coefficients and feature-level contributions.
An important test of the assumption of predicting success correlating with institutional impact is provided by [17] who performed a randomized controlled field experiment involving 758 first-year students at a Dutch university, randomly dividing them into EWS-assisted counselling and traditional counselling groups. Their machine learning models (logistic regression, additive logistic regression, support vector machine (SVM), and random forest) were found to be able to identify at-risk students, thus confirming the predictive viability of machine learning-based EWS in a real-world institutional context. However, the EWS-assisted group was not significantly better than traditional counselling with respect to dropout and credit outcomes. Interviewing of counsellors revealed the implementation problem behind such an outcome: they noted that the dashboard was operating in parallel to the institution’s administrative system and did not integrate into the advisors’ workflows, and some said it did not offer any recommendations beyond the risk score. This result reflects the trend observable in EWS literature in evaluating a dashboard by its accuracy or usability and paying little attention to its integration into the existing institutional information system (see, e.g., Krumm et al. [18], regarding similarly low rate of Student Explorer adoption).
The adoption theory explains the implementation gap. In [19], the authors studied the PeopleSoft implementation at a university in Saudi Arabia. They concluded that the reason for limited enterprise resource planning (ERP) adoption in institutions of higher education is often not technical but because the personnel find the new systems disjointed from the current workflows, as was the case with the counselor behavior in the study of Plak et al. [17]. The conceptual model identified fit with existing institutional processes as the core factor of adoption of a new system by university staff rather than its underlying precision or efficiency, thus putting the implementation gap in the EWS context into perspective: platforms that do not integrate with systems currently used by institutional personnel suffer from the same adoption barriers discussed in the wider body of enterprise systems literature irrespective of the quality of their underlying model.
A number of more recent works have begun shifting focus to implementation of operational early warning systems. For instance, Babatunde et al. [20] developed an interface for monitoring risk in academic advising using an Extreme Gradient Boosting (XGBoost) dropout model combined with SHAP explanations within a Streamlit web application. Such research constitutes significant progress from standalone model construction to decision support solutions. Still, such an approach requires a separate model and explanation engine and is delivered through an external web application. In this research, the architecture for implementing an early warning interface directly in SIS was examined.
1.2. Study Objectives and Contributions
This study takes a fundamentally different path. Rather than aiming to optimize for benchmark accuracy, it questions what the structure of machine learning should be to make it truly adoptable within a student information system. This becomes the main driver of all methodological decisions in this study, starting from feature selection restricted to the data about academic performance provided by SIS and moving to using interpretable models whose output could be understood by the advisors and administrators without special training. The answer to this question becomes the basis for designing a four-layer architecture of integration which allows integrating prediction outputs right into the institutional workflow without making advisors deviate from the natural process of working with SIS [19].
The novelty of this study lies not in developing a more accurate model for dropout prediction, but in developing a deployment-oriented framework which includes the combination of the useful predictive performance and the proposed SIS-native integration architecture. The study also illustrates how proactive student retention support can be designed around data institutions already hold, interpretable models, and infrastructure institutions already operate, without requiring additional commercial analytics tools or new data collection infrastructure. The framework is presented as a reference architecture; its operation in a live production environment has not yet been evaluated (see Limitations and Future Work).
The key contributions of this study are as follows:
- A framework for practical machine learning integration which is intended to function within the constraints imposed by existing Student Information Systems, without any need for additional tools or socioeconomic data gathering.
- The comparison between Logistic Regression and Random Forest models when considering SIS-native variables demonstrates that interpretable models deliver comparable accuracy to more complex non-boosting models.
- A four-layer reference architecture is proposed which maps the model predictions to the institution’s workflow (data ingestion, risk prediction, alerting advisors, monitoring outcomes), based on preliminary consultation with an institutional SIS administrator.
- Feature importance analysis shows that second semester academic performance indicators are the most important predictors in the current model and provide SIS-native predictors for the institutional risk assessment.
- An ablation study, an age-group fairness evaluation, and a data governance model that address feature-group contribution, potential bias from the use of age, and the protection of predictive risk information.
2. Results
2.1. Model Performance
Two classification models, Logistic Regression (LR) and Random Forest (RF) were evaluated within the SIS deployment framework developed during this study. Both models achieved comparable performance, with an overall accuracy of 0.82.
For the at-risk class, both models achieved a precision of approximately 0.82, meaning that about 82% of students classified as at risk belonged to the Dropout class in the test set. Recall at the default classification threshold of 0.5 was 0.63 for both models.
As shown in Table 1, the comparable performance of Logistic Regression and Random Forest across the reported metrics provides evidence that the predictive signal in the selected SIS-native feature set is consistent across two structurally different algorithms. This similarity supports the architectural choice of Logistic Regression as the primary deployment model, with Random Forest providing a complementary validation perspective, rather than selecting between the models on performance grounds alone.
Table 1: Model Performance Comparison Click to enlarge
| Model | Accuracy | Precision (Dropout) | Recall (Dropout) | F1-Score | ROC-AUC |
|---|---|---|---|---|---|
| Logistic Regression | 0.82 | 0.82 | 0.63 | 0.71 | 0.86 |
| Random Forest | 0.82 | 0.81 | 0.63 | 0.71 | 0.85 |
Table 1: Model Performance Comparison
| Model | Accuracy | Precision (Dropout) | Recall (Dropout) | F1-Score | ROC-AUC |
|---|---|---|---|---|---|
| Logistic Regression | 0.82 | 0.82 | 0.63 | 0.71 | 0.86 |
| Random Forest | 0.82 | 0.81 | 0.63 | 0.71 | 0.85 |
ROC-AUC = Receiver Operating Characteristic – Area Under the Curve.
2.2. Feature Importance Analysis
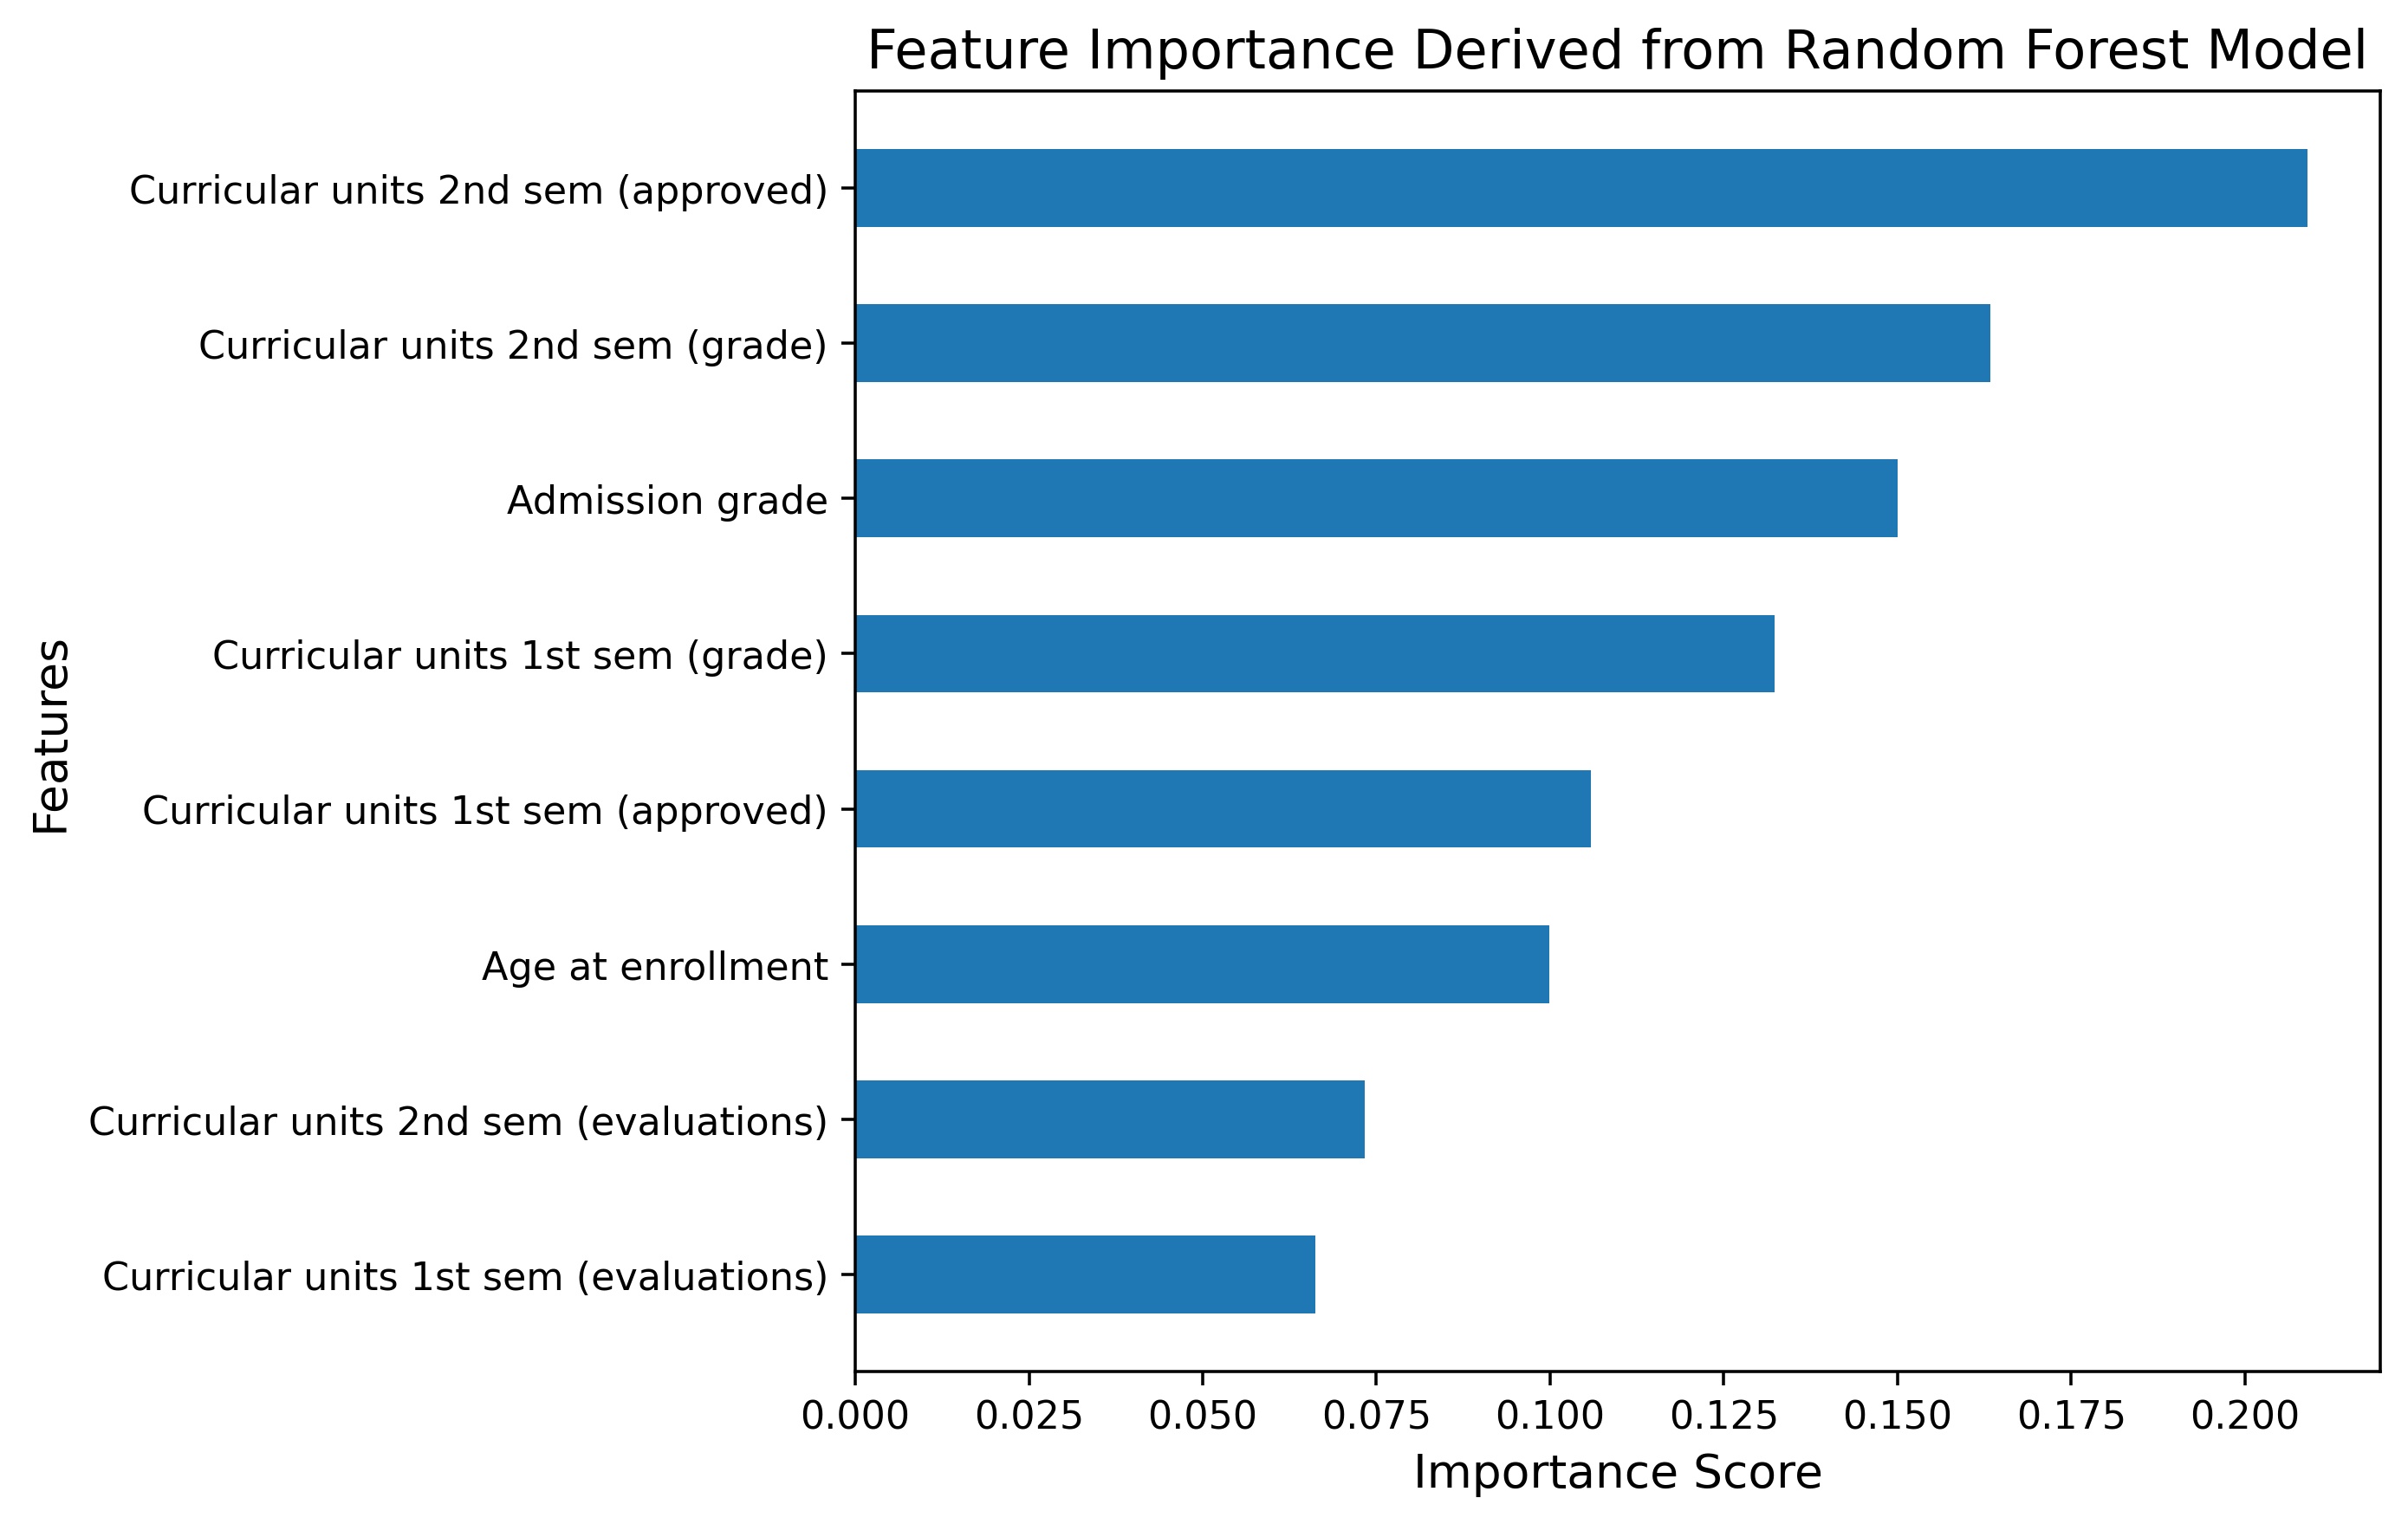
As depicted in Figure 1, the Random Forest feature importance analysis shows the relative contribution of each selected feature to the model’s dropout predictions. The findings show that performance factors in the second semester are the most important features to be considered in predicting student risk of dropping out. Number of units passed in the second semester is the leading feature, while grades in the second semester come second. Admission grade and performance factors in the first semester are moderately important.
The number of evaluations had relatively low feature importance compared with course completion and grade-related indicators, suggesting that academic outcomes carried more predictive information in the current model than the number of evaluations undertaken. Within the proposed SIS framework, these scores provide an evidence-based ranking of the selected predictors. These scores are used for offline validation only and are not displayed to advisors, whose explanations are derived from the LR model (see Layer 4).
2.3. Ablation Study
An ablation study was performed with the same train/test split, random seed and threshold as the full models to assess the effect of each set of SIS-native features, and to provide a controlled comparison in place of the cross-study positioning in Table 5. All of the feature groups were explored by removing either individual features or combining them together: the full model (A0); admission grade and age only (A1); admission, age, and first-semester performance (A2); first and second semester performance without admission grade or age (A3); the full model without age (A4); the full model without admission grade (A5); and the full model without evaluation counts (A6). A last configuration (A7) involves training the two models on all 36 attributes of the dataset using the same binary formulation, which quantifies the cost of predicting with a restricted model in the same task (using SIS-native features). The results are shown in Table 2.
Table 2: Ablation Study of SIS-Native Feature Groups (test set, threshold 0.50) Click to enlarge
| Configuration | k | LR Recall | LR F1 | LR ROC-AUC | RF F1 | RF ROC-AUC |
|---|---|---|---|---|---|---|
| A0 Full model | 8 | 0.63 | 0.71 | 0.86 | 0.71 | 0.85 |
| A1 Admission + age | 2 | 0.18 | 0.28 | 0.68 | 0.37 | 0.60 |
| A2 Admission + age + S1 | 5 | 0.58 | 0.67 | 0.83 | 0.65 | 0.82 |
| A3 S1 + S2 only | 6 | 0.59 | 0.69 | 0.86 | 0.72 | 0.85 |
| A4 No age | 7 | 0.60 | 0.69 | 0.86 | 0.68 | 0.84 |
| A5 No admission grade | 7 | 0.62 | 0.71 | 0.86 | 0.70 | 0.85 |
| A6 No evaluations | 6 | 0.60 | 0.69 | 0.86 | 0.68 | 0.84 |
| A7 All 36 attributes | 36 | 0.72 | 0.79 | 0.91 | 0.77 | 0.91 |
Table 2: Ablation Study of SIS-Native Feature Groups (test set, threshold 0.50)
| Configuration | k | LR Recall | LR F1 | LR ROC-AUC | RF F1 | RF ROC-AUC |
|---|---|---|---|---|---|---|
| A0 Full model | 8 | 0.63 | 0.71 | 0.86 | 0.71 | 0.85 |
| A1 Admission + age | 2 | 0.18 | 0.28 | 0.68 | 0.37 | 0.60 |
| A2 Admission + age + S1 | 5 | 0.58 | 0.67 | 0.83 | 0.65 | 0.82 |
| A3 S1 + S2 only | 6 | 0.59 | 0.69 | 0.86 | 0.72 | 0.85 |
| A4 No age | 7 | 0.60 | 0.69 | 0.86 | 0.68 | 0.84 |
| A5 No admission grade | 7 | 0.62 | 0.71 | 0.86 | 0.70 | 0.85 |
| A6 No evaluations | 6 | 0.60 | 0.69 | 0.86 | 0.68 | 0.84 |
| A7 All 36 attributes | 36 | 0.72 | 0.79 | 0.91 | 0.77 | 0.91 |
k = number of features; A0 corresponds to Table 1. LR = Logistic Regression; RF = Random Forest; F1 = F1-score for the Dropout class; ROC-AUC = area under the receiver operating characteristic curve.
There are three findings from Table 2. First, the information in the admission grade and the age alone (A1) is not strong enough to guide early warnings—both its LR recall of 0.18 and F1-score of 0.28 are weak. When the first semester performance (A2) is included in the calculation the LR F1 score is 0.67 and the ROC-AUC is 0.83, and when the second semester performance (A0) is used, this yields a further improvement to 0.71 and 0.86, respectively, showing that the majority of predictive information is available after the first semester with the second semester providing a measurable boost. Second, the removal of any single SIS-native group sees a maximum reduction of 0.02 in LR F1-score and leaves ROC-AUC essentially unchanged (see A4 to A6), while the removal of admission-grade has almost no effect on LR F1-score (see A5), and removing age lowers the LR recall from 0.63 to 0.60 (see A4). Third, the same binary task, using all 36 attributes (A7), achieves an LR F1 of 0.79 and a ROC-AUC of 0.91. The restriction to SIS-native features thus loses approximately 0.08 F1 and 0.05 ROC-AUC under the same conditions, which is the price of using only SIS-native data that institutions already hold, without collecting socioeconomic data. This applies to the results of the RF as well.
2.4. Fairness Evaluation by Age Group
One of the eight predictors is age at enrollment; in the LR model, the predicted probability of dropout is higher if the age at enrollment is higher (Figure 4). A subgroup (slicing) analysis [21] was carried out on the test set since this might disadvantage older or returning students. The students were split into three groups according to their age at enrollment: 20 or younger, 21 to 24, and 25 or older, the last of which approximates the mature and returning student population. The observed dropout rate, the proportion of students flagged as at risk, recall (the true positive rate), false positive rate and precision were calculated for each band for the full LR model and an LR model retrained without age. The comparison of the two models distinguishes between disparities due to the use of age itself and differences due to academic performance among different age groups. Table 3 reports the results.
Table 3: Fairness Evaluation of the LR Model by Age Group at Enrollment (test set, threshold 0.50) Click to enlarge
| Model, age group | n | Dropout rate | Flag rate | Recall | FPR | Precision |
|---|---|---|---|---|---|---|
| LR, ≤ 20 | 521 | 0.23 | 0.16 | 0.49 | 0.07 | 0.69 |
| LR, 21 to 24 | 130 | 0.42 | 0.28 | 0.58 | 0.05 | 0.89 |
| LR, ≥ 25 | 234 | 0.60 | 0.52 | 0.77 | 0.15 | 0.89 |
| No age, ≤ 20 | 521 | 0.23 | 0.18 | 0.53 | 0.07 | 0.69 |
| No age, 21 to 24 | 130 | 0.42 | 0.31 | 0.64 | 0.07 | 0.88 |
| No age, ≥ 25 | 234 | 0.60 | 0.43 | 0.65 | 0.10 | 0.91 |
Table 3: Fairness Evaluation of the LR Model by Age Group at Enrollment (test set, threshold 0.50)
| Model, age group | n | Dropout rate | Flag rate | Recall | FPR | Precision |
|---|---|---|---|---|---|---|
| LR, ≤ 20 | 521 | 0.23 | 0.16 | 0.49 | 0.07 | 0.69 |
| LR, 21 to 24 | 130 | 0.42 | 0.28 | 0.58 | 0.05 | 0.89 |
| LR, ≥ 25 | 234 | 0.60 | 0.52 | 0.77 | 0.15 | 0.89 |
| No age, ≤ 20 | 521 | 0.23 | 0.18 | 0.53 | 0.07 | 0.69 |
| No age, 21 to 24 | 130 | 0.42 | 0.31 | 0.64 | 0.07 | 0.88 |
| No age, ≥ 25 | 234 | 0.60 | 0.43 | 0.65 | 0.10 | 0.91 |
LR = full model; No age = LR retrained without age at enrollment; n = number of test-set students in the group; Flag rate = proportion flagged as at risk; Recall = true positive rate; FPR = false positive rate.
When the age at enrollment is examined, the observed dropout rate increases sharply with age, from 0.23 among those aged 20 or younger to 0.60 among those aged 25 or older (Table 3). The full LR model does not under-detect older students: it has a recall of 0.77 for the oldest students and 0.49 for the youngest students. However, there is a higher false positive rate for older students who do not drop out (0.15) than for the two younger groups (0.07, 0.05); and the youngest dropouts are the group most often not flagged. Removing age reduces the false positive rate for the oldest group to 0.10 and increases recall for both of the younger groups (to 0.53 and 0.64, respectively), while decreasing the recall for the oldest group to 0.65 and the overall recall from 0.63 to 0.60 (Table 2, A4). The differences are not erased by removing age, due to differences in the base rate and in academic performance across the groups. There is, then, a trade-off in using age between identifying more at-risk older students and contacting more older students who are not at risk. Due to the small size of the middle group (n = 130), the estimates are less precise; the 95% bootstrap interval for the middle group’s recall (1,000 resamples, percentile method) is 0.44 to 0.71.
The at-risk flag is used to initiate supportive outreach and not any adverse action, so a false positive will cost an advisor contact, while a false negative will result in no outreach to a student who will end up dropping out. In this context, recall disparities are thus the primary fairness concern along with the potential stigma of being flagged repeatedly [22]. For deployment, the framework considers the inclusion of age as a decision for the institution that is reviewed at each retraining cycle using the subgroup metrics in Table 3, and age-related contributions are provided to advisors as background information and not as a basis for intervention.
3. Discussion
3.1. Interpretation of Findings
There is a clear trend in student progression that is consistent with the recent empirical evidence on how accumulated credits and failed subjects are the main factors influencing dropouts [1]. In the current model, academic progression indicators, particularly second-semester approved units and grades, have greater feature importance than admission grade. Admission grade contributes to prediction but is not the dominant predictor.
These results suggest that dropout risk is associated not only with admission characteristics but also with students’ subsequent academic progression. In the current model, semester-level academic performance provides stronger predictive information than initial admission characteristics.
This conclusion plays an important role in determining the timing of the proposed SIS risk evaluation. Since second semester performance indicators have significant feature importance in this particular model, the second semester results constitute an appropriate point to perform institutional risk evaluation. The present analysis focuses on this combined feature set. Evaluating how predictive performance progresses through successive academic stages would be a direction to consider for future work.
3.2. Implications for Student Information Systems
The results of this study have clear implications for the development and use within student information systems. As shown in Figure 2, a possible four-layer integration framework is suggested here, which is an application of the machine learning pipeline from this study into the higher education data ecosystem. The framework is tailored specifically for logistic regression and random forest binary classifiers, in that the layers rely on properties of the two algorithms: Structured Query Language (SQL)-deployable weights, feature importance, and customizable probability threshold.
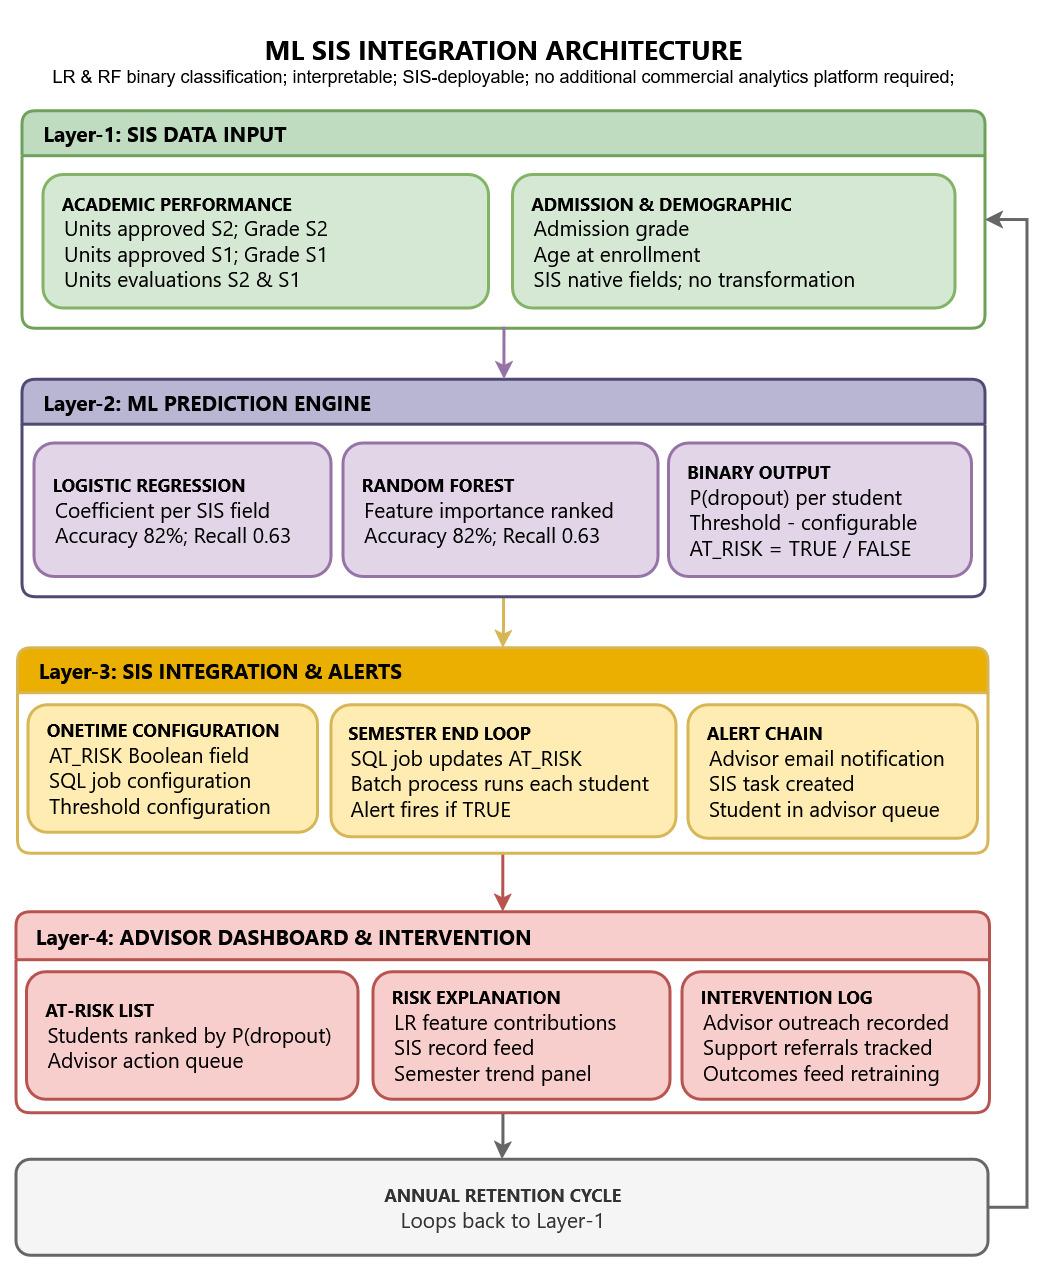
Figure 3 shows Layer 1, the SIS data input layer. The attributes used in this research, including academic performance measures, admission measures, and demographics, map directly to SIS data elements collected and stored in an institution’s SIS system. Every attribute fed into the model comes from the fields in an SIS system without any preprocessing of the attribute other than the standardization built into the stored LR formula; therefore, the values observed by an advisor in a student record will be structurally identical to those used to train the model. This direct mapping prevents the problem of preprocessing seen in other research involving synthetic oversampling or derived attributes. For each input, Figure 3 also shows the standardized LR coefficient that is stored in the SIS configuration.
The prediction engine for Layer 2 based on machine learning is illustrated in Figure 4. Logistic Regression and Random Forest models are both trained on institutional SIS data and applied to eligible students that have finished at least two semesters of academic study. More specifically, the logistic regression model calculates the probability of student dropout from the weighted sum of standardized SIS field values, with the weights determined by the coefficients, which are kept in the whole coefficient table, along with the training mean and standard deviation of each field, in a static database configuration. Such an approach allows performing predictions by means of standard SQL queries without the use of a Python interpreter, a serialized model file, and other dependencies in the production environment. Random Forest feature importance is used offline at each retraining cycle to give a global ranking of the selected predictors for validation; it is not shown in the advisor interface.
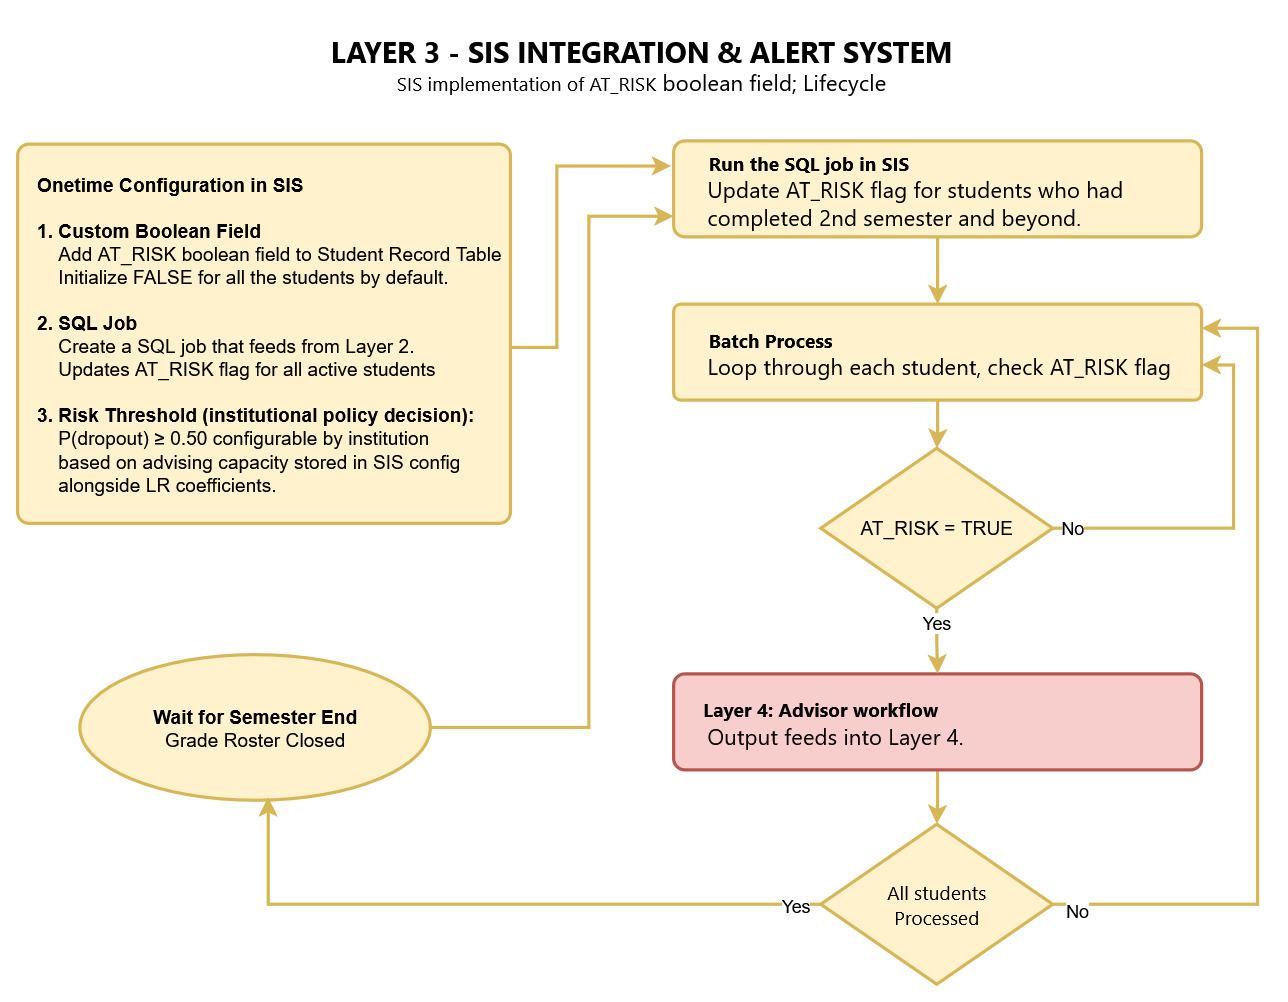
The binary classification system was chosen as an intentional design choice. The system provides one AT_RISK flag for each student, being either TRUE or FALSE, generated based on a probabilistic cut-off value chosen as a configurable parameter and decided upon institutionally. The standard cut-off of P(dropout) of 0.50 or higher can be tuned depending on the institution’s advising capacity. Institutions with high capacity for advising can choose a lower threshold to detect borderline students, whereas institutions with low advising capacity can tune to a higher threshold and concentrate on the most vulnerable students.
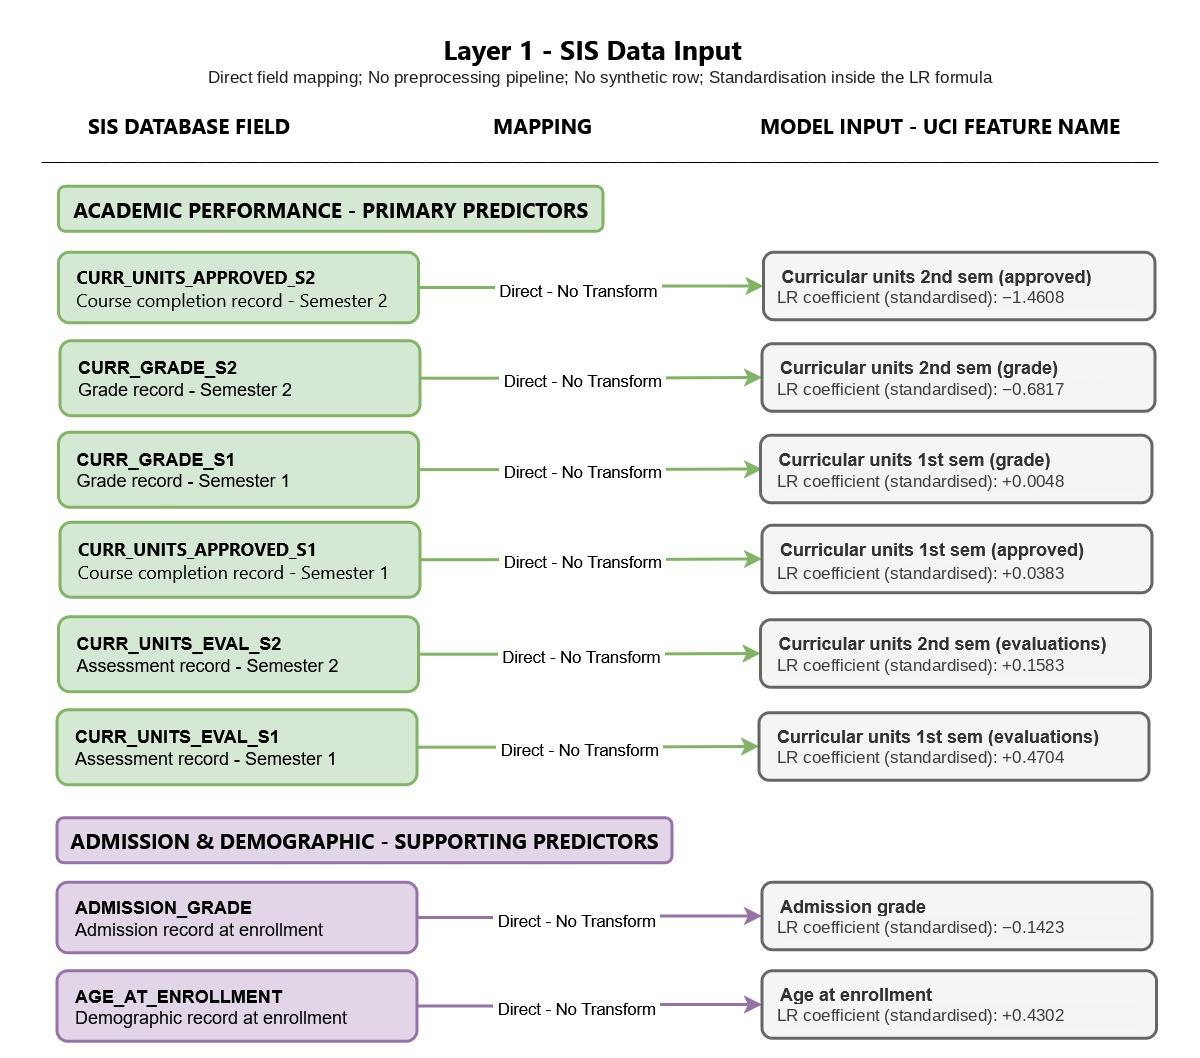
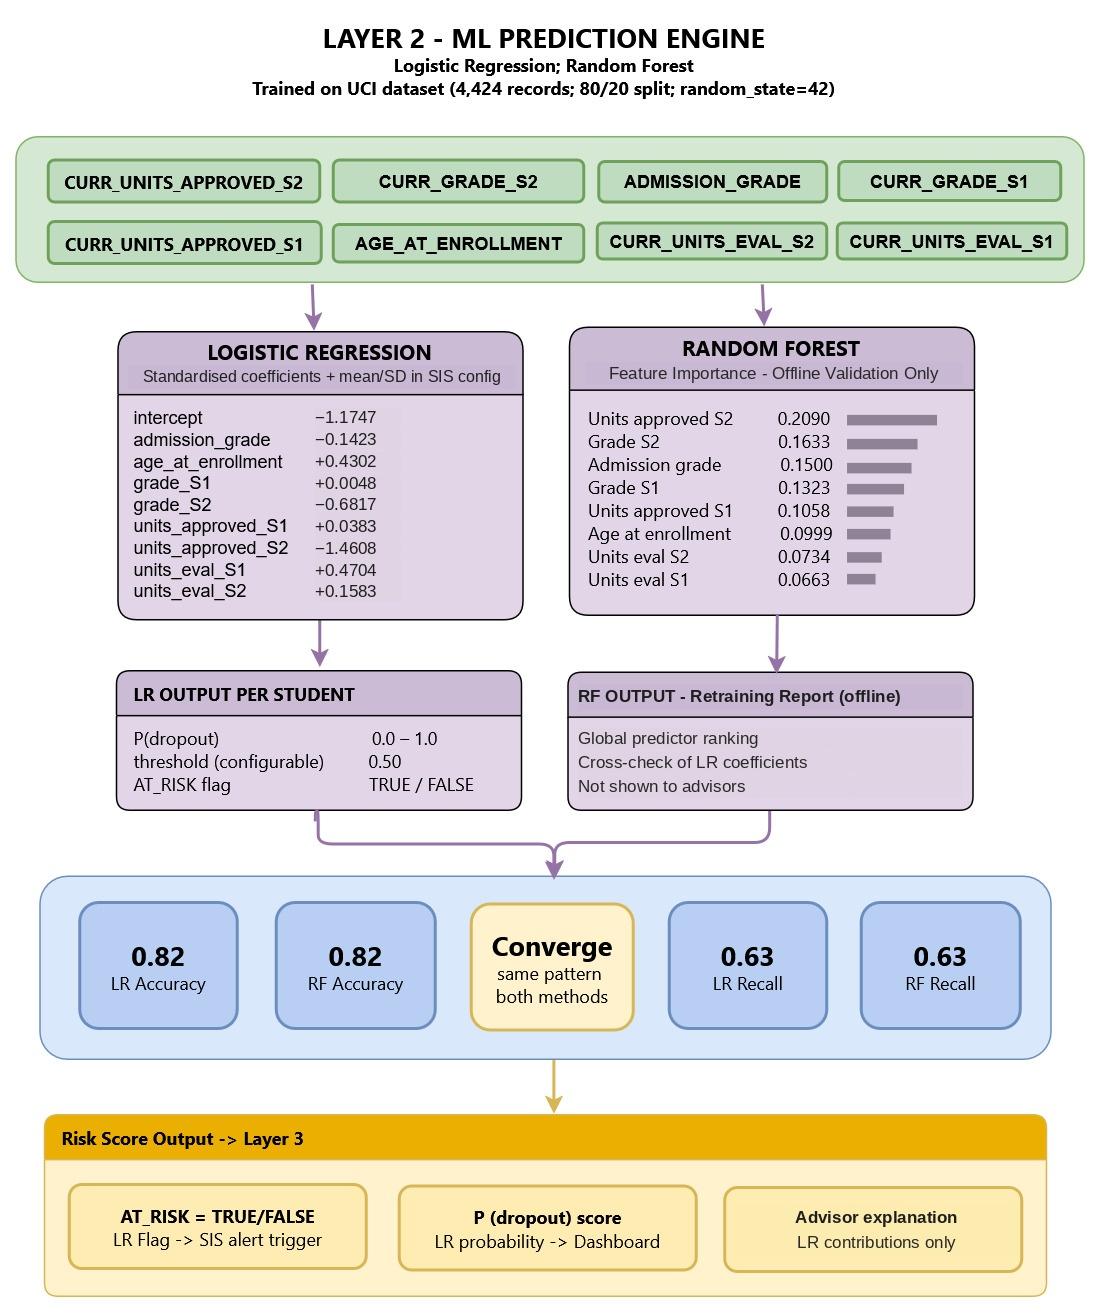
Figure 5 highlights Layer 3, the SIS integration and notification layer. After grade records are closed at the end of each semester, an automated SQL job modifies the AT_RISK boolean column for all eligible active students in the database using the current coefficient settings. This is followed by the processing of a loop on flagged students and triggering the built-in workflow engine of the SIS for generating notifications to their respective advisors, just like how financial holds or registration alerts or any institutional process is performed. A custom notification system is not needed. The risk score cut-off and LR coefficients are institutional parameters set annually.
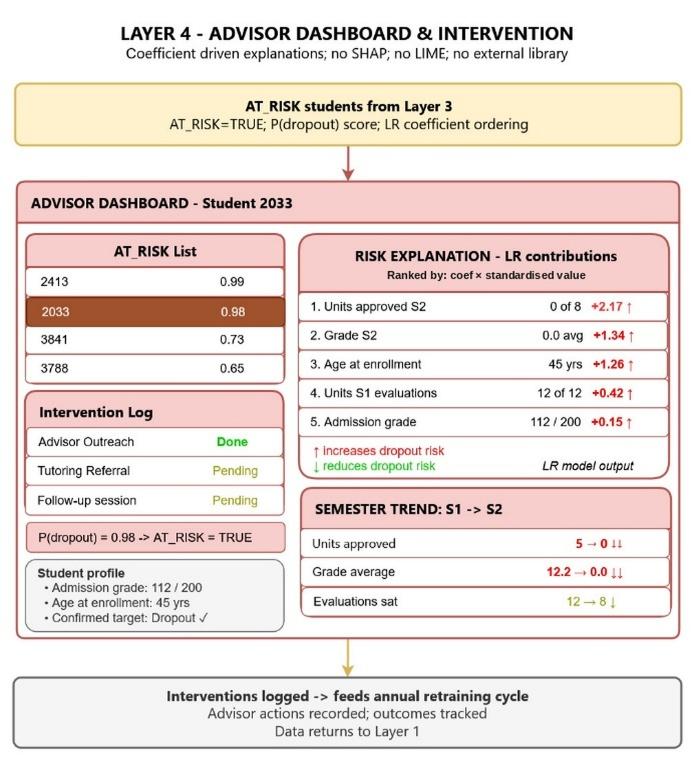
The advisor dashboard and intervention layer is Layer 4 (see Figure 6). The risk explanations are created using the logistic regression coefficients directly, where all of the contributing SIS fields are ranked according to their absolute contribution towards the student’s drop-out probability score (the coefficient multiplied by the student’s standardized field value, which adds to the predicted log-odds of dropout). As a result, explanations of risk are written in a way that is human-understandable, such as: the student was marked as being at risk because he/she did not complete more than two of the six courses he/she was enrolled in during the second semester. Furthermore, in order to generate the explanations, no post-hoc explainability technique, such as SHAP and LIME [13-14], is applied. All information presented to advisors is based on the Logistic Regression model; Random Forest feature importance is used only for offline validation and is not shown to advisors.
Student ID “2033” is illustrative. LR contribution values shown are derived from the actual model applied to Row 2033 of the University of California, Irvine (UCI) Predict Students’ Dropout and Academic Success dataset [23], a confirmed Dropout record. The dataset is de-identified and contains no student identifiers; row numbers are assigned by the author for reference only.
Based on the empirical model results, the proposed architecture illustrates how such predictions could be implemented using existing institutional infrastructure and commonly available SIS capabilities. Further development of the architecture is a subject for further investigation.
Universities should be advised to use SIS data available locally for training the model rather than using the UCI dataset used in this project. This is due to the architecture of the model, which takes into account the fact that the features correspond precisely to the standard SIS data fields, and the coefficient table and the importance score are updated to locally calculated ones after each training session.
This design does not pertain to any particular student information system. Due to the fact that the data for the inputs are taken from areas related to academic performance and admissions which are commonly present in institutional student information systems, this design is intended to be flexible enough to be used in various student information system environments like PeopleSoft Campus Solutions and Ellucian Banner. The integration layer makes use of only standard SQL and workflow features provided in enterprise student information systems software.
The annual retraining cycle built into the proposed framework enables the model to be continuously updated using native student data. Each cohort outcome dataset can help the model learn more from institutional student data so that subsequent rounds of retraining can bring even better results than what could be gained from a research dataset alone.
To obtain practitioner input on the applicability of the suggested reference architecture, a preliminary consultation was conducted with the administrator of the institution who is responsible for the operation of the student information system in a public research university. From the discussion, it was found out that the present practice used in the institution to identify at-risk students focuses mainly on the enrolment history by identifying those who did not enroll for several consecutive terms.
An additional point made by the administrator is that a risk notification tool at the end of a semester that takes into account various risk factors can have value in the current advising practices. Although the current conversation does not qualify as an empirical validation of the architecture under consideration, it offers practitioner insight into the practicality of the problem as well as the assumptions of the architectural model. Further implementation at the institution and subsequent evaluation during multiple training cycles can offer additional insights.
3.3. Operational Considerations
For operational implementation of the proposed architecture, issues such as implementation effort, technical skills, data management, model maintenance, and organizational ownership must be considered. The architecture has been devised to keep incremental technology costs minimal as far as possible, through the use of the capabilities that exist in the current student information system at the institutions. Production prediction is carried out through standard SQL functions along with Logistic Regression coefficients, whereas notification of advisors makes use of existing SIS workflows. As a result of this, no need will be felt for an additional commercial analytics tool, standalone application for prediction purposes, or even a Python runtime environment in the production setting. Hence, the costs involved will be more related to customization, development, and testing efforts than anything else.
Technical skill sets for both processes also align along similar lines of capabilities typically offered by enterprise SIS teams. The development of the initial model and annual retrain process will require skills for data preparation and machine learning using Python programming language, while operational process will mainly involve the usage of SQL and batch processing along with configuration of databases and SIS workflows. This helps maintain periodic nature of machine learning process without making it a continuous need. Technical review during each retrain cycle will be needed to check data quality, model accuracy, and update local parameters.
It is especially critical because the predictions about dropouts are based on educational information at the level of individual students and form part of an institutional decision support process. At higher education institutions in the United States, the management of access to the underlying student data, predicted risk scores, contributing factors, and interventions needs to comply with the Family Educational Rights and Privacy Act (FERPA) and institutional data governance policies. Access to predictive information should be role-based and limited to individuals who have a legitimate educational interest, for example, assigned advisors and student success staff members. Institutions should establish how predictions are stored, who can see them, how long the data about risks and interventions are retained, and how predictions may be utilized in advising decisions. The fact that the proposed framework does not require gathering additional information besides the academic and admissions data from the SIS of institutions makes it unnecessary to extend the existing student data collection efforts. However, the proper review of privacy and governance issues at institutions is needed before its operational implementation.
Finally, sustainability of the process is related to clear organizational ownership. While the technical implementation of the predictive model can be handled by the institutional SIS or the enterprise applications team, interpretation of risk signals and the intervention policy are an advising or student success concern. Model performance evaluation needs to take place at each retraining cycle involving evaluation of changes in accuracy, recall, precision, and at-risk student proportions. If the performance and/or predictor importance of the model changes, a technical and functional review should be conducted before changes to the model parameters are rolled out. This organizational ownership creates a real governance cycle: institutional information technology (IT) supports the prediction mechanism, while the student success team is responsible for the intervention policy and is involved in cycles of model performance evaluation.
3.4. Data Governance, Privacy, and Access Control
In addition to the privacy considerations above, the governance of dropout predictions should be determined prior to deployment instead of being left to local practice [5, 24]. The risk score and its explanation should be considered to be part of the student’s education record and therefore be subject to the protection of FERPA since they are kept in the SIS and are tied to an identifiable student. The framework thus defines the governance controls listed in Table 4.
Table 4: Governance Controls for Predictive Risk Information Click to enlarge
| Aspect | Proposed control |
|---|---|
| Ownership | The institution owns the predictions. The registrar (or equivalent data steward) governs the source data, the student success office owns the intervention policy and the use of risk scores, and IT is the technical custodian of the model and its parameters. |
| Protection | Risk scores, explanations, and the AT_RISK flag are held in restricted SIS tables under existing SIS role-based security and institutional encryption and backup standards; every view or export is logged for audit. |
| Access | Limited to staff with a legitimate educational interest, namely the assigned advisor and designated student success staff. Instructors, admissions, and financial aid staff have no access, and institutional research receives only aggregated, de-identified data. |
| Purpose limitation | Used only to prompt supportive outreach; never used for admission, financial aid, academic standing, or disciplinary decisions, and no action is taken automatically without advisor judgment. |
| Student notification | The use of predictive analytics in advising is disclosed in the institutional privacy notice and annual FERPA notification. Outreach invites students to support services without labelling them as at risk, and students may inspect their records, including the risk score. |
| Retention | Person-level scores and explanations are kept for the academic year in which they are generated and the following retraining cycle, then deleted or de-identified; intervention logs follow the advising-record retention schedule. |
| Oversight | At each retraining, a governance group of IT and student success staff reviews performance and subgroup metrics (Table 3), approves parameter changes, and records the decision. |
Table 4: Governance Controls for Predictive Risk Information
| Aspect | Proposed control |
|---|---|
| Ownership | The institution owns the predictions. The registrar (or equivalent data steward) governs the source data, the student success office owns the intervention policy and the use of risk scores, and IT is the technical custodian of the model and its parameters. |
| Protection | Risk scores, explanations, and the AT_RISK flag are held in restricted SIS tables under existing SIS role-based security and institutional encryption and backup standards; every view or export is logged for audit. |
| Access | Limited to staff with a legitimate educational interest, namely the assigned advisor and designated student success staff. Instructors, admissions, and financial aid staff have no access, and institutional research receives only aggregated, de-identified data. |
| Purpose limitation | Used only to prompt supportive outreach; never used for admission, financial aid, academic standing, or disciplinary decisions, and no action is taken automatically without advisor judgment. |
| Student notification | The use of predictive analytics in advising is disclosed in the institutional privacy notice and annual FERPA notification. Outreach invites students to support services without labelling them as at risk, and students may inspect their records, including the risk score. |
| Retention | Person-level scores and explanations are kept for the academic year in which they are generated and the following retraining cycle, then deleted or de-identified; intervention logs follow the advising-record retention schedule. |
| Oversight | At each retraining, a governance group of IT and student success staff reviews performance and subgroup metrics (Table 3), approves parameter changes, and records the decision. |
Retention periods and roles are proposed defaults to be confirmed with the institution’s registrar, privacy office, and legal counsel.
These controls reuse governance mechanisms that institutions already apply to SIS data, such as role-based security, audit logging, and records retention schedules, so they do not require new infrastructure.
3.5. Comparative Analysis with Prior Studies
Table 5 positions the performance of this study relative to two prior studies that used the same UCI Predict Students’ Dropout and Academic Success dataset. Both comparison studies applied three-class classification (Graduate, Dropout, Enrolled) across the full 36-feature dataset; this study applies binary classification (at-risk / not at-risk) constrained to SIS-native features. These task differences preclude direct numerical comparison but do not prevent meaningful contextualization of results. Table 5 is therefore not used to claim superiority over prior work; a controlled comparison under identical conditions is provided by the ablation study in Table 2, where configuration A7 applies the same binary task to all 36 attributes.
Table 5: Comparative Analysis with Prior Studies on the UCI Predict Students’ Dropout and Academic Success Dataset (not a like-for-like comparison) Click to enlarge
| Study | Models Used | Best Accuracy | F1-Score (Dropout) | Imbalance Handling | Focus |
|---|---|---|---|---|---|
| Villar & de Andrade (2024) | DT, SVM, RF; GB, XGBoost, CatBoost, LightGBM + Optuna | Not reported | 0.88 (LightGBM & CatBoost + Optuna) | SMOTE | Three-class; boosting benchmark; SHAP analysis |
| Bhurre & Prajapat (2024) | MLP, SL, DT, RF, REPTree | 0.81 (RF) | 0.797 (RF) | None | Three-class; supervised model comparison |
| This Study (Bhogaraju) | LR, RF (binary, SIS-aligned) | 0.82 (LR & RF) | 0.71 (LR & RF) | None | Binary; SIS integration; interpretability |
Table 5: Comparative Analysis with Prior Studies on the UCI Predict Students’ Dropout and Academic Success Dataset (not a like-for-like comparison)
| Study | Models Used | Best Accuracy | F1-Score (Dropout) | Imbalance Handling | Focus |
|---|---|---|---|---|---|
| Villar & de Andrade (2024) | DT, SVM, RF; GB, XGBoost, CatBoost, LightGBM + Optuna | Not reported | 0.88 (LightGBM & CatBoost + Optuna) | SMOTE | Three-class; boosting benchmark; SHAP analysis |
| Bhurre & Prajapat (2024) | MLP, SL, DT, RF, REPTree | 0.81 (RF) | 0.797 (RF) | None | Three-class; supervised model comparison |
| This Study (Bhogaraju) | LR, RF (binary, SIS-aligned) | 0.82 (LR & RF) | 0.71 (LR & RF) | None | Binary; SIS integration; interpretability |
LR = Logistic Regression; RF = Random Forest; DT = Decision Tree; SVM = Support Vector Machine; GB = Gradient Boosting; XGBoost = Extreme Gradient Boosting; MLP = Multilayer Perceptron; SL = Simple Logistic; REPTree = Reduced Error Pruning Tree; SMOTE = Synthetic Minority Over-sampling Technique; SHAP = SHapley Additive exPlanations. Accuracy figures refer to overall classification accuracy where reported; F1-scores are class-specific unless noted as weighted averages. Direct numerical comparison should account for differences in task formulation (binary vs. three-class) and feature sets used across studies; see Table 2 for a controlled comparison.
In [16], the authors report F1-scores as the primary performance metric. ROC-AUC values exceeded 0.90 for both top-performing models. In [16], they have attained the highest F1-score for the Dropout class (0.88) via LightGBM and CatBoost through Optuna hyperparameter optimization and SMOTE oversampling, which was analyzed using SHAP. Bhurre and Prajapat [25] have compared five classical supervised learning models on the same dataset but without any class imbalance adjustment, where Random Forest yielded the highest accuracy (0.81) and weighted F1-score (0.797). The current research paper, employing Logistic Regression and Random Forest on the same dataset without any form of data augmentation or framework tuning, has obtained 0.82 accuracy and F1-score 0.71 for the at-risk class.
The superiority of boost learning methods over other machine learning approaches with respect to F1 score has been recognized [16]. In both comparison papers, the full dataset of 36 features of the UCI repository has been used, but it contains socioeconomic factors, like parents’ level of education and occupation and scholarship information, which are not measured by many SIS systems and cannot be collected without posing data governance issues. Most importantly, neither study discusses any aspects related to implementation, integration into SIS, or adviser’s workflow alignment. The proposed models are created based only on the features that can be observed from the academic perspective and extracted from the SIS system: semester grades, approved units, evaluations, admission grade, and age at enrollment.
The Logistic Regression model that is chosen to be deployed provides interpretability of its coefficients in order to help administrators and advisors see what makes students flagged. This feature is not available for ensemble and boosting models without additional analysis, which is another reason to prefer Logistic Regression to these models. Binary output directly reflects the at-risk vs. not-at-risk state, thus decreasing the effort needed to convert three-class classification into a binary one. In combination with the above features, such as alignment with SIS data and simplicity of operations, mentioned properties form the main criteria used to assess the contribution of this study.
3.6. Limitations and Future Work
Despite the promising outcomes of the research, some limitations are worth mentioning.
Firstly, the current dataset comes from a single institution, which might raise questions about its generalization. Further investigation should include conducting this study across a number of institutions to generalize the results for a variety of student samples. There have been efforts made to validate the introduced approach based on the Open University Learning Analytics Dataset (OULAD), but there were some structural limitations that prevented this process, such as the lack of a corresponding feature of semester-level unit completion and class imbalance in proxy mappings.
Secondly, and most importantly for a deployment-oriented study, the framework has yet to be deployed in a live production environment, so the external validity of the framework has not yet been established. The evidence presented here supports the predictive feasibility of SIS-native features and the technical feasibility of the components of the architecture, but not the impact of the architecture on advising practice or retention outcomes. In [17], the authors found that accurate predictions do not by themselves lead to better outcomes, so operational evaluation is crucial. The following staged evaluation is therefore proposed: (a) a shadow deployment where the model scores students at the end of each semester without informing advisors so that flags can be compared with observed outcomes in local data; (b) a pilot with a small group of advisors, to measure notification delivery, advisor response time and the perceived usefulness of the explanations; and (c) a controlled comparison of retention and credit outcomes between advised groups over several retraining cycles, subject to institutional approval and ethical review.
Thirdly, the existing model relies primarily on admission and academic performance attributes. Other variables like financial status, engagement and behavior can contribute towards the accuracy of prediction.
Fourth, the models have been tested with only one train-test split using a fixed seed without using k-fold cross validation. Although this method is in keeping with the aim of making a model deployable in the study where a model is trained once with institutional data and retrained yearly, it does not provide general performance measures across several splits. Future work should apply cross-validation to assess the stability of performance estimates across different data partitions.
Fifth, the dataset suffers from class imbalance between the dropping out and the non-dropping out of students, and no effort has been made to handle this issue using methods like SMOTE. This might be one reason for obtaining a recall of 0.63 using a classification threshold of 0.50. It would be worth considering the impact of dealing with class imbalance on the recall score in future studies, especially in an institution-based setting.
Sixth, only age is evaluated in terms of fairness, with only one test split. The size of some subgroups restricts the precision of the estimates, and other attributes (such as gender and nationality) and their intersections were not assessed.
Finally, this current research is solely dependent upon the academic performance and admissions criteria that are accessible through student information system databases. Studies that have considered behavioral engagement features such as social connections, event attendance, and network centrality among peers have found that these features may be able to provide predictive value in addition to institutional factors [26]. This current framework values implementation within an existing SIS framework over highest predictive value and does not incorporate features which necessitate additional data gathering frameworks that many institutions do not maintain. Further research could expand upon the current framework to include behavioral engagement features when appropriate infrastructure exists, to determine if the increased predictive value is worthwhile.
4. Materials and Methods
4.1. Problem Formulation and Research Questions
Universities often struggle to find at-risk students at an early stage of their studies when an intervention can make a difference. There is a lot of admission, demographic, and academic performance data that is captured by any student information system throughout the student life cycle. While there is a lot of available data, universities do not have a systematic approach to using it for making decisions. The process of identifying students at risk of dropping out often happens at the stage when they are already having some academic performance issues such as poor grades or low attendance rates.
The machine learning literature provides plenty of solutions to the problem of identifying students at risk. Various classification models, ranging from simple logistic regression to complex ensemble methods, are proven to be able to predict whether a particular student is likely to drop out on research datasets with reasonably good accuracy. However, these solutions are usually not implemented in practice because of various reasons. First, ensemble models require more complicated implementation. Second, features related to students’ socioeconomic background that are used in these models may require additional surveys to obtain. Third, the result of multi-class prediction does not directly map to a binary intervention trigger.
In order to answer the research questions, the study will investigate the following:
- Which SIS-native features about admission and academic performance are most important for student dropout prediction, and what performance can be reached using only this set of deliberately restricted features?
- What does the relative importance of first and second semester academic performance features tell us about the timeline of SIS-based institutional risk evaluation?
- How can the results of an interpretable machine learning model be implemented within the SIS as native functionality?
4.2. Dataset Description
The current analysis was based on the dataset titled “Predict Students Dropout and Academic Success” [23]. This dataset is publicly available at the website of the UCI Machine Learning Repository. The dataset is characterized by student-level records gathered from an institution of higher education and is commonly used to investigate the topics of student performance and dropout rates.
The dataset consists of 4,424 student records and 36 input attributes reflecting admission factors, demographic factors, academic performance indicators, and socioeconomic factors. The use of publicly available datasets allows reproducing previous studies in the educational data mining field.
4.3. Feature Selection and Relevance to Student Information Systems
The features in the data set have been classified in terms of categories that resemble common features of student information systems:
- Admission and Enrollment Features: These include features like admission grade, application mode, and previous qualification, indicating the readiness of students at admission.
- Demographic Features: These include age at enrollment, gender, and nationality of students.
- Financial Indicators: These are indicators of the availability of tuition payment and scholarships which may have an effect on student retention.
- Academic Performance Indicators (Primary Focus): Number of curricular units enrolled, evaluated, approved and semester grades. This category is an integral part of this research and shows student performance and engagement.
- External Indicators: These include macroeconomic indicators such as unemployment and inflation rates.
In this work, a certain set of attributes that are related to academic track record and student readiness is considered. These attributes include admission grade, age, and various indicators of the performance during the first and second semester, including grades, number of approved units, and evaluations. The choice of such a set of attributes is not arbitrary but is driven by constraints. All the attributes chosen for this research are data elements collected in the standard student information system. In other words, no additional data needs to be collected to train and run this model. No preprocessing operations are needed as well, apart from the standardization built into the stored LR formula, since the selected inputs map directly to SIS data elements minimizing the discrepancy between training and production data. Consideration of the academic performance during both semesters enables this research to explore how student progression indicators can affect the risk prediction based on SIS data.
The chosen features map directly to the data fields typically recorded in student information systems. This mapping forms one of the main criteria in designing the model for this research. It would be impossible to implement a model relying on features that are not normally collected by the institutions, no matter how good the predictive capability of this model.
Performance features such as completion of courses and grades in semesters are routinely tracked in student information systems and can easily be supplied to the model at the end of each semester through the typical semester-end process.
4.4. Model Development
The original dataset contains three outcome categories: Dropout, Enrolled, and Graduate. For the purpose of this study, the problem is formulated as a binary classification task. Students labelled as Dropout are treated as the positive class (at-risk students), while Enrolled and Graduate are grouped as the negative class. This binary formulation is a deliberate design choice. A binary output maps directly onto an institutional action: flag for advisor follow-up or do not flag, eliminating the additional decision logic required to translate a three-class prediction into an intervention trigger.
The dataset was pre-processed making sure it was consistent and suitable for training the models. Features for this study were chosen from admission characteristics and first- and second-semester academic performance based on their availability within student information systems.
The dataset was then split into a training set and a testing set in the ratio of 80:20. Such splitting helps in evaluating the model on unseen data and provides an estimate of its performance. The split used a fixed random seed (random_state = 42), giving 3,539 training and 885 test records, and the same split is used for every result reported in this paper, including the ablation study and the fairness evaluation. For LR, each feature was standardized with the mean and standard deviation of the training set, while RF used the raw values. LR used a maximum of 1,000 iterations and RF used 100 trees, both with random_state = 42 and otherwise default scikit-learn settings.
Two classification models were selected based on their suitability for institutional deployment rather than their performance ceiling.
- Logistic regression was selected as the primary deployment model for implementation. It offers directly interpretable parameters that enable advisors and administrators to comprehend the rationale behind the labelling of a certain student, a vital characteristic for deployment of the model in important decision support scenarios [15, 27]. Importantly, the prediction can be carried out by executing a regular SQL command on the weighted value of standardized SIS field data based on the model parameters. It does not require a Python runtime or model file on the server side.
- Random Forest was selected as an additional validating model for the following reasons. First, the Random Forest model is an ensemble model and offers an alternative approach to the modelling process. Also, the Random Forest ranks the features and therefore provides a global ranking of the selected predictors. It is used for offline validation only and does not generate the predictions or explanations shown to advisors.
The selection of these two models reflects an architectural decision rather than a comparative experiment: logistic regression for transparent, SQL-deployable prediction and random forest for complementary validation and evidence-based feature prioritization.
4.5. Evaluation Approach
Model performance was evaluated using accuracy, precision, recall, F1-score, and ROC-AUC. Accuracy measures overall classification performance, while precision indicates the proportion of students flagged as at risk who belong to the Dropout class. Recall measures the proportion of actual Dropout cases correctly identified. It is particularly important for an early-warning application because missed at-risk students may not receive timely intervention.
Recall for the at-risk students at the standard threshold of 0.5 is 0.63. When implementing the model in institutions, the threshold can be reduced in order to increase the number of students who fall under the at-risk category, though precision will decrease accordingly. The threshold is stored as a configuration parameter in the SIS architecture, and each institution will be able to tune their own sensitivity threshold independent of the annual model training process. The threshold tuning does not involve any technical processes other than changing a configuration parameter, and the model is trained annually with up-to-date student data.
The feature importance scores were extracted from the trained Random Forest model to help understand how much each individual feature contributes towards predicting the dropout risk. Within the proposed SIS framework, this analysis serves an important purpose: it identifies the relative importance of the selected predictors and provides an evidence-based ordering of risk factors for offline validation of the LR model; this ordering is not presented within the SIS interface.
The same split, seed, and threshold were used to perform two more analyses. The ablation study retrained both models on the feature subsets listed in Table 2, and the fairness evaluation calculated the group-level metrics for the age bands listed in Table 3 from the test-set predictions of the full LR model and an LR model that was retrained without age.
The models were trained using the Python programming language (version 3.14.3), with the Pandas library (version 3.0.2) being used for data preparation, while Scikit-learn (version 1.8.0) was used to train and evaluate the models. These libraries are readily available, free from commercial licensing and easy to use as well. The coefficients generated for logistic regression are static values stored in the proposed SIS framework, while the feature importance rankings generated for random forest are recorded for offline validation.
5. Conclusions
This study aims to address the gap between accurate prediction models for student dropout in experimental settings and practical implementation approaches that would fit within the institutional student information system. The results show promising predictive accuracy based on SIS-native data alone, while the suggested framework gives an opportunity to bridge the aforementioned gap by explaining how these predictions can be operationalized.
Both Logistic Regression and Random Forest, utilizing only SIS-native features related to admission grade, age at enrollment, and academic performance indicators from the first and second semesters, achieved 82% accuracy and an F1-score of 0.71 for the at-risk class. Random Forest feature importance indicates that second semester approved units and grades are the strongest predictors among the features included in the current model. These indicators are readily available within institutional SIS data without requiring additional data collection. The ablation study indicates that limiting the model to SIS-native features incurs an F1-score loss of approximately 0.08 with respect to all 36 attributes; the fairness study demonstrates that using age increases both recall and the false positive rate for students aged 25 or older, which is a trade-off that institutions should review at every retraining.
The main architectural innovation of this study is the suggested four-layer SIS integration model that links data collection and re-training, risk prediction, decision making in native SIS form, and monitoring of interventions. The architecture is based on functionality common for SIS and is built on SIS native features and binary risk prediction outputs that do not require an additional end-user analytics tool. Its evaluation in a live production environment is the next step.
This study contains a simple statement to be discussed. Retention interventions can be built based on data institutions have, models that institutions will be able to understand, and infrastructure institutions already use. This framework serves as an example of a different approach where deployability is considered from the very beginning and not as something separate after the model development stage. Treating deployability as one of the evaluation criteria along with prediction performance may reduce the gap between ML science and practice.
Author Contributions
The author solely contributed to the conception, design, analysis, and writing of this study.
Funding
This research did not receive any external funding.
Institutional Review Board Statement
Not applicable. This study did not involve human participants or animals; it used a publicly available, de-identified dataset.
Informed Consent Statement
Not applicable.
Data Availability Statement
The dataset used in this study is publicly available from the UCI Machine Learning Repository: Predict Students’ Dropout and Academic Success dataset. The code used to train and evaluate the models is available from the corresponding author upon reasonable request.
- M. Vaarma, H. Li, “Predicting student dropouts with machine learning: An empirical study in Finnish higher education,” Technology in Society, vol. 76, art. no. 102474, 2024, doi:10.1016/j.techsoc.2024.102474.
- B. Albreiki, N. Zaki, H. Alashwal, “A systematic literature review of student’ performance prediction using machine learning techniques,” Education Sciences, vol. 11, no. 9, art. no. 552, 2021, doi:10.3390/educsci11090552.
- C. Romero, S. Ventura, “Educational data mining and learning analytics: An updated survey,” WIREs Data Mining and Knowledge Discovery, vol. 10, no. 3, art. no. e1355, 2020, doi:10.1002/widm.1355.
- B. Duro, A. Gomes, F. B. Correia, A. R. Borges, J. Bernardino, “Machine learning and deep learning for dropout prediction in higher education: A review,” Computers, vol. 15, no. 3, art. no. 164, 2026, doi:10.3390/computers15030164.
- Y.-S. Tsai, D. Gašević, “Learning analytics in higher education: Challenges and policies: A review of eight learning analytics policies,” Proc. 7th Int. Learning Analytics and Knowledge Conf. (LAK ’17), pp. 233-242, 2017, doi:10.1145/3027385.3027400.
- O. Viberg, M. Hatakka, O. Bälter, A. Mavroudi, “The current landscape of learning analytics in higher education,” Computers in Human Behavior, vol. 89, pp. 98-110, 2018, doi:10.1016/j.chb.2018.07.027.
- A. Behr, M. Giese, H. D. Teguim Kamdjou, K. Theune, “Dropping out of university: A literature review,” Review of Education, vol. 8, no. 2, pp. 614-652, 2020, doi:10.1002/rev3.3202.
- L. Zhang, H. Rangwala, “Early identification of at-risk students using iterative logistic regression,” in Artificial Intelligence in Education: AIED 2018, vol. 10947, Springer, 2018, pp. 613-626, doi:10.1007/978-3-319-93843-1_45.
- S. M. Jayaprakash, E. W. Moody, E. J. Lauría, J. R. Regan, J. D. Baron, “Early alert of academically at-risk students: An open source analytics initiative,” Journal of Learning Analytics, vol. 1, no. 1, pp. 6-47, 2014, doi:10.18608/jla.2014.11.3.
- G. Akçapınar, A. Altun, P. Aşkar, “Using learning analytics to develop early-warning system for at-risk students,” International Journal of Educational Technology in Higher Education, vol. 16, art. no. 40, 2019, doi:10.1186/s41239-019-0172-z.
- F. Gutiérrez, K. Seipp, X. Ochoa, K. Chiluiza, T. De Laet, K. Verbert, “LADA: A learning analytics dashboard for academic advising,” Computers in Human Behavior, vol. 107, art. no. 105826, 2020, doi:10.1016/j.chb.2018.12.004.
- A. Van Leeuwen, M. Goudriaan, Ü. Aksu, “How to responsibly deploy a predictive modelling dashboard for study advisors? A use case illustrating various stakeholder perspectives,” Computers and Education: Artificial Intelligence, vol. 7, art. no. 100304, 2024, doi:10.1016/j.caeai.2024.100304.
- M. T. Ribeiro, S. Singh, C. Guestrin, “‘Why should I trust you?’: Explaining the predictions of any classifier,” Proc. 22nd ACM SIGKDD Int. Conf. Knowledge Discovery and Data Mining, pp. 1135-1144, 2016, doi:10.1145/2939672.2939778.
- S. M. Lundberg, S.-I. Lee, “A unified approach to interpreting model predictions,” in Advances in Neural Information Processing Systems 30, Curran Associates, 2017, pp. 4765-4774. [Online]. Available: https://proceedings.neurips.cc/paper/2017/hash/8a20a8621978632d76c43dfd28b67767-Abstract.html
- M. Nagy, R. Molontay, “Interpretable dropout prediction: Towards XAI-based personalized intervention,” International Journal of Artificial Intelligence in Education, vol. 34, pp. 274-300, 2024, doi:10.1007/s40593-023-00331-8.
- A. Villar, C. R. V. de Andrade, “Supervised machine learning algorithms for predicting student dropout and academic success: A comparative study,” Discover Artificial Intelligence, vol. 4, no. 1, art. no. 2, 2024, doi:10.1007/s44163-023-00079-z.
- S. Plak, I. Cornelisz, M. Meeter, C. van Klaveren, “Early warning systems for more effective student counselling in higher education: Evidence from a Dutch field experiment,” Higher Education Quarterly, vol. 76, no. 1, pp. 131-152, 2022, doi:10.1111/hequ.12298.
- A. E. Krumm, R. J. Waddington, S. D. Teasley, S. Lonn, “A learning management system-based early warning system for academic advising in undergraduate engineering,” in Learning Analytics: From Research to Practice, Springer, 2014, pp. 103-119, doi:10.1007/978-1-4614-3305-7_6.
- D. Bamufleh, M. A. Almalki, R. Almohammadi, E. Alharbi, “User acceptance of Enterprise Resource Planning (ERP) systems in higher education institutions: A conceptual model,” International Journal of Enterprise Information Systems, vol. 17, no. 1, pp. 144-163, 2021, doi:10.4018/IJEIS.20210101.oa1.
- A. Babatunde, D. Olaniyan, O. Akinpelu, A. Agbeyangi, J. Lukose, “A real-time early warning intervention system for at-risk students using predictive modeling and academic engagement metrics,” Procedia Computer Science, vol. 283, pp. 2486-2495, 2026, doi:10.1016/j.procs.2026.06.318.
- J. Gardner, C. Brooks, R. Baker, “Evaluating the fairness of predictive student models through slicing analysis,” Proc. 9th Int. Conf. Learning Analytics and Knowledge (LAK ’19), pp. 225-234, 2019, doi:10.1145/3303772.3303791.
- R. S. Baker, A. Hawn, “Algorithmic bias in education,” International Journal of Artificial Intelligence in Education, vol. 32, no. 4, pp. 1052-1092, 2022, doi:10.1007/s40593-021-00285-9.
- V. Realinho, J. Machado, L. Baptista, M. V. Martins, “Predicting student dropout and academic success,” Data, vol. 7, no. 11, art. no. 146, 2022, doi:10.3390/data7110146.
- H. Drachsler, W. Greller, “Privacy and analytics: It’s a DELICATE issue. A checklist for trusted learning analytics,” Proc. 6th Int. Conf. Learning Analytics and Knowledge (LAK ’16), pp. 89-98, 2016, doi:10.1145/2883851.2883893.
- S. Bhurre, S. Prajapat, “Analyzing supervised learning models for predicting student dropout and success in higher education,” in Advances in Computational Intelligence Systems: UKCI 2023, vol. 1453, Springer, 2024, pp. 234-248, doi:10.1007/978-3-031-47508-5_19.
- S. C. Matz, C. S. Bukow, H. Peters, C. Deacons, A. Dinu, C. Stachl, “Using machine learning to predict student retention from socio-demographic characteristics and app-based engagement metrics,” Scientific Reports, vol. 13, art. no. 5705, 2023, doi:10.1038/s41598-023-32484-w.
- C. Rudin, “Stop explaining black box machine learning models for high stakes decisions and use interpretable models instead,” Nature Machine Intelligence, vol. 1, no. 5, pp. 206-215, 2019, doi:10.1038/s42256-019-0048-x.